Updated at 3:55 p.m. Monday December 12, 2022
Once a week we show many of the actual forecast maps not just provide the links to these maps. This makes it easier for the reader. Our report provides a separate forecast for Days 1 and 2, Days 1-5, Days 6 -10, Days 8 – 14, and weeks 3 and 4. We also include a next-day and 10-Day Global Average Temperature and Cumulative Precipitation Forecast. This provides information that is useful to readers in terms of planning their activities for the weekend and the next 28 days. I will update the article with more recent short-term forecasts: Saturday through Monday
Over the weekend and into Monday there will be frequent updates of the short-term forecast.
Looking out 28 days, what we see is
- For Temperature: Very cold air entering the Northwest and over the course of 28 days moving east to the Northern Great Plains while moderating to some extent.
- For Precipitation: An unusually wet pattern that gradually becomes more spotty. We will learn more on Thursday when NOAA issues its Seasonal Outlook. But it looks like it will evolve into a few months of Southern Tier drought for the first part of 2023.
When we publish on Friday night, it provides a 28-day view of the future. What is important is that this is a longer-term view than one that is typically available in the Media and online. The amount of information about weather provided to the general public is quite limited. It is available to the public. But most do not have the time or level of interest to seek it out. My articles are at an intermediate level between what is generally available from the Media (ten-day forecasts and a good explanation for the first couple of days and the information used by meteorologists to produce these forecasts for general distribution. So I focus on longer timeframes and more depth into why the forecasts are what they are.

We will be doing selected updates all weekend. Links are generally provided so the reader can update any of the graphics themselves (plus often you will end up with a lot of additional information).
–
This weekend you can again also look at the recent NOAA End of Month update of the December Outlook. That report can be accessed HERE.In many ways, the Friday 28-Day Outlook is more useful than the Monthly Update especially when it is published within a few days of the next Month’s Outlook. It is more up-to-date and provides more detail in terms of dividing the month into a number of different time periods, but the End of Month Outlook contains other very useful information. It is best to look at both even though there is a lot of overlap. Later in the month, the 28-Day outlook really overrides the end of monthly Outlook because it is more up-to-date. Forecasting is a process and NOAA has a pretty good system for issuing updates on a regular basis with three major Updates during the month namely: A. The Update on the status of ENSO which is issued on the Second Thursday, B. The new Four-Season Outlook which also included the Mid Month outlook for the subsequent month C. The End-of-Month Outlook issued on the last day of the month contains the updated Outlook for the Subsequent Month plus a drought outlook for the Subsequent month. I add a lot of additional information in my article reporting on what NOAA issues at the end of the Month. |
48-Hour Forecast
Maps that relate the forecast to geography can be updated by clicking Here for Day 1 and Here for Day 2. I will be doing the updating during the period described in the title of the article but if you happen to read this article later you can get updates via the links provided.
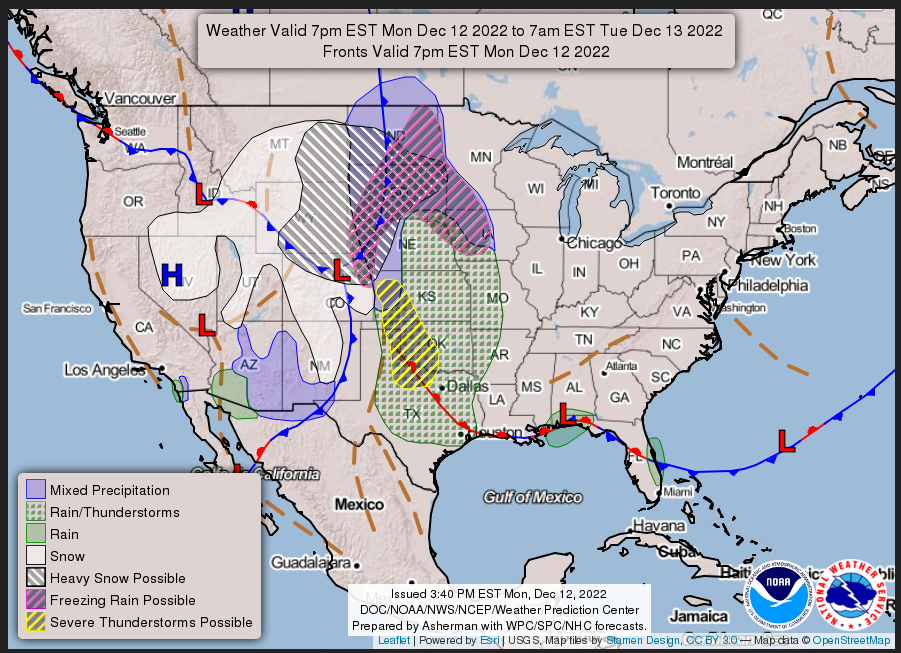
Monday Night
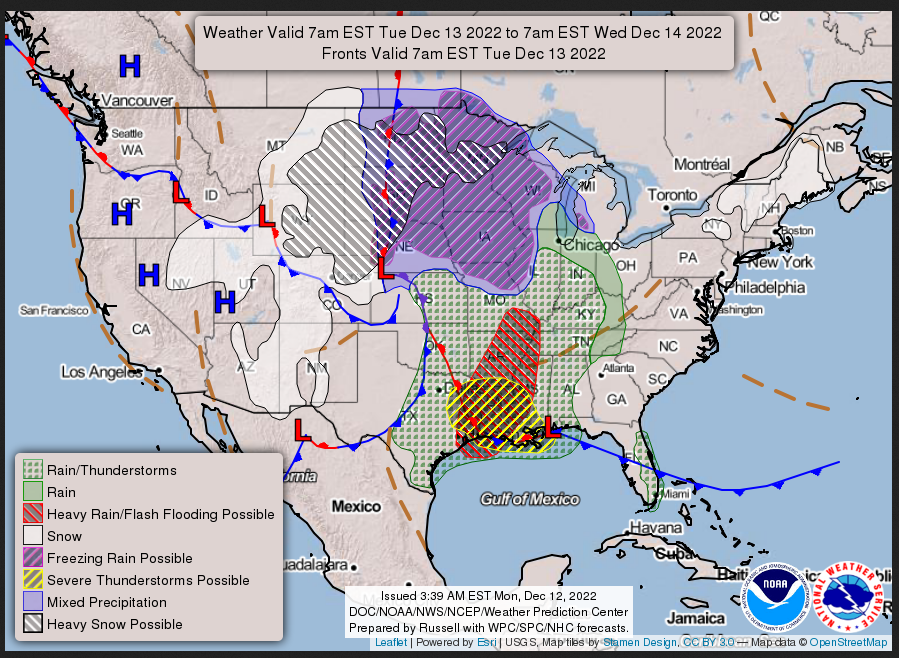
Tuesday
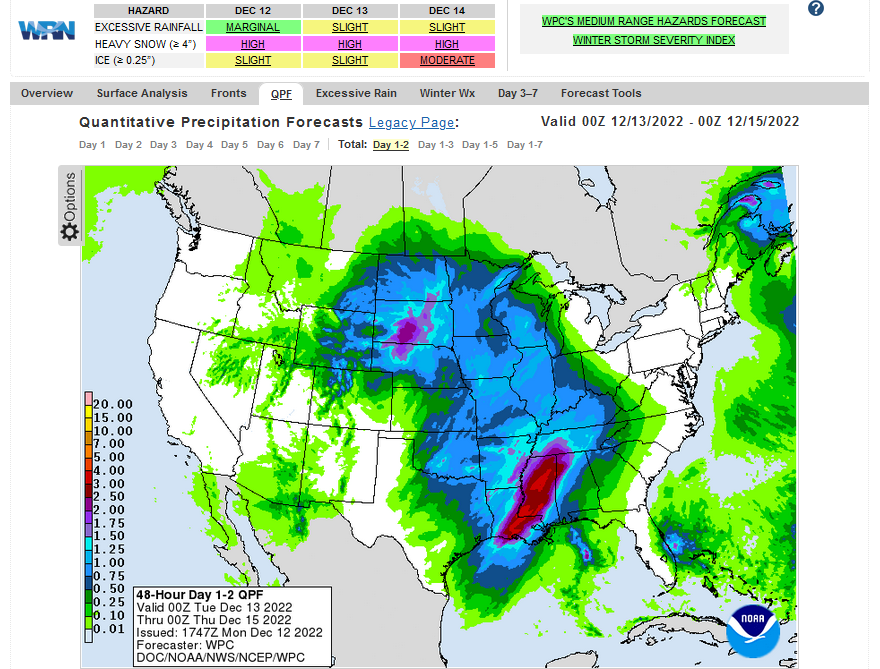
Below is the current two-day cumulative forecast of precipitation (Updates can be found HE RE) Later we show a similar map that shows five days of cumulative precipitation. The images in the article are frozen but notice that if you go to the link provided you can get a variety of forecasts. That is true for many of the links provided in this article.
Here is the NWS Short Range Forecast (It is updated by NWS twice a day (a.m. and p.m) and these updates can be found here. We post at least one of those updates daily, over the weekend we usually post both.
Short Range Forecast Discussion
NWS Weather Prediction Center College Park MD
251 PM EST Mon Dec 12 2022

Valid 00Z Tue Dec 13 2022 - 00Z Thu Dec 15 2022

...Major storm system to bring significant, widespread weather hazards
from severe weather to blizzard conditions to the central U.S...

...Flash flooding and severe weather possible from Southern/Central Plains
tonight to Lower Mississippi Valley/Southeast by midweek...

...Heavy snow, blizzard conditions, and freezing rain for the Northern and
Central Plains...

A deep, upper-level trough over the West will shift slowly eastward
through the period. A strong, embedded vort max ejecting over the High
Plains as upper-level heights continue to fall ahead of the approaching
trough will lead to intense cyclogenesis in the lee of the Rockies. This
developing storm system will produce numerous, widespread, and impactful
weather hazards in the heart of the country this week. Both flash flooding
and severe weather will be a risk in the Southern Plains east into the
Lower Mississippi Valley in the warm sector of the system. Anomalously
high moisture will surge northward ahead of a cold front sweeping eastward
late tonight. Increasing shear and cooling air aloft will provide the
necessary ingredients for a band of intense convection to develop along
the front north to south in the Central and Southern Plains. Some intense
downpours will be possible late Monday night/early Tuesday morning that
may lead to isolated instances of flash flooding, and there is a Marginal
Risk of excessive rainfall (level 1/4) in effect for a north-south axis
from southern Kansas south through western Oklahoma and northwest Texas.
In addition, there is a Slight Risk of severe weather (level 2/5) from the
Storm Prediction Center for western Kansas and the Oklahoma Panhandle in
vicinity of the surface low and beneath cooling air aloft where strong
wind shear and enough CAPE could produce a few instances of severe hail,
wind gusts, and a tornado or two.

The greater risk for severe weather and flash flooding will be on Tuesday
as height falls with the upper-level trough begin to spread farther
eastward over the Plains and additional moisture surges northward from the
Gulf of Mexico contributing to higher CAPE values in the warm sector over
eastern Oklahoma and Texas and into the Lower Mississippi Valley. The line
of intense convection along the cold front will continue eastward with the
potential for additional isolated supercells to develop in the warm sector
ahead of the line. There is a Slight Risk of Excessive Rainfall (level
2/4) centered on the Lower Mississippi Valley as a couple rounds of
rainfall between the initial supercells and convective line will produce
rainfall totals between 1-2 inches, with localized areas of 2-4+ inches
leading to some scattered instances of flash flooding. In addition, there
is an Enhanced Risk of severe weather (level 3/5) for far northeastern
Texas and northern Louisiana where severe hail, winds, and tornadoes,
including the potential for a couple strong tornadoes, will accompany any
initial isolated supercells ahead of the line as well as embedded
supercells within the line. A broader Slight Risk (level 2/5) is in place
for eastern Texas, southern Arkansas, Louisiana, and southwestern
Mississippi. Flash flooding and severe weather threats shift eastward to
the central Gulf Coast and interior portions of the Southeast on
Wednesday. Multiple rounds of heavy convective and training rainfall are
forecast to develop on Wednesday as Gulf moisture surges north and
interacts with a north-south oriented cold front sweeping through the
region. The heaviest axis of rainfall is likely to occur from Louisiana
through north-central Mississippi and western Tennessee. Supercell and
tornado development are also possible.

Meanwhile, cold air will continue to surge southward on the backside of
the low as warm air aloft surges northward leading to widespread wintry
precipitation and heavy snow for portions of the Northern and Central
Plains and Upper Midwest. Snow accumulations through Tuesday morning will
generally range between 6-12 inches, centered on the Northern High Plains.
The highest snow totals are currently forecast for western South Dakota
and northwestern Nebraska, where upwards of 18-24 inches is possible.
Winds will rapidly strengthen as the pressure gradient increases with the
deepening low pressure center, leading to the potential for blizzard
conditions in some locations. Currently, Blizzard Warnings are in effect
along and near the Front Range, though the strong, gusty winds upwards of
40-50 mph will still lead to the potential for blowing snow and
significant travel impacts across the region. Farther east, accumulating
sleet and ice are also expected for portions of the eastern Dakotas into
the Upper Midwest. The current risk for the greatest ice accumulations
over a tenth of an inch is forecast for the eastern Dakotas, southwestern
Minnesota, and northwestern Iowa. Some locations in the Dakotas in
particular will likely see both accumulating ice and snow. Up to a quarter
inch of sleet may also fall in the aforementioned areas. Ice Storm
Warnings are in effect for parts of far northeastern South Dakota.
Temperatures in the teens and 20s will spread southward from the Northern
High Plains today into the Central High Plains Tuesday and the Southern
Plains by Wednesday.

Snow will continue in the west under the influence of the upper-level
trough as well as a Pacific cold front continuing through the Southwest
and Southern Rockies and a second frontal boundary slowly meandering
southward through the Central Rockies, Great Basin, and Pacific Northwest.
The snow will begin to taper off from west to east through the day
Tuesday, lingering longest in the Northern and Central Rockies. Additional
accumulations between 6-12 inches, locally higher, will be possible for
the mountain ranges of the central Great Basin, Central and Southern
Rockies, and Arizona. Lower elevations will continue to see a mix of some
lighter rain and snow, with little to no accumulations expected.
Temperatures will remain 10-20 degrees below average for this time of
year, with highs ranging from the 20s and 30s for the Great Basin and
Northern and Central Rockies, 40s for the Pacific Northwest and Southern
Rockies, and 50s for California and the Southwest.
This animation shows how things may play out over the next 60 hours. To update click here.
| Temperature (Maximum or Minimum Anomaly) for Days 3 – 7 |
Precipitation (Five days of cumulative precipitation) |
| https://www.wpc.ncep.noaa.gov/medr/medr_mean.shtml | https://www.wpc.ncep.noaa.gov/qpf/day1-7.shtml |

| Notice the warm minimums in the Great Plains in advance of a cold air intrusion. It is wet in most places in terms of the five day cumulative. |
ATMOSPHERIC RIVERS
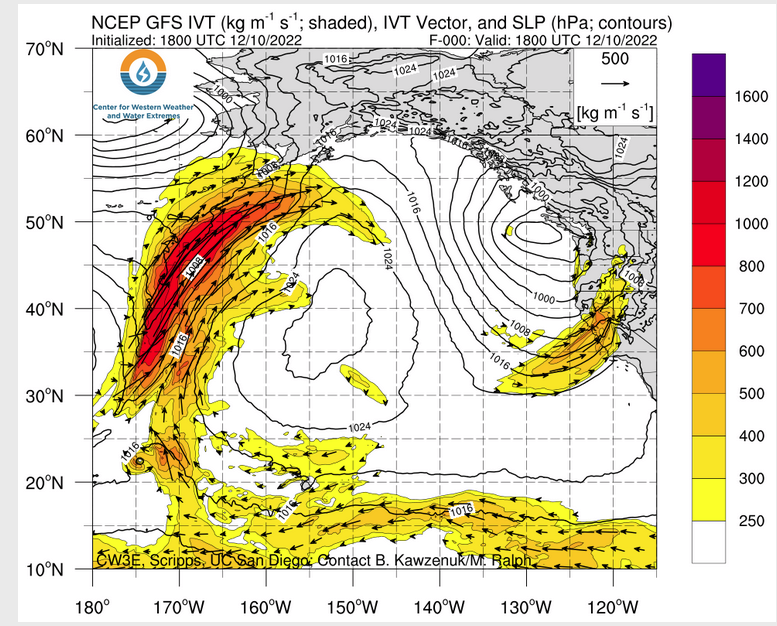
Click HERE to update. Here is some useful information about Atmospheric Rivers.
Now we look at Intermediate-Term “Outlook” maps for three time periods. Days 6 – 10, Days 8 – 14, and Weeks 3 and 4. An outlook differs from a forecast based on how NOAA uses these terms in that an “outlook” presents information as deviation from normal and the likelihood of these deviations.
I have provided the maps so you do not need to click to get them. But they do not update daily. But you can get the current images simply by clicking on the links provided. Then hit the return arrow at the upper left of your screen to return to the article. There is no need to do that right away since what is published today is up to date as of the original publish date so they can be updated during the weekend if you want. It is probably not necessary to do that. The Week 3 – 4 Outlook only updates on Fridays.
Below are the links to obtain updates and additional information. They are particularly useful if you happen to be reading this article significantly later than when it was published. I always try to provide readers with the source of the information in my articles.
–
| Look at that cold air anomaly! Two dry areas. |
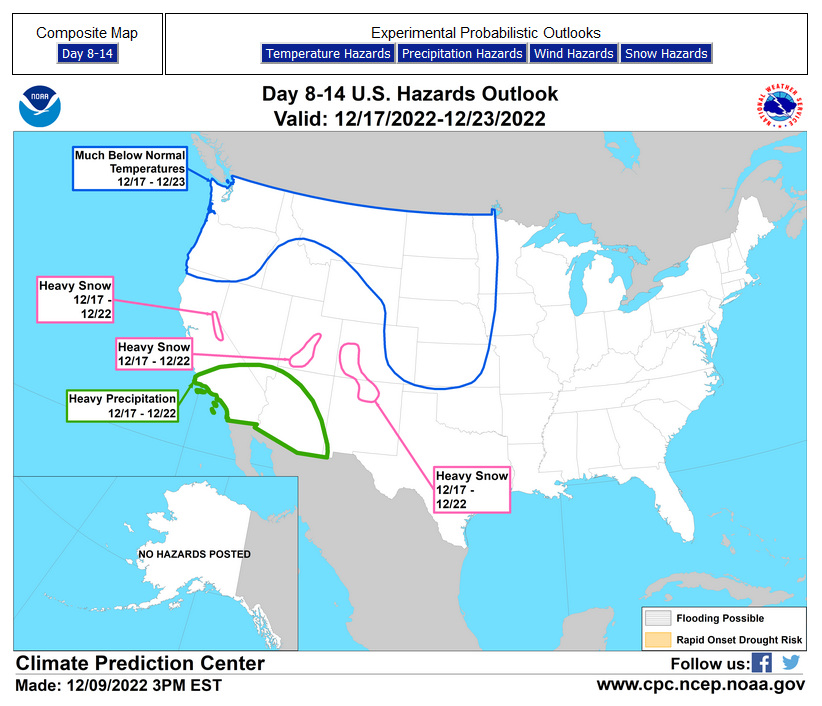
Looking at Weeks 8 – 14 Day
Now Precipitation
| Cold air moderates a bit but begins to move to the east. Where is the Southwest Drought? This is most likely temporary. |
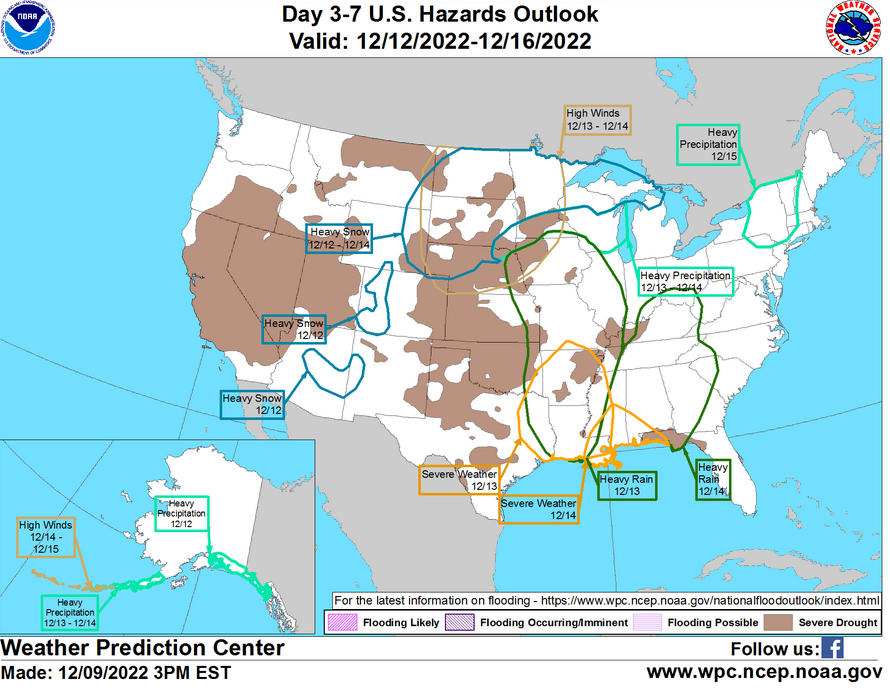
HAZARDS OUTLOOKS
Click here for the latest complete Day 3 -7 Hazards forecast which updates only on weekdays. Once a week probably Monday or Tuesday I will update the images. I provided the link for readers to get daily updates on weekdays. Use your own judgment to decide if you need to update these images.
Now we address Weeks 3 and 4. This is a time frame that is very important. It is half of the 28-Day forecast period. That is why we include the discussion that accompanies the maps.
–
Less wet and the cold air is moving east. –
Week 3-4 Forecast Discussion Valid Sat Dec 24 2022-Fri Jan 06 2023
This Week 3-4 period encompasses the busy holiday travel season, beginning on Christmas Eve and ending on January 6th, 2023. It follows a Week-2 period which favors colder than normal temperatures throughout nearly all of the CONUS with unsettled weather across both the CONUS and Alaska. It is expected that these conditions will continue into Week-3 and then will relax during Week-4. This particular forecast has relatively high confidence given the strong anomalies in Week 2 that are anticipated to persist into Week 3, along with overall consistency amongst the dynamical and statistical tools.
Over the Pacific region, La Niña conditions persist across the equator, with below normal sea surface temperatures (SSTs) and reduced tropical convection in all Niño regions. The Madden-Julian Oscillation has been quiescent for the past several days and will remain so during Week-1. What enhanced convection that does exist resides near 70 to 80E. However, this convection is not associated with the MJO nor is it in a favorable location to interact with the Asian jet and produce a downstream teleconnection. There is some indication that the MJO may emerge over the Indian Ocean in RMM phases 1 or 2 during Week-2. However, any teleconnections forced by this possible emergence will likely only impact the Week-4 period. Thus, given the uncertainty of the MJO forecast and its reduced impact should it occur, the MJO was not considered as a major driver for this particular Week 3-4 period.
While MJO-forced teleconnections are not anticipated to impact the Pacific, there are some important features in the 500-hPa height field to discuss. The PNA is anticipated to shift from its current negative state to near neutral conditions in Week 2. This Week-2 evolution projects onto the strong ridging forecasted to establish from the Gulf of Alaska northward into the Arctic. Interestingly, this ridging takes on the form of an omega block with two lobes of below normal heights to the southeast and southwest of the ridging. While Pacific-based blocks don’t last as long as their Atlantic counterparts, they do tend to 1) force the storm track either northward or under the block and 2) retrograde westward with time. The syntopic-scale storms blocked northward will likely impact the Arctic and those undercutting the block are likely to impact the CONUS. As the ridging retrogrades to the west, negative PNA conditions are expected to fully re-establish by Week-4. However, the impact of the anticipated ridging over Alaska near the end of Week 2 and beginning of Week 3 is a highly favorable pattern to send very cold Arctic air masses down the Canadian Plains into the CONUS.
Currently, the NAO is strongly negative and is anticipated to remain negative during Week-1 with some relaxation indicated by the dynamical models during Week-2. While strong MJO-forcing on the NAO is not apparent during this period, once established, atmospheric blocks, such as the negative NAO, often persist for many weeks due to wave breaking activity along their periphery. Consistent with this, the dynamical models, particularly the ECMWF, are anticipating ridging to re-establish over Greenland and the Labrador Sea during Week 3-4, which would project onto ongoing negative NAO conditions. Negative NAO conditions imply a continued risk for cold and storminess in the eastern CONUS.
The negative NAO is highly correlated with the ongoing strong negative AO in the Northern Hemisphere. The AO is forecasted by the dynamical models to remain negative through Week 2, with some uncertainty in Week 3-4. However, the negative AO is favored to continue into Week 3-4 because the pattern during Week 2 is quite conducive to significant fluxes of latent and sensible heat into the Arctic through the Bering Strait. While these fluxes, along with those in the Atlantic near the Kara and Barents Sea, are often the harbinger of sudden stratospheric warmings, the dynamical models are currently not forecasting one. There is some warming indicated near 100-hPa, likely deriving from the tropospheric warmth associated with the negative AO. Thus, while the negative AO is correlated with cold across the mid-latitudes, there is no indication at this time that the stratospheric polar vortex will play a major role in this Week 3-4 period.
The temperature outlook for this Week 3-4 period represents a blend of the aforementioned physical drivers, dynamical model guidance, statistical guidance from La Niña, and persistence from Week-2 into Week-3. With respect to the dynamical models, most weight was given to the ECMWF, as its recent skill scores have outperformed the GEFS, CFS, and JMA. In particular, the ECMWF is favored over the GEFS because the GEFS’s Week-2 forecasts have had significant run-to-run swings, likely stemming from the difficulty it is having with depicting the interaction of synoptic-scale cyclones with the negative-NAO (block). These errors can propagate and magnify in time, negatively impacting the longer-lead Week 3-4 forecast. The ECMWF has had a much better handle on suppressing these cyclones to the south and maintaining cold air damming along the East Coast. In short, widespread below normal temperatures are expected across the CONUS, in response to 1) the Alaskan ridging at the beginning of Week 3, 2) ongoing negative AO/NAO conditions, 3) strong dynamical model agreement with support from the statistical models, and 4) the large coverage in snow that could develop over much of CONUS during the next couple of weeks and that already exists across Canada. Anomalies during the Week 3 period are anticipated to overwhelm the entire Week 3-4 period, even should parts of the CONUS be anomalously warm during Week 4. For specific regions, the highest probabilities for cold exist over the Northern Plains, consistent with La Niña. Warmth is expected across Florida and has the potential to extend further northeast should the southeast ridge associated with La Niña be active, especially during Week-4. However, the possibility for cold air damming east of the Appalchians exists in the Piedmont, which often occurs with Miller B-type storms common during La Niña. This tilts the forecast toward below normal in that region. Maine is expected to be above normal, as is often the case with negative NAO conditions. There is strong model agreement for above normal temperatures near New Mexico, as low level cold air east of the high terrain may not penetrate westward. For Alaska, above normal temperatures are most probable in the Western Mainland and Aleutians as the Alaskan ridge favors southerlies in that region. Below normal temperatures are favored in the Panhandle as the negative PNA redevelops.
The precipitation outlook for this Week 3-4 period relies heavily on ECMWF calibrated model guidance, La Niña composites, and the anticipated presence of a sharp baroclinic zone stretching from Texas to the Eastern U.S. Thus, above normal precipitation is favored across the Pacific Northwest and Northern California. This precipitation will likely result in Week 3 from storms undercutting the omega block in the Pacific and during Week 4 as the negative PNA re-establishes a large-scale trough near the West Coast. Above normal precipitation is also expected from northeast Texas extending to Maine, along a well-defined baroclinic zone as the Arctic air advances southeastward. The highest probabilities are in the Ohio Valley, which is consistent with La Niña. A small region of elevated below normal probabilities resides in southwest Texas, consistent with most model guidance. Finally, in Alaska, above normal precipitation is favored over the Western Mainland and Aleutians on account of strong southerly to south-westerly flow ahead of the trough in eastern Asia. As the ridge in Alaska retrogrades westward through Week 4, most of the state should dry out.
For Hawaii, the multi-model ensemble from SubX shows above normal temperature probabilities of over 80%, which corresponds to the above normal SSTs surrounding the islands. Above normal precipitation also appears probable, particularly in the southeastern islands.

| It is important to note that the Week 3 -4 Outlook is prepared by a different team than the 6 -10 and 8 – 14 day Outlooks as well as the update of the monthly outlook. |
Month to Date Information (I have included it even though it only shows one day of information, next week it will show 8 days so to avoid confusion I included it but it is not very useful this week.)
Temperature month to date can be found at https://hprcc.unl.edu/products/maps/acis/MonthTDeptUS.png
Precipitation month to date can be found at https://hprcc.unl.edu/products/maps/acis /MonthPNormUS.png
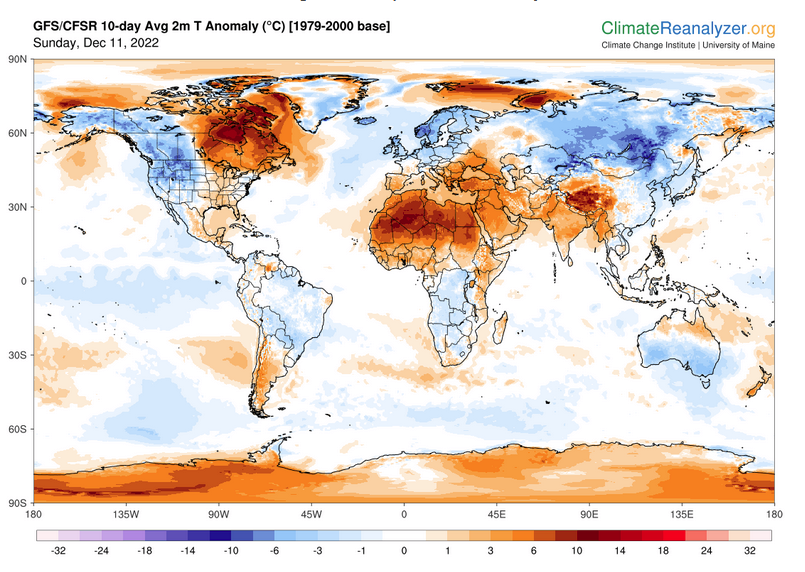
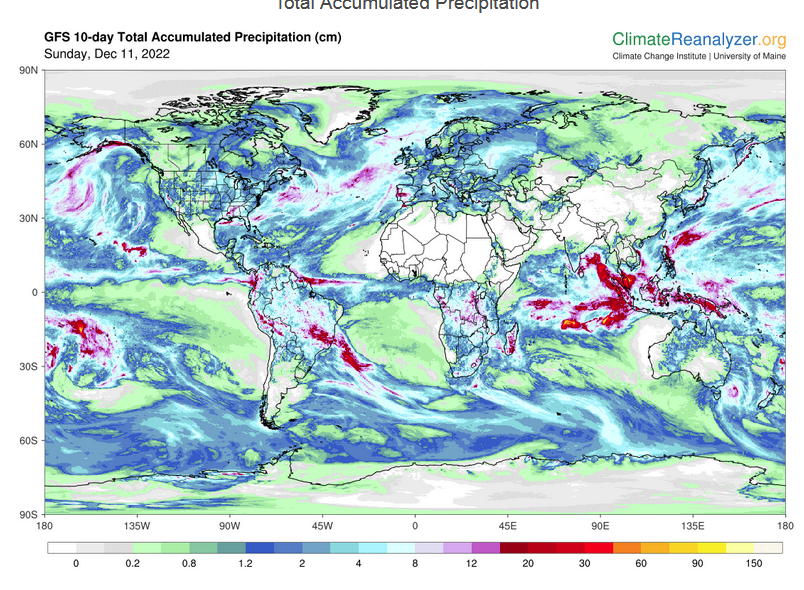
World Forecast
Below are the current precipitation forecast and the 10-Day forecasts for temperature and precipitation. Updates and additional information can be obtained HERE
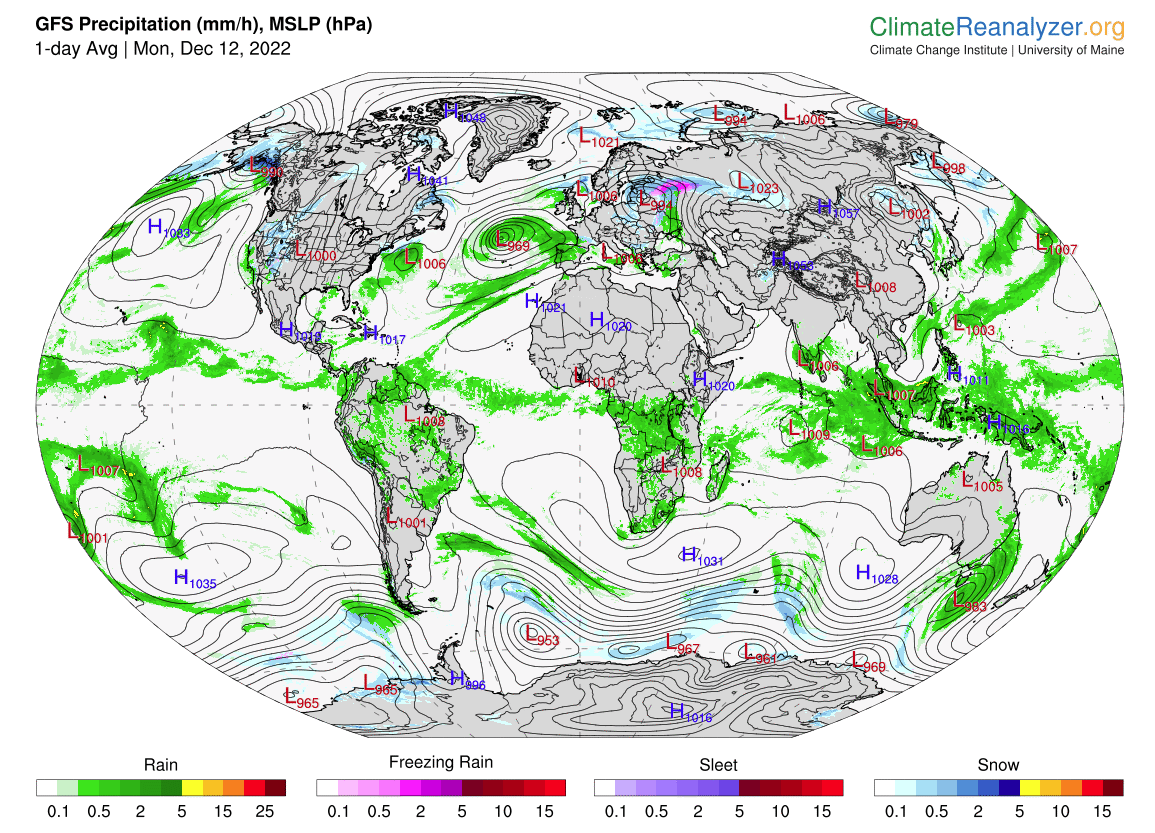
. Much of this information is provided by the University of Maine. They draw upon many different sources.
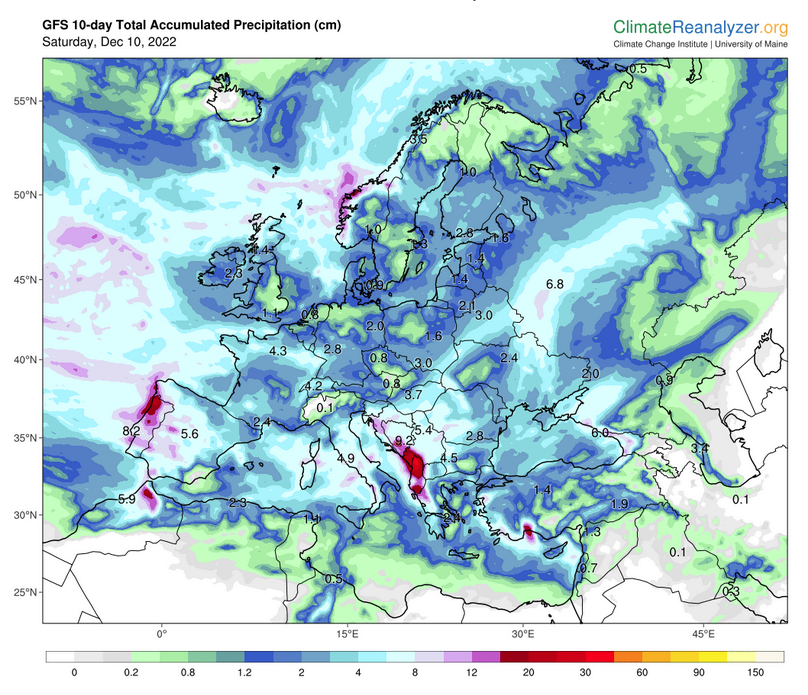
Looking just at Europe
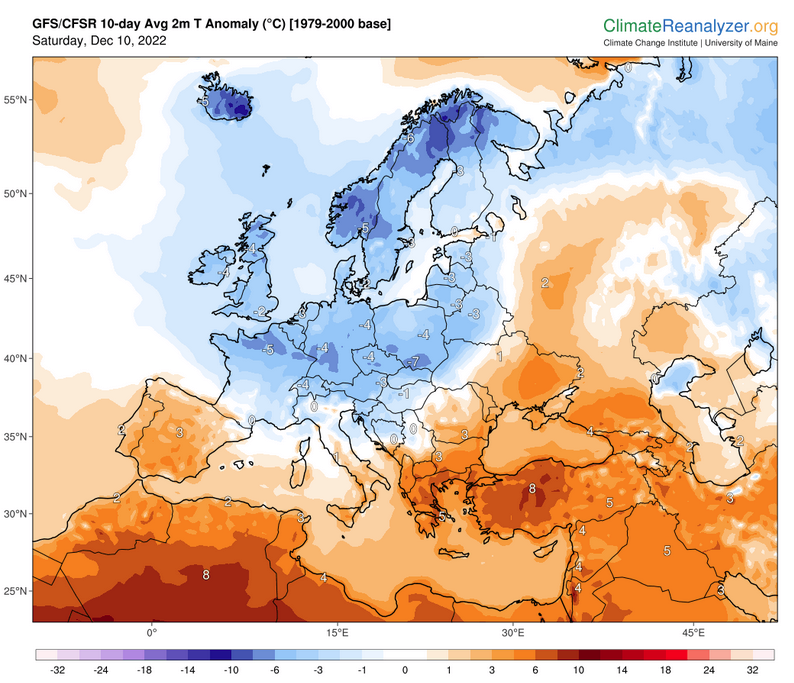
Looking just at Europe
Worldwide Tropical Forecast (This is a NOAA Product)
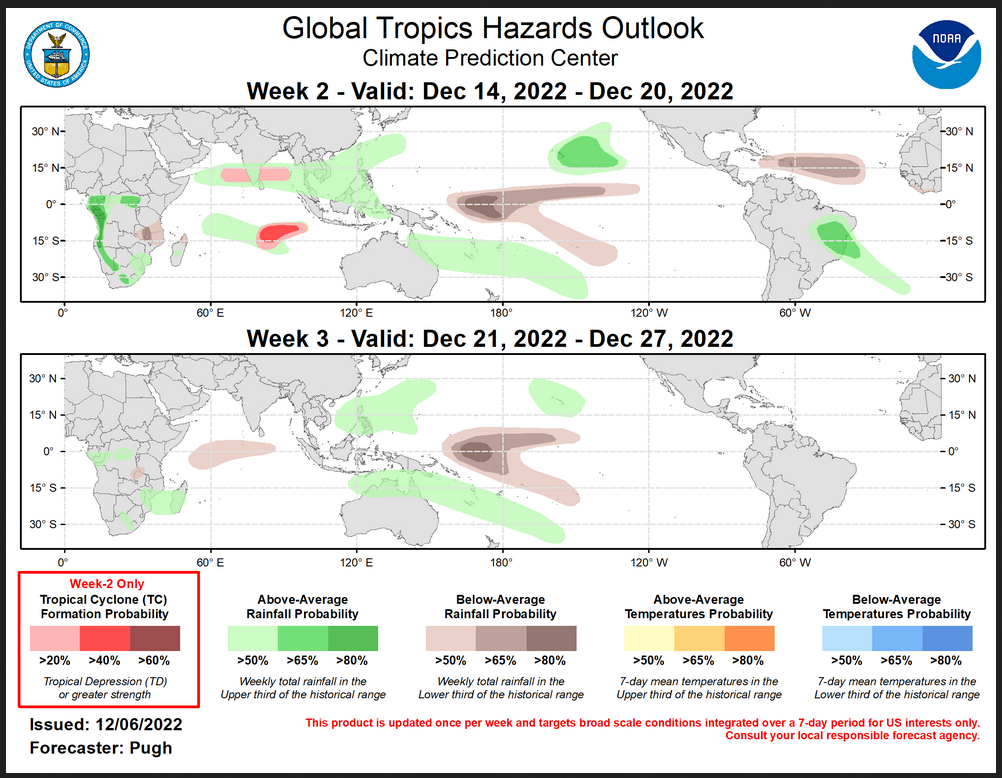
This graphic updates on Tuesdays) If it has not been updated, you can get the update by clicking here Readers will only have to do that if they are reading this article much later than the date of it being published.
Addendum
Here is some information related to a question I was just asked. It is not the write-up I was looking for but it will do for now. It is described as relating to jet streaks but is related to the fronts associated with the Jet Stream and Rossby Waves and short ways. Supposedly it does not work at the bend in the wave but I have still found it useful. Source is HERE
“Some good further discussion of the inertial-advective wind can be found in chapter 2 of Lackmann’s Midlatitude Synoptic Meteorology or chapter 6 of Martin’s Mid-latitude Atmospheric Dynamics.
The upper level divergence and convergence due to curvature and jet streaks mentioned here aid with ascent and descent, respectively.
Above is a conceptual model of the thermally direct and indirect circulations induced by the upper-level convergence and divergence in the streak region. In the entrance region, divergence on the right side induces ascent of warm air south of the jet, and this air moves northward where convergence forces it to descend below the left entrance region (see cross section A to A’). In the exit region, a circulation develops in the opposite sense, both in direction and in terms of thermal structure – the cool air from the north side of the jet is ascending.
This is the most basic conceptual model to illustrate jet streak circulations. In reality, jet streaks rarely occur in a uniform, zonal manner as above, and the vertical portions of the transverse circulations are much more gently sloping.
Here’s a more realistic view of jet streak circulations, in which flow is induced along sloped isentropic surfaces (ignoring diabatic heating) toward the divergent regions.
Here we can see that each side of the jet streak can induce strong southerly flow at low levels. Additionally, a northerly low-level jet of sorts can be induced in the left entrance region. This can make the entrance region a favored area of heavy snow development in winter months.
Overall, the strength of these circulations will depend upon the shape and position of the jet streak within the overall curvature of the jetstream – in many cases, the effects of curvature dominate the streak circulations, as is the case with the rarely observed “jet streak in the base of the troughâ€. We’ll now analyze some examples.”

