Updated at 9 p.m. EST December 6, 2022. It now provides a little glimpse of Tuesday Night and Wednesday.
Here is what we are paying attention to tonight and the next 48 hours from Tuesday Afternoon’s NWS Forecast. During the week we will publish each evening. On Weekends, we will publish Friday night and do updates during the weekend. Either way, you will have current forecasts with a longer forecast on the weekends. This is a combination of a U.S. plus World Weather Article.
Short Range Forecast Discussion
NWS Weather Prediction Center College Park MD
303 PM EST Tue Dec 06 2022

Valid 00Z Wed Dec 07 2022 - 00Z Fri Dec 09 2022

...Isolated flash flooding possible over the Central Plains later on
Wednesday into Thursday...

...Accumulating snows across the Northern Plains and through portions of
the Northern and Central Rockies...

...Widespread much above average temperatures across the southern and
eastern U.S. in stark contrast with Arctic air across the Northern
Plains...
Continuation of the NWS Short Range Forecast (It is updated by NWS twice a day and these updates can be found here. We post at least one of those updates daily, sometimes both.
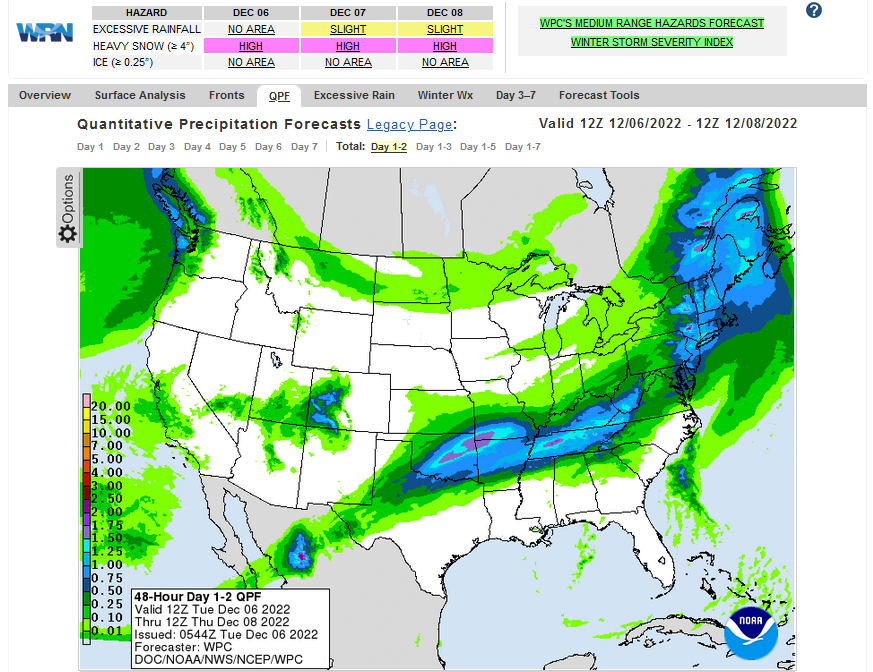
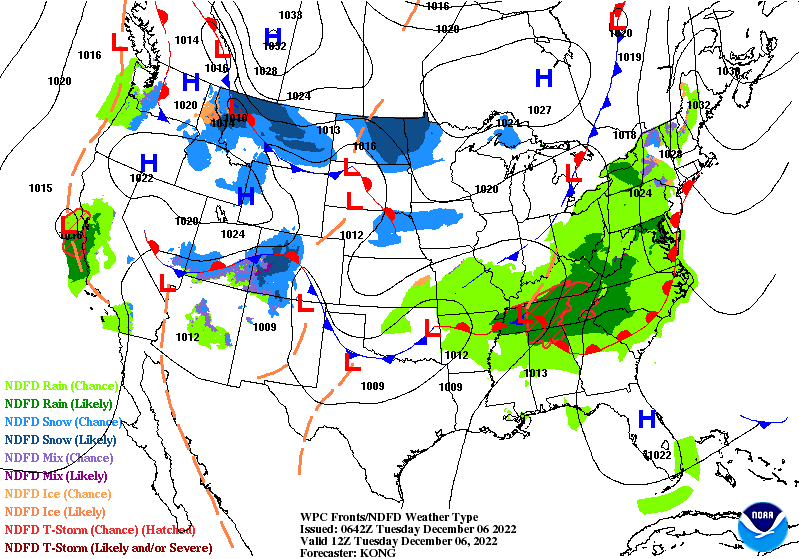
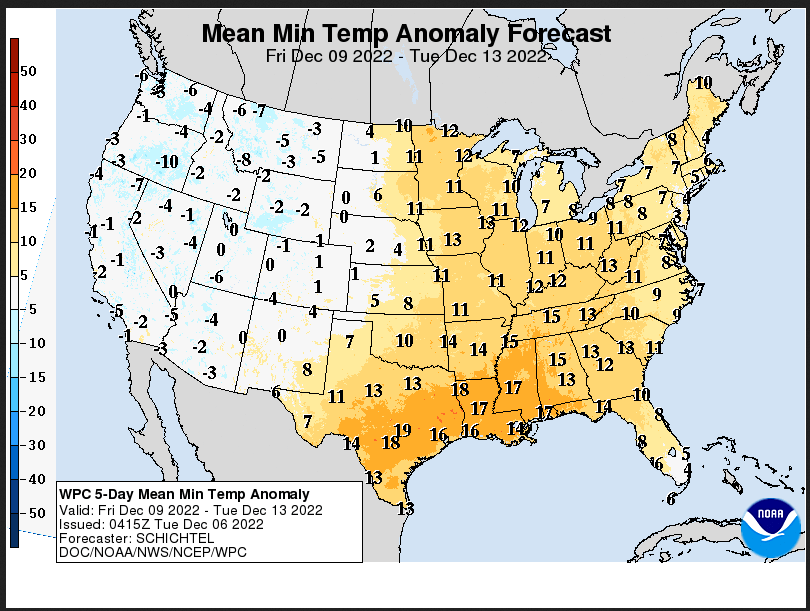
A slow-moving front draped across the south-central portion of the CONUS
continues to focus much of the active weather over the CONUS, and will
continue to do for the next several days. Since this morning, scattered
showers and thunderstorms have expanded from the Tennessee Valley into
portions of the Northeast and New England as an influx of moisture races
toward the Eastern Seaboard. Moderate to locally heavy rainfall is
possible with this activity, although no excessive rainfall is anticipated
today.

In the meantime, a jet stream arriving from the Eastern Pacific will begin
to interact with a moisture laden portion of the front across the Southern
Plains. This interaction will yield a more robust round of heavy rain from
the Southern Plains eastward across the Lower Mississippi Valley, and into
the Tennessee Valley Wednesday through Thursday morning. In all, the
latest WPC forecast calls for rainfall totals upwards of 2 inches over
portions of the Ozarks through Thursday. This rainfall may lead to
isolated instances of flash flooding over portions of Eastern Oklahoma,
Missouri, and Arkansas through Thursday morning, where a Slight Risk
(level 2/4) of Excessive Rainfall is in effect. In addition, temperatures
will be cold enough to support wintry precipitation across portions of the
Central Plains.

The overall pattern supporting the wet weather from the southern Plains
into the Northeast will also support much above average temperatures over
the next few days over the Central to Southern Plains, and  eastward into
the East Coast.  After a few record high minimum and maximum temperatures
were set yesterday over the Southern Plains, a much more expansive area of
potentially record high minimum (and a few daily maximum) temperatures are
forecast Wednesday and Thursday across portions of the southern Plains,
Lower Mississippi Valley, Tennessee Valley, Mid-Atlantic and Northeast.

Below average temperatures over the next few days are expected west of the
Rockies and across the Northern Plains. The greatest below average
temperatures are expected across the Northern Plains where Arctic air will
keep temperatures 15-20 degrees below average from eastern Montana, across
the Dakotas and into Minnesota Wednesday into Thursday.  However, record
cold temperatures are not expected across this region.  This area will
also see the threat of periods of accumulating snows over the next two
days.  Amounts are not expected to be very heavy, generally in the 1 to 4
inch range. The heaviest snows over the next few days expected through the
Rockies of Colorado, northwest Montana and northern Idaho where totals in
excess of a foot are possible. By Thursday however, another Pacific system
arriving along the West Coast will spread low elevation rainfall and high
elevation snows to the Pacific Northwest into Central California. The
current WPC Winter Storm Severity index currently indicates minor (level
1/5) to locally moderate (level 2/5) impacts are possible from this wintry
weather over the Olympics and Cascades Thursday.
Day 1 and Day 2 Maps can be found by clicking Here for Day 1 and Here for Day 2.
Tuesday Night

Wednesday

Current Two-day forecast of heavy precipitation (Updates can be found HERE)
Here is a 60-hour animated forecast map that shows how the short-term forecast is expected to play out
If it needs to be updated click here.
ATMOSPHERIC RIVERS
Click HERE to update. Here is some useful information about Atmospheric Rivers.
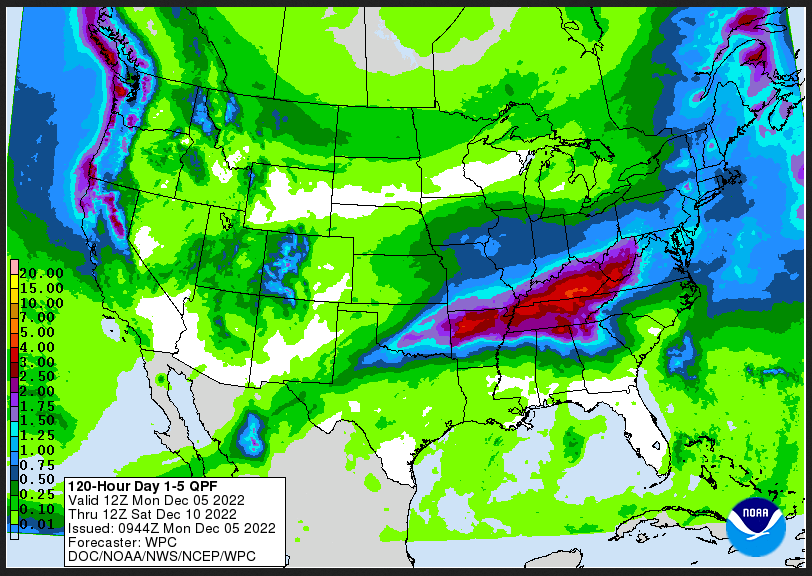
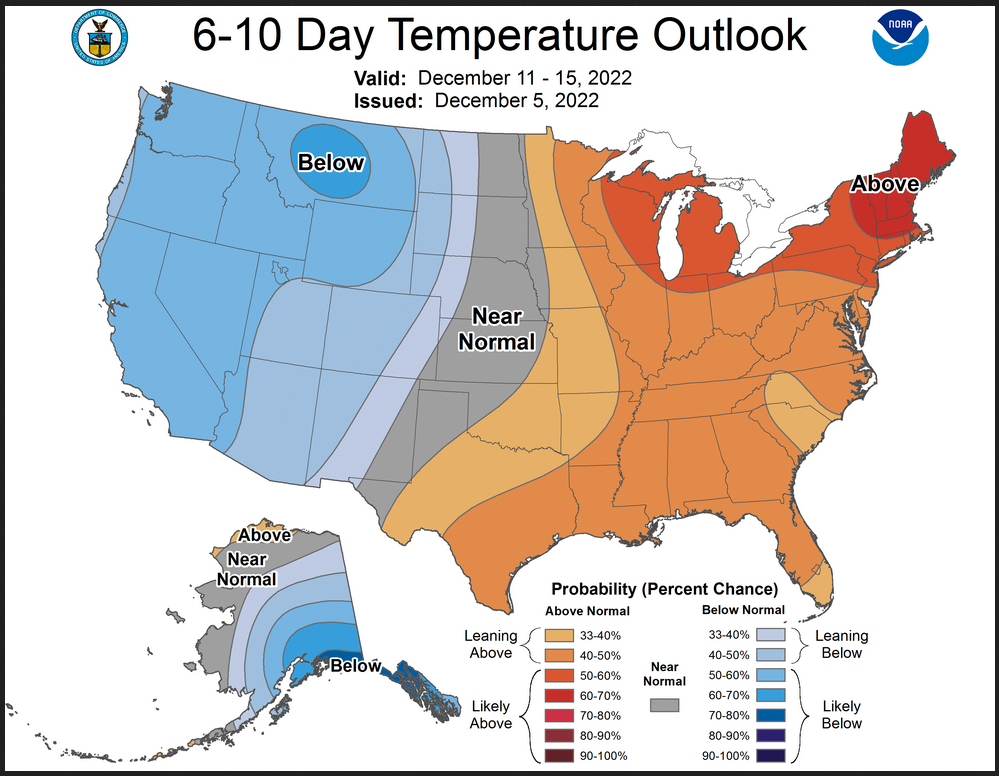
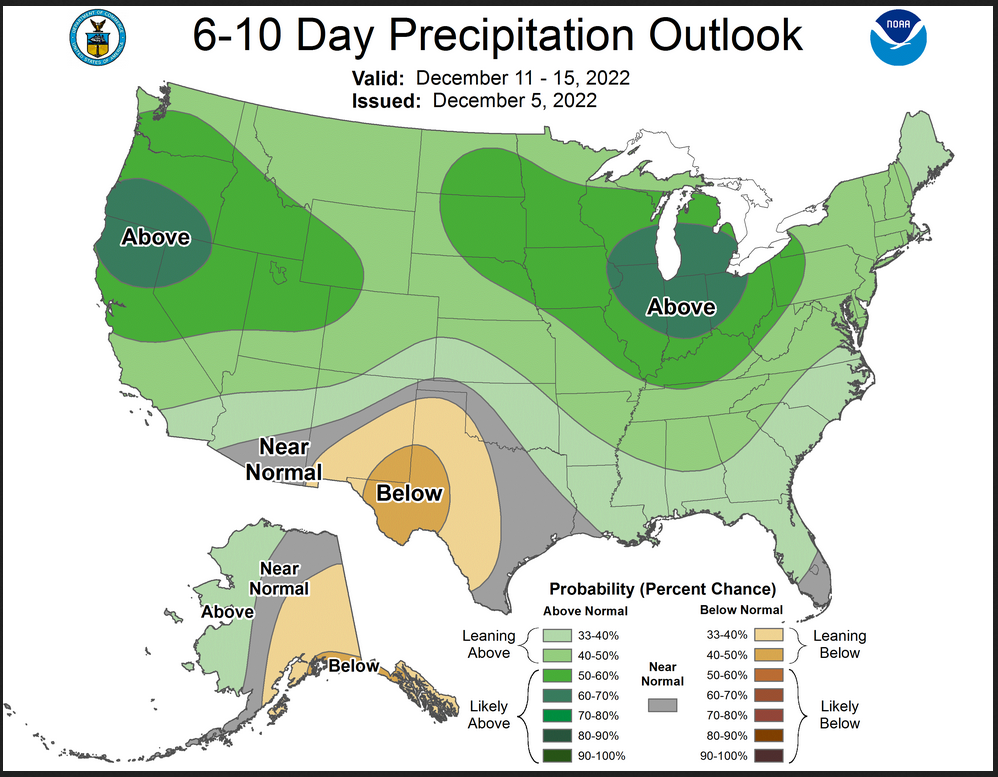
Days 1 Through 5 and 6 – 10-
| Days 1 – 5 | Days 6 – 10 |
| https://www.wpc.ncep.noaa.gov/medr/medr_mean.shtml | https://www.cpc.ncep.noaa.gov/products/predictions/610day/ |
| These graphics update and can be clicked on to enlarge. You can see where the weather will be. An alternate website is https://www.wpc.ncep.noaa.gov/qpf/day1-7.shtml | |
–
Days 6 – 10 Outlook
An outlook differs from a forecast based on how NOAA uses these terms in that an “outlook” presents information from deviation from normal and the likelihood of these deviations.
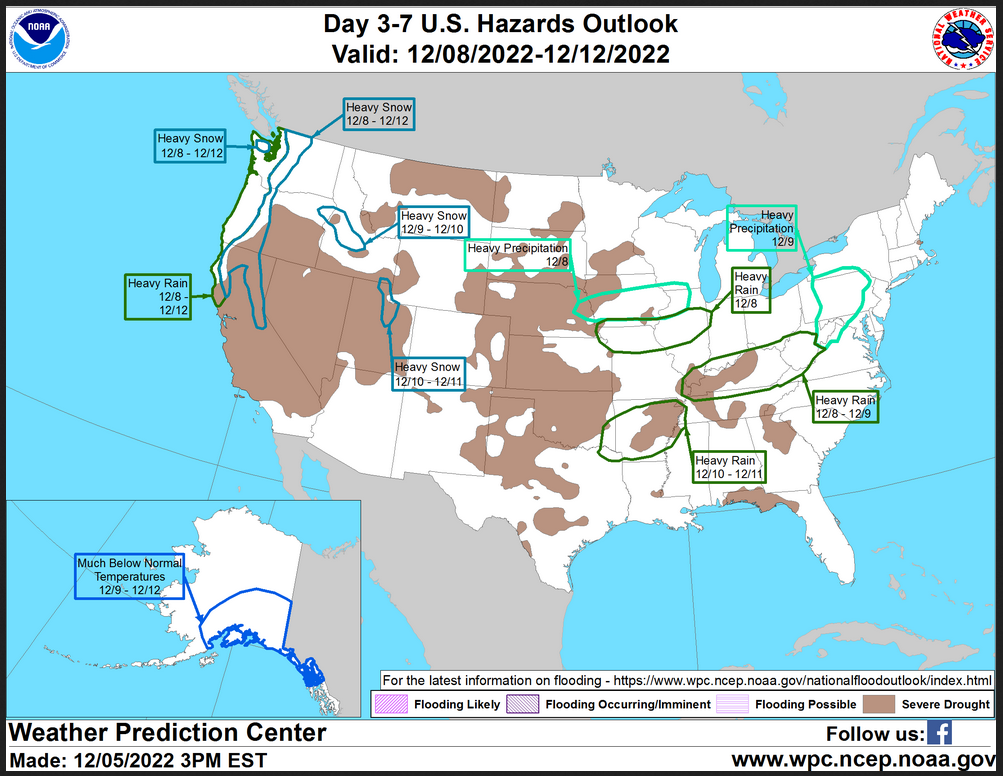
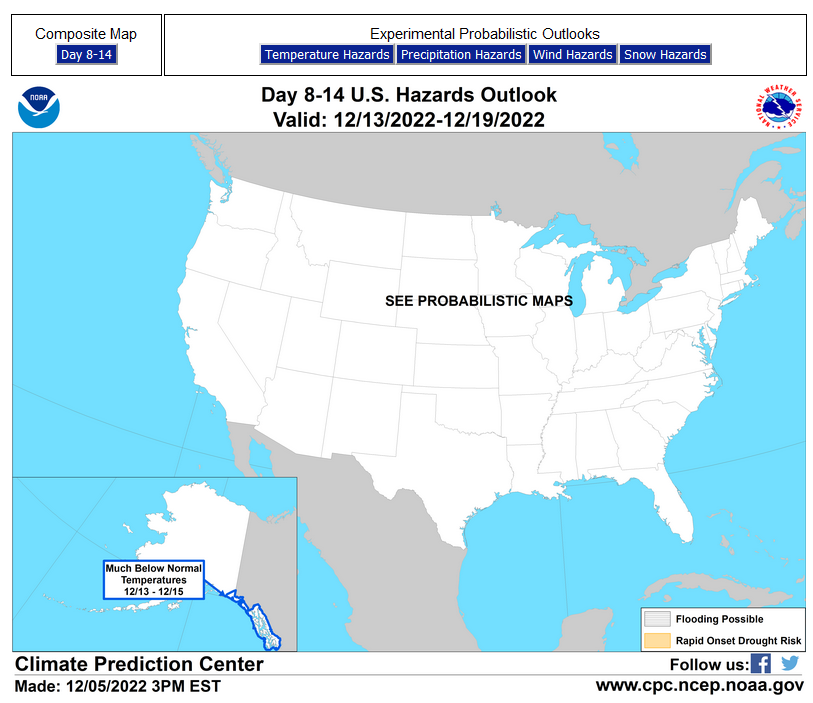
HAZARDS OUTLOOKS
Click here for the latest complete Day 3 -7 Hazards forecast which updates only on weekdays. Once a week probably Monday or Tuesday I will update the images. I provided the link for readers to get daily updates on weekdays. Use your own judgment to decide if you need to update these images.
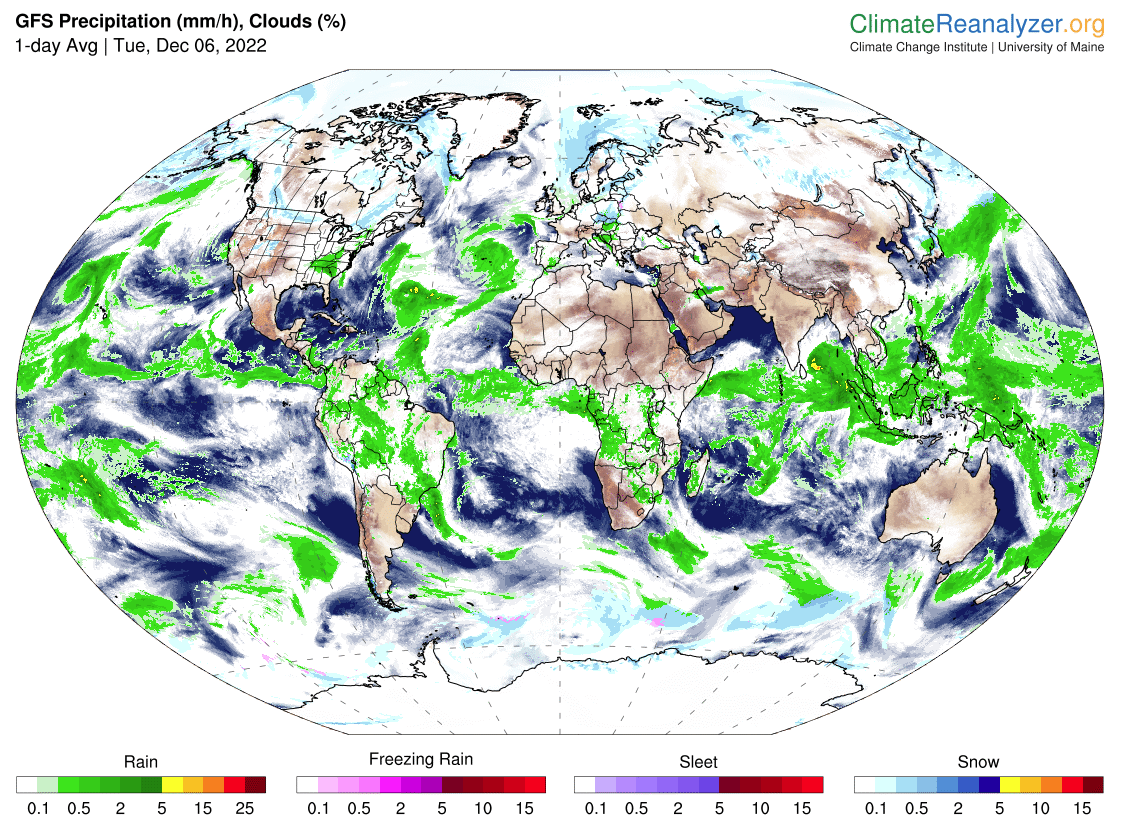
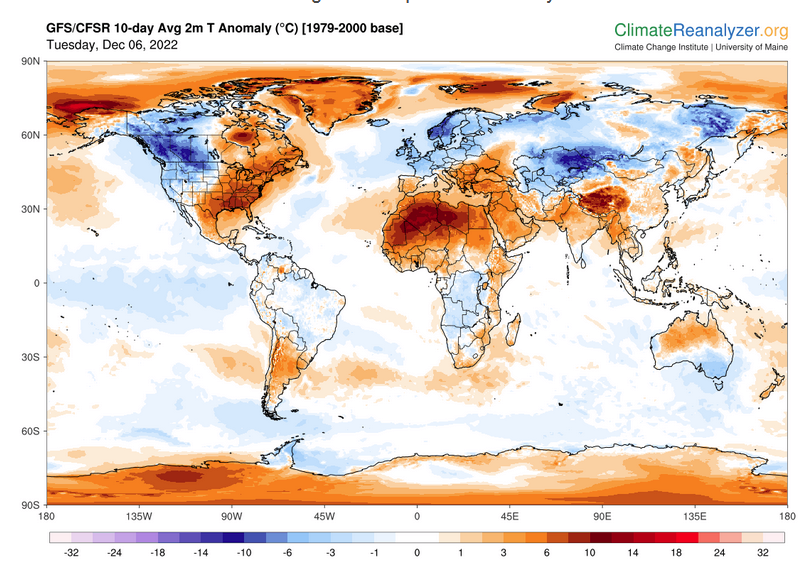
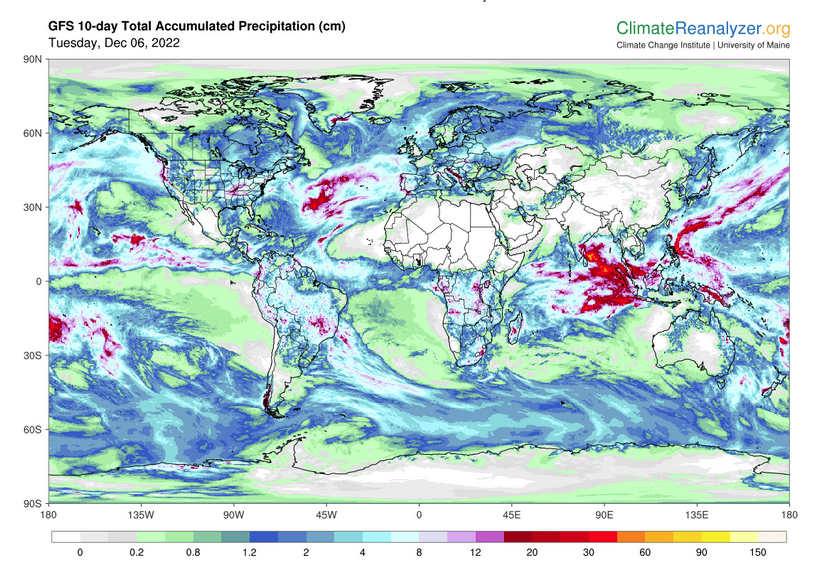
Worldwide Weather (The U.S. is part of the World so the U.S. forecast is included in these maps)
Below maps are the short-term forecast for precipitation and 10-day forecast for temperature and precipitation. I update them daily but if you are looking at an out-of-date version of this article the current forecast maps can be obtained HERE.
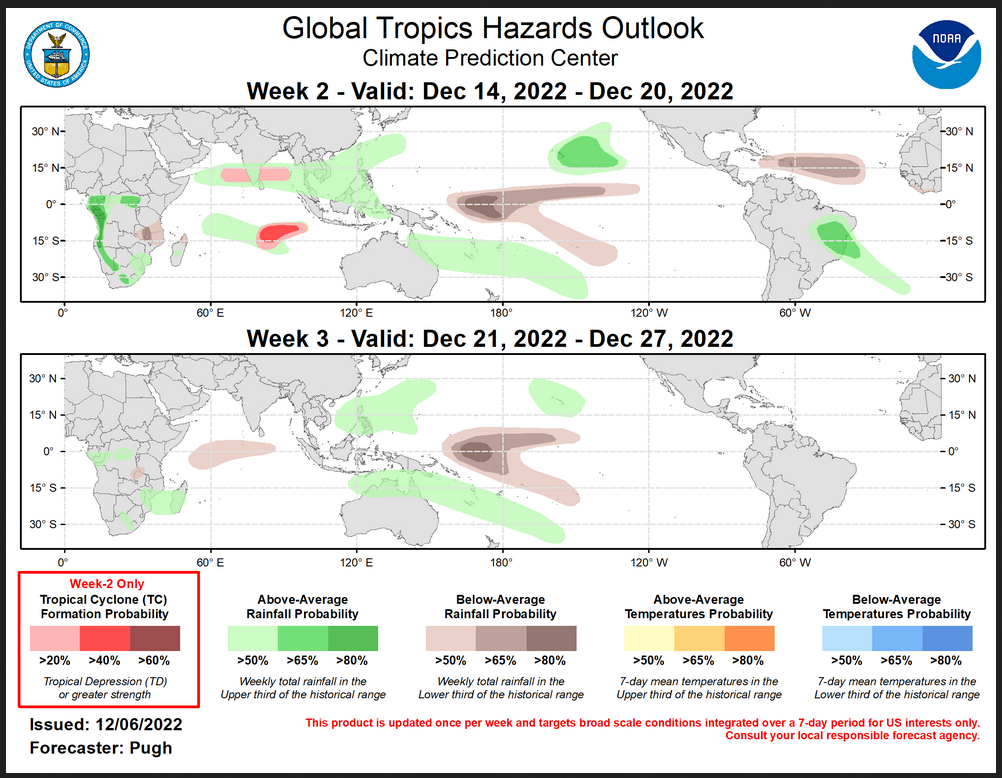
Worldwide Tropical Forecast
(This graphic updates on Tuesdays) If it has not been updated, you can get the update by clicking here This is a new approach and covers weeks 2 and 3 not weeks 1 and 2. It has more information but I am having trouble getting used to it. As usual, it comes with a discussion which is below
Detailed Maps and Reports for the Western Atlantic and the Pacific Oceans
Below are four maps that summarize the situation for the Atlantic, Eastern, Central Pacific, and Western Pacific. Additional information can be accessed by clicking HERE
First the Atlantic
Click to view the forecast map and have access to additional information https://www.nhc .noaa.gov/gtwo.php?basin= atlc&fdays=5
Then Eastern Pacific
Click to view the forecast map and have access to additional information https://www.nhc.noaa.gov/gtwo.php?basin=epac&fdays=5
Then Central Pacific
Click to view the forecast map and have access to additional information https://www.nhc.noaa.gov/gtwo.php?basin=cpac&fdays=5
And the Western Pacific
Click to view the forecast map and have access to additional information https://www.metoc.navy.mil/jtwc/jtwc.html
Some Longer U.S. Intermediate-Term Outlooks
Links to “Outlook” maps and discussions for Two time periods. Days 8 – 14, and Weeks 3 and 4.
You have to click on the links because they do not update automatically and I do not want to have stale images in the article. But it is not difficult to click on a link and you get a large image plus a discussion. On Fridays in a separate article, we will show the images and provide a link in this article that article. But remember what you will see is the images as of Friday. But here you can get the current images simply by clicking on them. Then hit the return arrow at the upper left of your screen to return to the article. You will not find this information easily anywhere else.
| Days 8 – 14 | Weeks 3 and 4 |
| https://www.cpc.ncep.noaa.gov/products/predictions/814day/ | https://www.cpc.ncep.noaa.gov/products/predictions/WK34/ |
| These graphics update and can be clicked on to enlarge. You can see where the weather will be | |
–
Month to Date Information
Month to date Temperature can be found at https://hprcc.unl.edu/products/maps/acis/MonthTDeptUS.png
Month to date Precipitation can be found at https://hprcc.unl.edu/products/maps/acis/MonthPNormUS.png