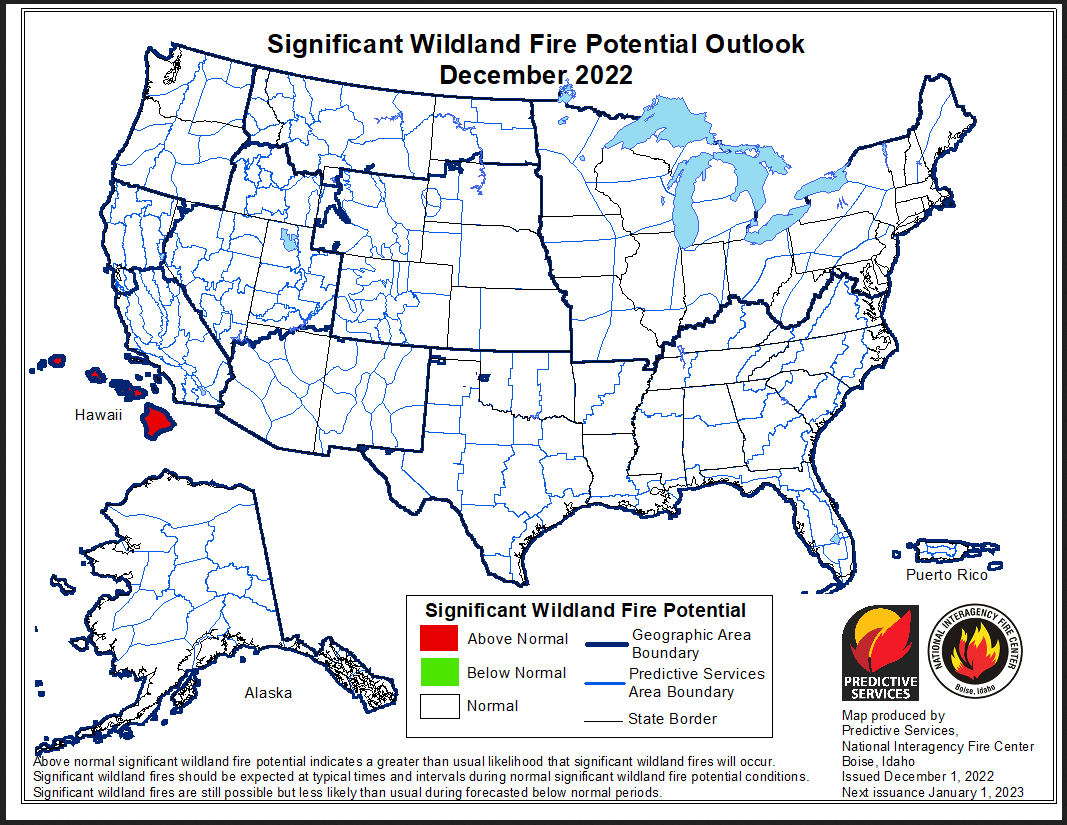
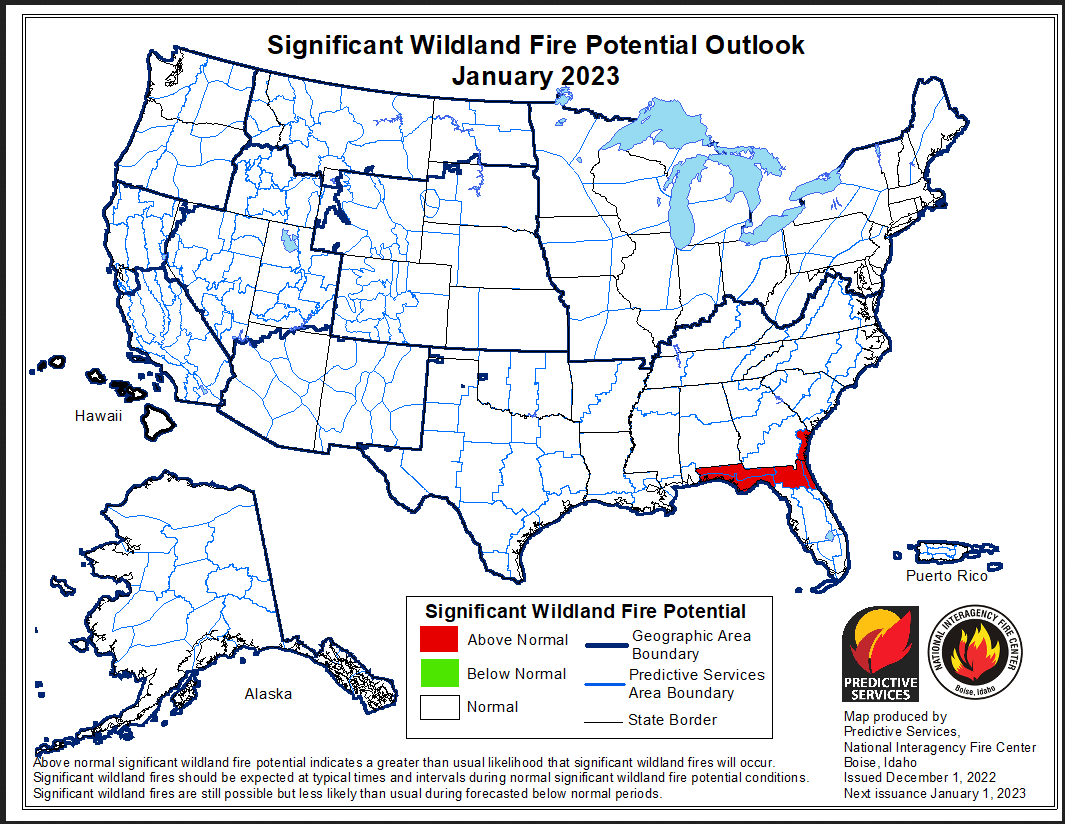
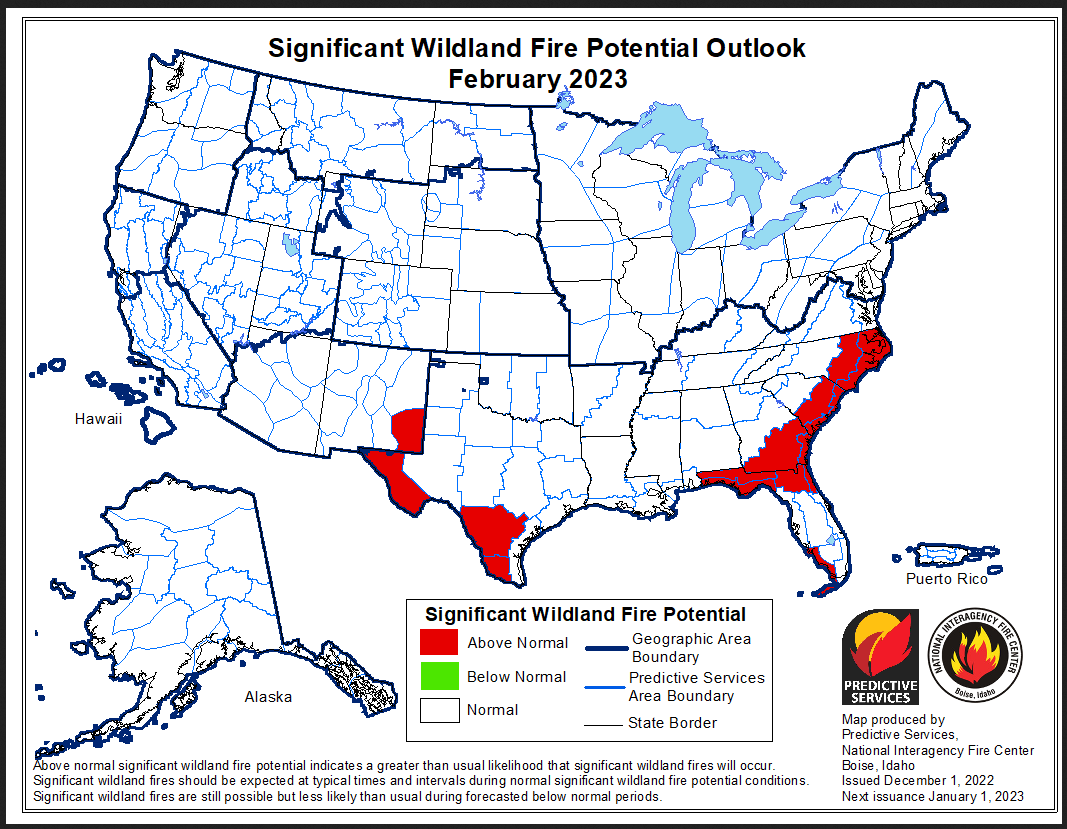
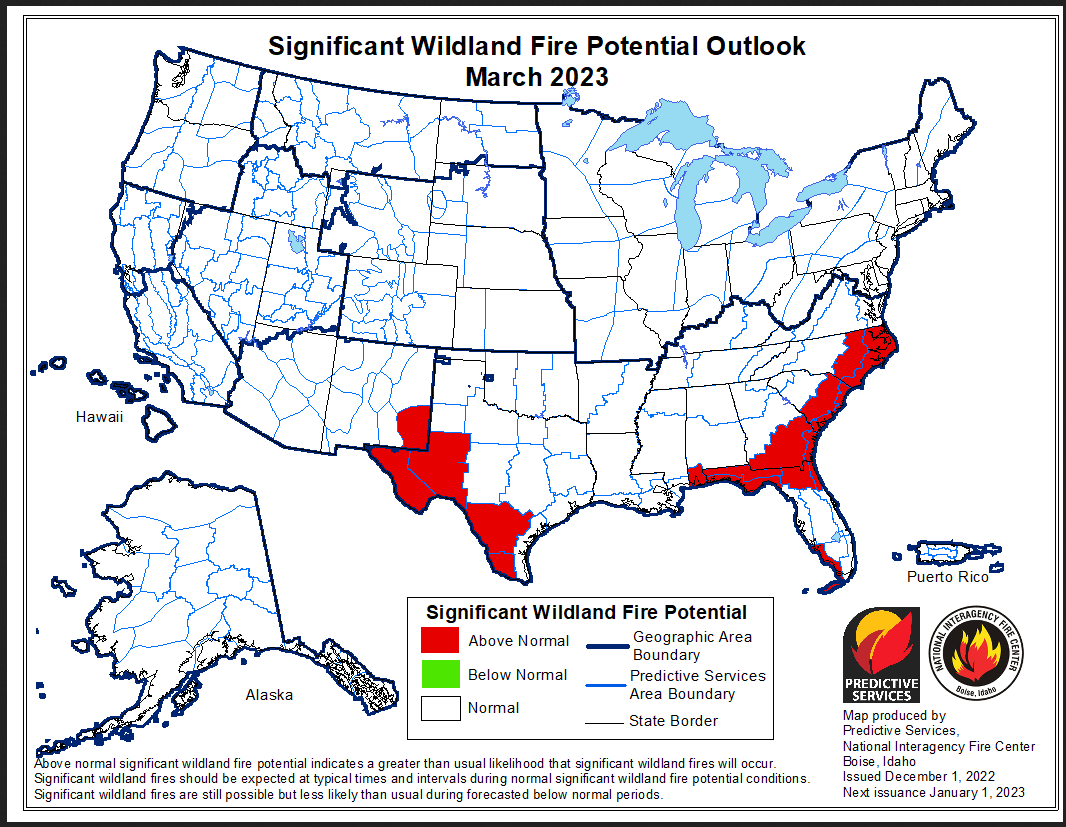
Wildfire Outlooks Updated at 7:50 pm EST December 1, 2022 (It gradually increases through March but is limited to two areas).
At the end of every month, NOAA updates its Outlook for the following month which in this case is December. They also issue a Drought Outlook for the following month. We are reporting on that this morning.
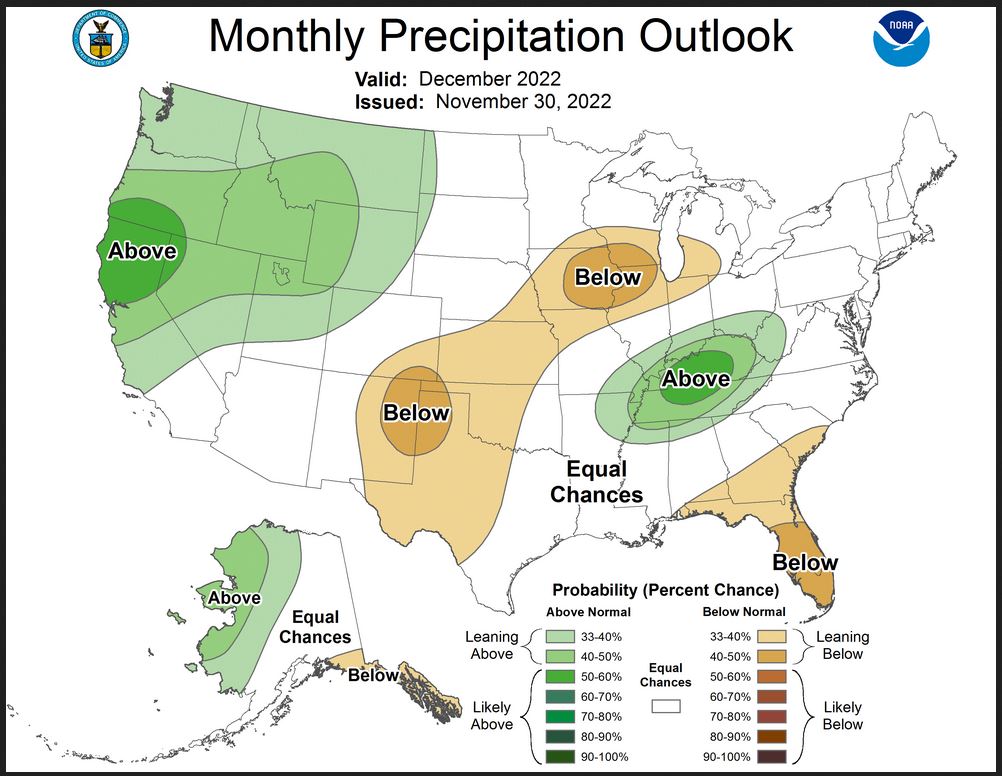
There have been some significant changes in the Outlook for December and these are addressed in the NOAA Discussion so it is well worth reading. We highlighted some of the important changes within the NOAA Discussion. Of particular interest is the increased penetration of modified Artic air into the Lower 48 States (CONUS) and wet Pacific air to provide for a wet Northwest extending farther south along the West Coast. We end up with a wet, dry, wet, dry pattern extending NE to SE with a tendency for there to be wet Ohio and Tennessee Valleys.
The CLIMAS Podcast discusses some of the weather transitions we have seen and what may develop as this La Nina finally transitions to ENSO Neutral.
The article includes the Drought Outlook for December. We have also included the current fire incidents (not many) and four months of Wildland Fire Potential Outlooks and also a map showing the year-to-date precipitation in the West. We also provide the Week 2/3 Tropical Outlook for the World.
Here is the updated Outlook for December
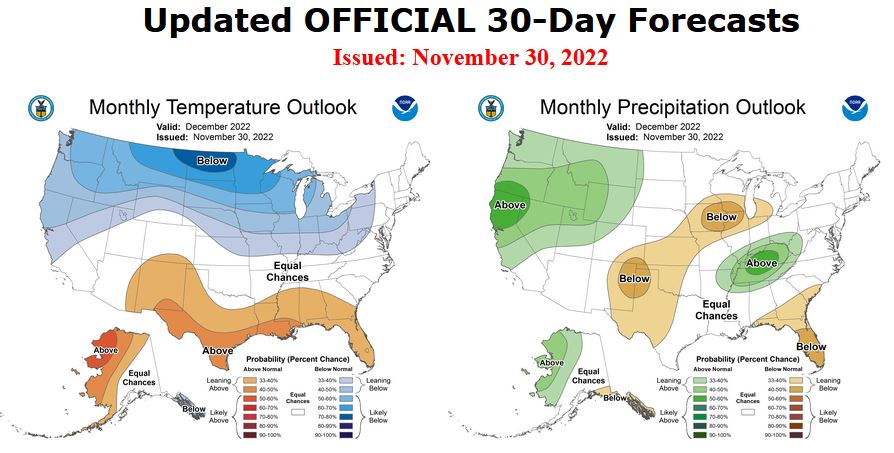
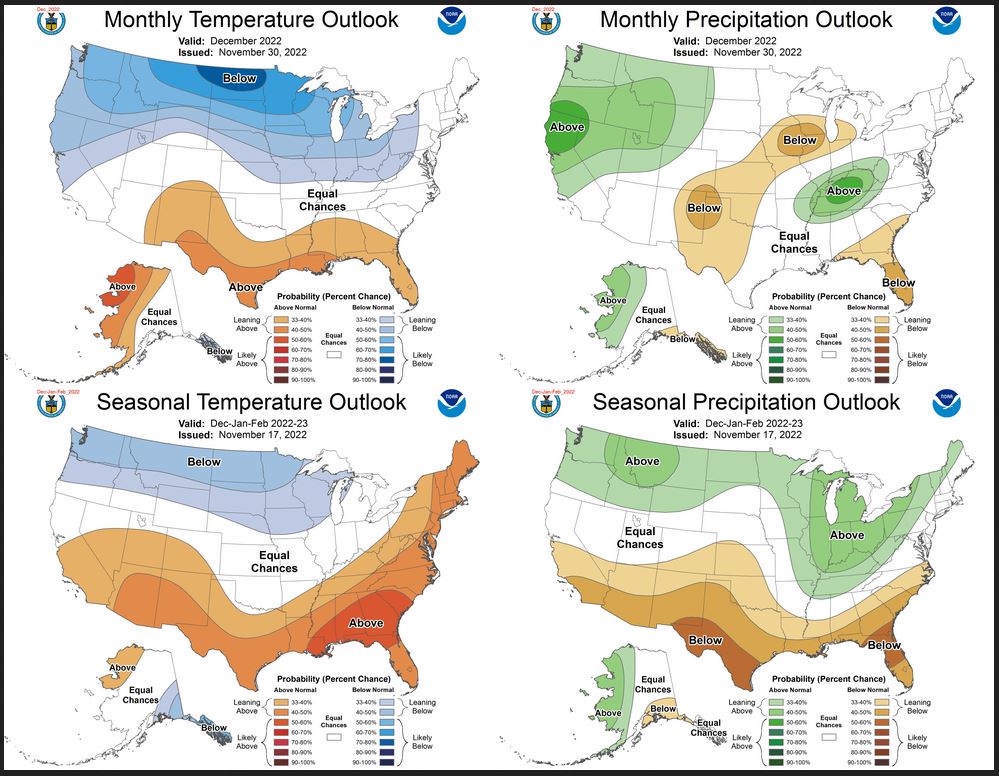
Combination of the Updated Outlook for December and Three-Month Outlook
| The differences are mainly due to increased confidence in the intrusion of cold modified Arctic air, and the pattern of wet, dry, wet, dry from the NE to SE. |
There are some reversals in the new forecast for December relative to the three-month forecast. By a reversal we mean a change from wet to dry or warm to cool. Most of the changes are from Wet/dry/warm/cool to neutral or the reverse. But there are some significant reversals.
| For both temperature and precipitation, if you assume the colors in the maps are assigned correctly, it is a simple algebra equation to solve the month two/three anomaly probability for a given location = (3XThree-Month Probability – Month One Probability)/2*. So you can derive the month two/three outlook this way. You can do that calculation easily for where you live or for the entire map. |
It is important to remember that the December Outlook was updated on November 30 and the three-month Outlook was issued on November 17. So we always wonder if a change in the one-month outlook suggests that the three-month outlook would need to also be adjusted. I think that in this case, the answer is that it might be wise to do that but it will not happen until the third Thursday in December.
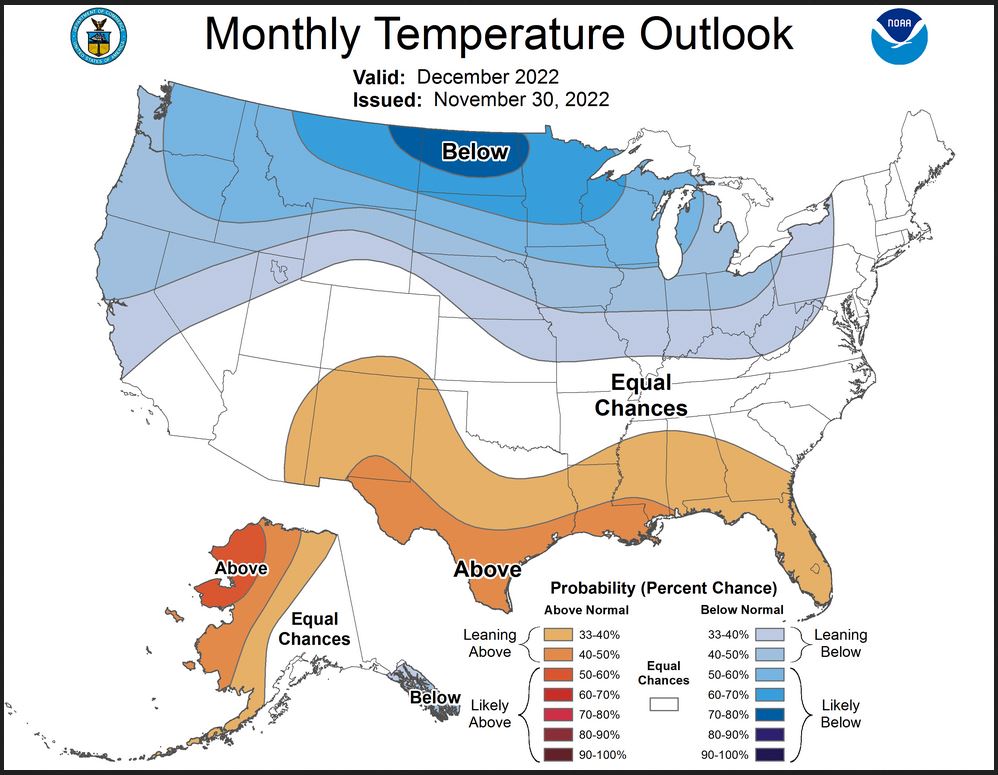
Here are larger versions of the Temperature and Precipitation Outlook maps
NOAA Discussion (I have shown certain important points in bold type)
30-DAY OUTLOOK DISCUSSION FOR DECEMBER 2022
The updated monthly temperature and precipitation outlooks for December 2022 are based on the latest dynamical model guidance, WPC temperature and precipitation forecasts during the first week of the month, the CPC 6-10/8-14 day temperature and precipitation outlooks, and the likelihood of a negative Arctic Oscillation (AO) and North Atlantic Oscillation (NAO) through at least mid-December. The Madden-Julian Oscillation (MJO) strengthened during mid-November with an eastward propagation to the West Pacific. The MJO continues to shift eastward over the Western Hemisphere. The GEFS depicts a reemergence of the MJO across the Indian Ocean later in December, while the ECMWF weakens it. If the GEFS solution verifies, then a transition to a warmer pattern for the northern and eastern contiguous United States (CONUS) may occur late in December. However, large uncertainty exists given the MJO weakening favored by the ECMWF model and strong high latitude blocking likely through at least mid-December.
Arctic high pressure is forecast to shift southward to the western and north-central CONUS at the beginning of December. Ensemble means remain in excellent agreement that high latitude blocking develops over the Northern Hemisphere early in December, consistent with a negative phase of the AO. In addition, a very strong blocking ridge is forecast to shift westward to Greenland and the Davis Strait with a west-based negative NAO. Given the excellent model agreement and consistency on this high latitude blocking and anomalous cold during the first two weeks of the month, below-normal temperatures are favored for the north-central CONUS along with parts of the West. The largest probabilities (50 to 70 percent, or more) extend from the Pacific Northwest east to the northern Great Plains and upper Mississippi Valley where the negative temperature anomalies are greatest early in the month and is also consistent with La Niña composites. Following a mild start to the month across the eastern CONUS, colder temperatures are forecast for these areas by the second week of December. Therefore, equal chances (EC) of below, near, or above-normal temperatures are forecast for this region. Despite some tools leaning warmer, the likelihood of a -NAO through mid-December resulted in EC for parts of the Southeast. Although above-normal temperatures are slightly favored for the southern tier of the CONUS, forecast confidence is low given the strong high latitude blocking and potential for modified Arctic air to shift southward at times during December.
Ensemble means are in good agreement that anomalous 500-hPa ridging persists over the north-central Pacific through at least the first two weeks of the month. Downstream of this longwave ridge axis, a persistent trough of varying amplitude is forecast near or offshore of the West Coast during early to mid-December. This trough is likely to enhance onshore flow and lead to a relatively wet pattern for much of the West through mid-December. The week 3-4 model solutions (valid Dec 14 to 27) favor a continuation of this wet pattern into the latter half of the month. Therefore, increased probabilities for above-normal precipitation are forecast for much of the West. EC is forecast for southern California and the desert Southwest where precipitation signals are weaker. A dry start to December along with good consistency among recent daily CFS model runs supports elevated probabilities for below-normal precipitation from eastern New Mexico and the southern high Plains northeastward to parts of the Midwest. Northwest flow, associated with cold air advection, early in the month is another reason for this dryness across the Midwest. Heavy precipitation (1 to 3 inches, or more) during the first week of the month along with the expectation for a mean surface front and additional precipitation during the remainder of December increases chances for above normal precipitation across the Ohio and Tennessee Valleys. A dry start to the month and recent daily runs of the CFS model favor below normal precipitation across much of the Coastal Plain of the Southeast and Florida. This wet to dry Dipole from the Ohio River southward to the Gulf Coast is typical during La Niña. EC is forecast for the lower Mississippi Valley, Mid-Atlantic, and Northeast due to weaker precipitation signals at various time scales throughout December.
Model guidance remains steady as anomalous 500-hPa ridging is likely to persist over the north-central Pacific and Aleutians. Above-normal temperatures are favored for the Aleutians along with western and northern Mainland Alaska. Below-normal temperatures are most likely for the Alaska Panhandle, based on colder-than-normal temperatures during early to mid-December and also consistent with recent daily CFS model runs. Along with the favored below-normal temperatures, elevated probabilities for below-normal precipitation are forecast for the Panhandle. Predicted southwest flow and excellent agreement among precipitation tools support increased probabilities for above-normal precipitation across much of western and northern Mainland Alaska.
Information on some key indices mentioned in the CPC Discussion
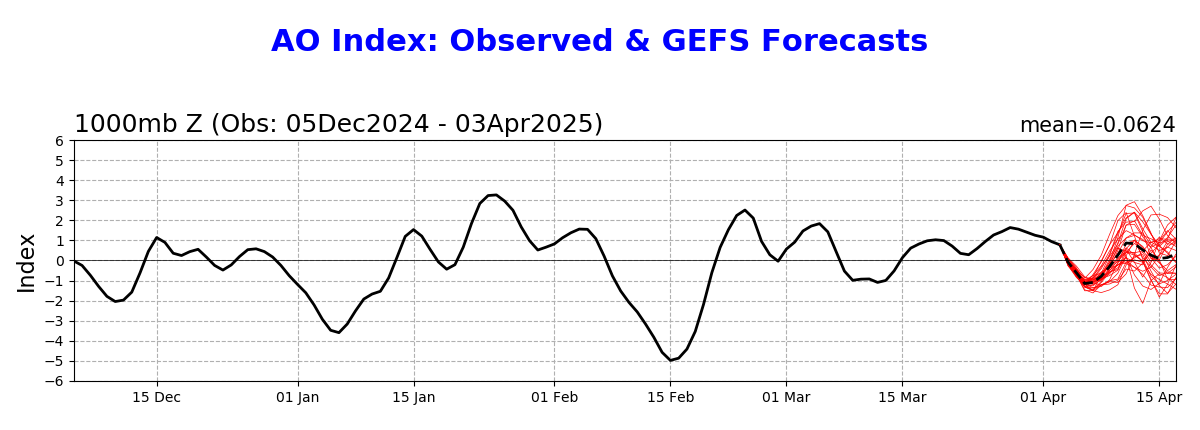
| A negative AO means the high pressure needed to contain cold Arctic air is farther south than usual. |
–
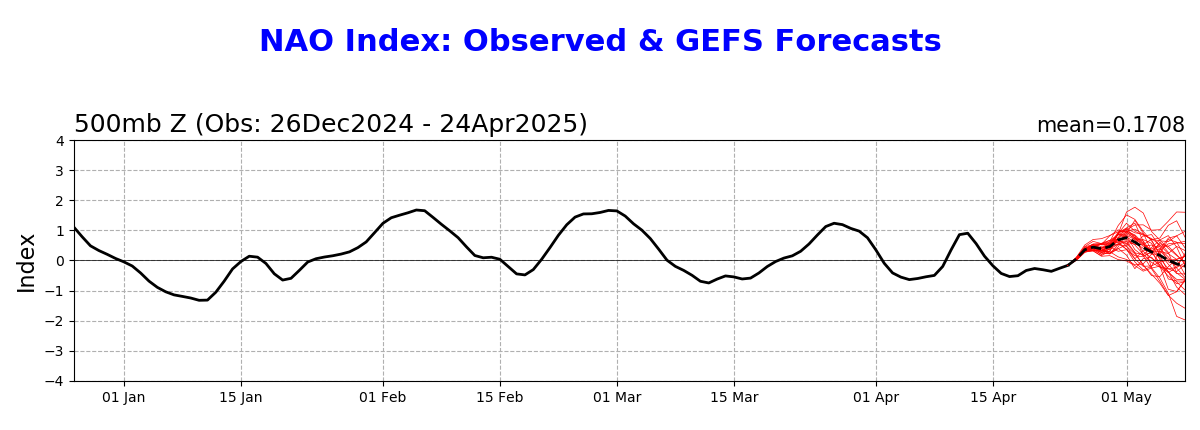
| The NAO is more complex but has a similar impact to the east of where the AO has its impact. This LINK may be of interest. |
–
Drought Outlook
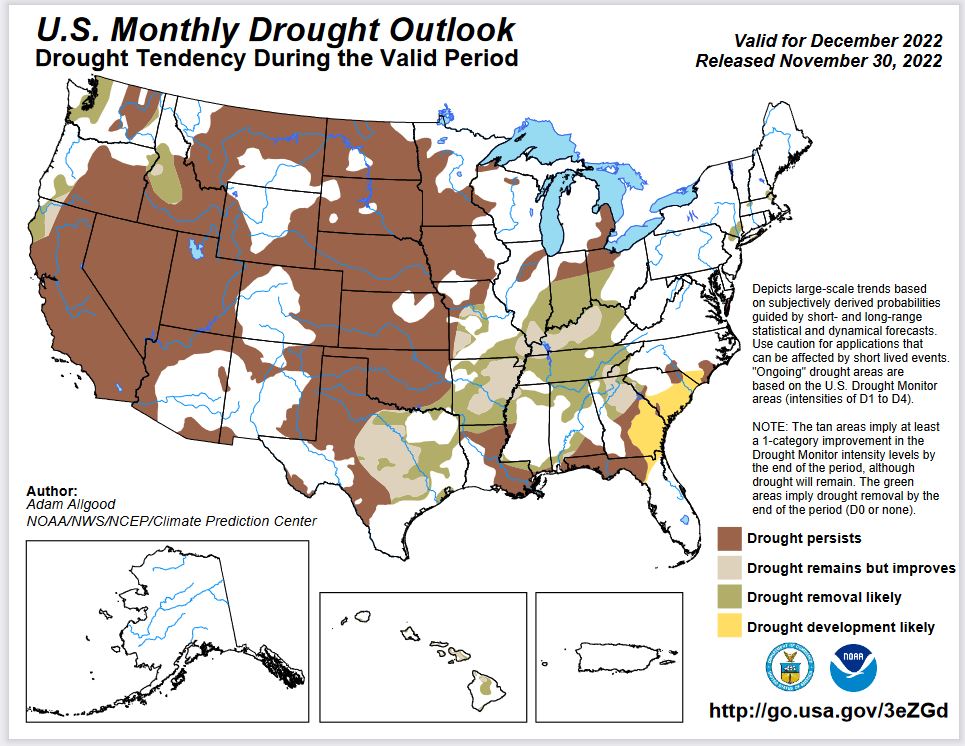
Here is the newly issued Drought Outlook for November 2022
–
| You can see where drought development is likely. It has shifted to the South Atlantic Coastal Plain for December. There is a large area of improvement shown. The summary and detailed discussions that accompany this graphic can be accessed HERE |
Here is the short version of the drought summary
Latest Monthly Assessment – After coverage of drought and abnormal dryness peaked above 85 percent across the contiguous United States at the beginning of November, the largest coverage since the inception of the US Drought Monitor, increased early season moisture across the west and a series of frontal systems across the Plains and Mississippi Valley helped alleviate drought conditions. Drought and abnormal dryness remain widespread across the CONUS, however, with coverage still exceeding 80 percent as of November 22, 2022. Over the past week, several rounds of storminess brought substantial rainfall to portions of Texas, the lower Mississippi Valley, and the Deep South. Further drought reductions are likely in these areas as the moisture works its way into the soil and streams and eases impacts. Over the next week, a new storm system is forecast to bring widespread heavy precipitation to the Tennessee and Ohio Valleys and the Northeast, which should bring additional drought relief and moisture recharge. The updated temperature and precipitation outlooks for December favor wet weather across much of the West, though drought relief is likely to be largely limited to coastal areas of northern California and the Pacific Northwest, with localized relief also possible across higher elevations of the northern Intermountain West. In contrast, drought development is favored for portions of the South Atlantic coastal Plain that missed out on recent rainfall. Elsewhere, drought persistence is favored across much of the Plains and Great Lakes region, where increased chances for below-normal temperatures favor freezing soils and streams.
No drought or abnormal dryness is currently in place or favored to develop during December across Alaska and Puerto Rico. A continuation of an overall wet pattern for Hawaii favors continued drought reductions.
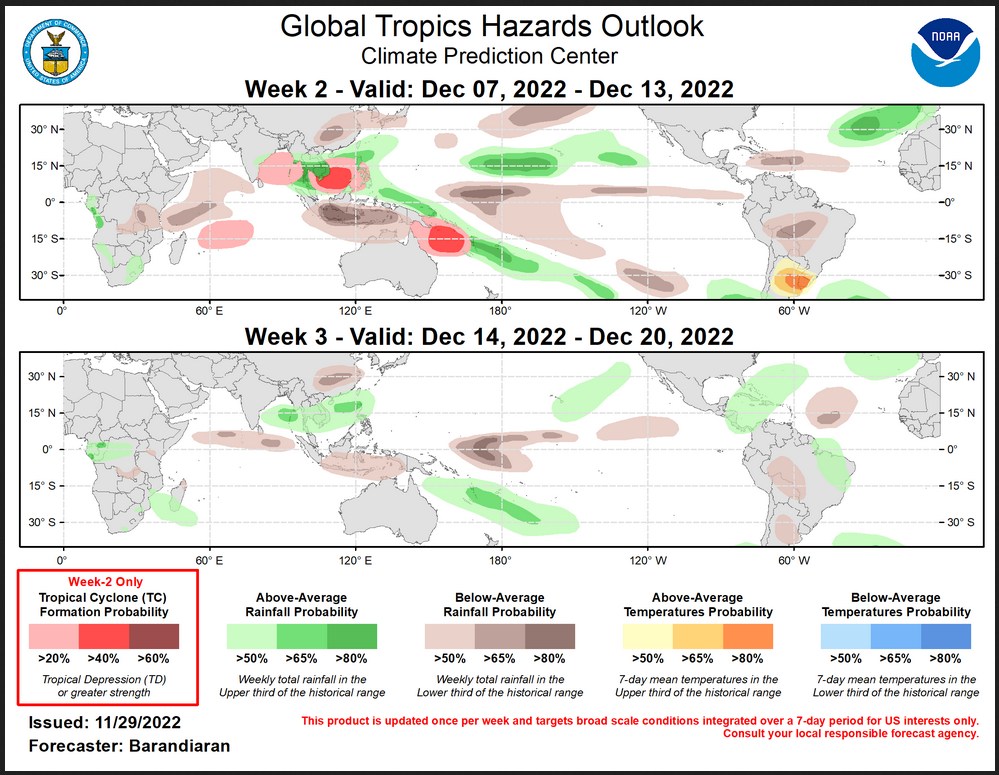
Worldwide Tropical Forecast
–
| To update this forecast (which updates on Tuesdays) click HERE |
Tracking Temperature and Precipitation as the month proceeds
Looking back at November this is what we have observed with respect to Temperature
.
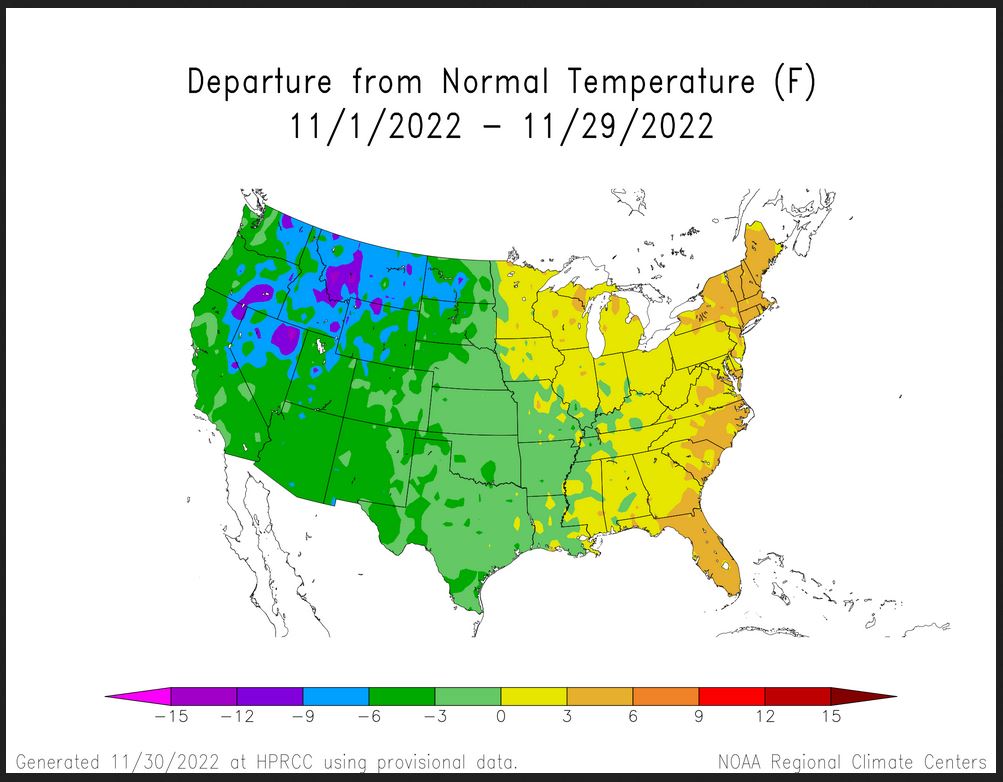
Month-to-date Temperature as the current month evolves can be found at https://hprcc.unl.edu/products/maps/acis/MonthTD eptUS.png
Looking back at November this is what we observed with respect to precipitation.
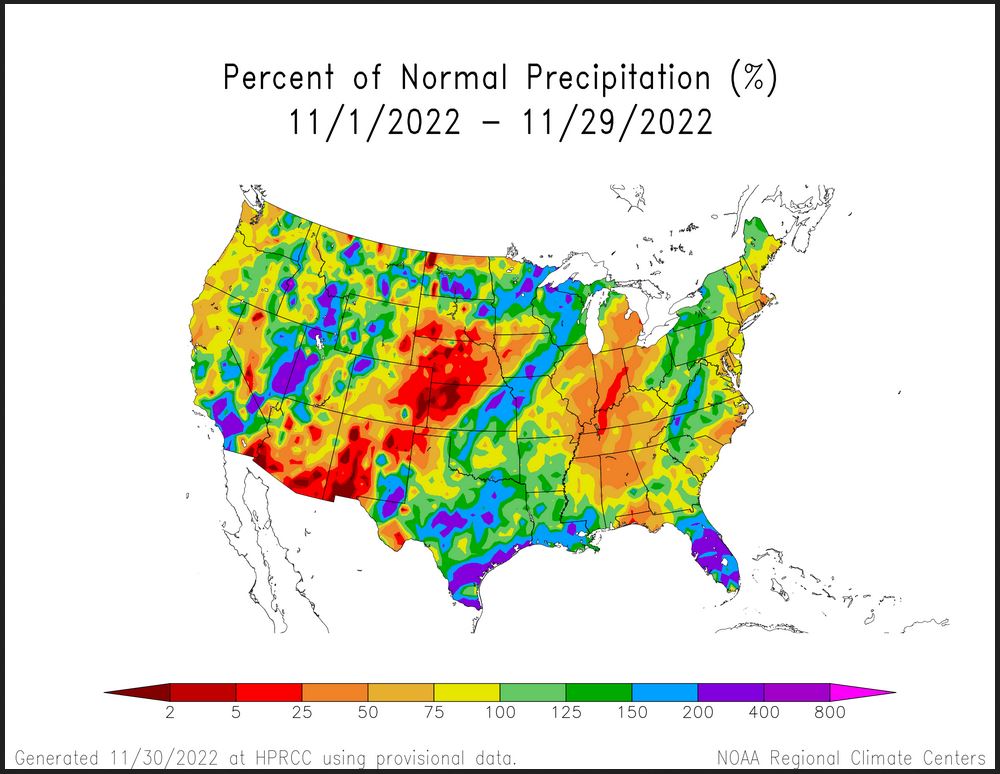
Month-to-date Precipitation as the current month evolves can be found at https://hprcc.unl.edu/pro ducts/maps/acis/MonthPNormUS.png
CLIMAS Podcast
Nov 2022 SW Climate Podcast – Checking in on the Extended Transition Season
In the November episode of the Southwest Climate Podcast, Mike Crimmins and Zack Guido check in with some extended weather/transition events over the last few months, and how this relates to monsoon-like vs. fall and winter events. They work through a set of possible scenarios for winter, and what we might expect with the current (triple dip!) La Nina event already underway, but with a likely transition to ENSO-neutral by early 2023. They bring back the ‘hazard report’ to talk through the kinds of weather events and hazards we might see over winter, and wrap with a discussion of the winter forecasts and what we’ll be watching over winter to track how the season progresses. They also chat briefly about Ben McMahan (that’s me!) changing jobs and having left UA in October (I’ll keep helping with the podcast for who knows how long, but it’s too much fun each month to let go easily, so we’re exploring our options!).
Water-Year to Date SWE and Precipitation
Water year-to-date SWE can be found by clicking HERE I provided a map current as of November 29, 2022
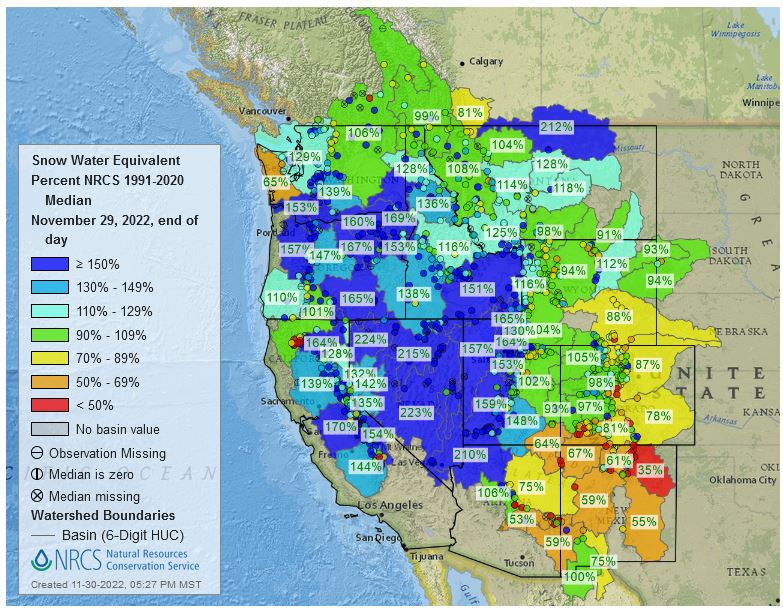
At this time of the year it is probably better to look at precipitation since most of the precipitation has been in the form of rain not snow.
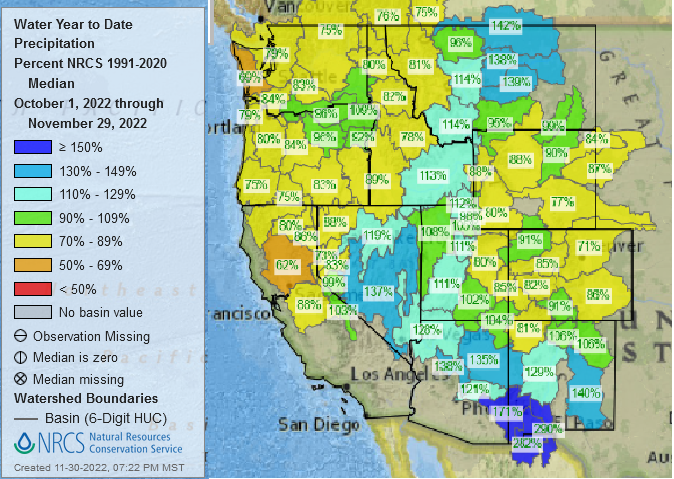
This graphic can be updated HERE It is the same link. You just make a different selection when you get there.
–
| It is just two months in the water year but pretty interesting and shows the change in pattern at least temporarily. The color coding is the same for both graphics so it makes a difference if you are looking for total precipitation from October 1 or current snowpack (SWE). It has been colder than usual in some places so they have a lot of snow. |
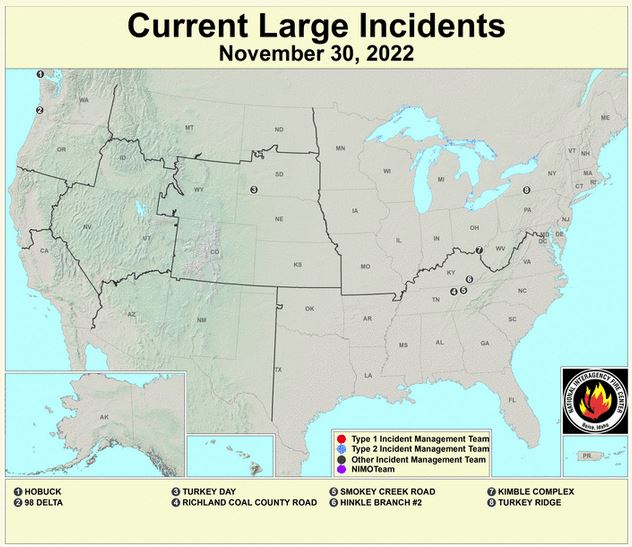
Fire Outlook: Current and Forecast
Updates to the major fire situation can be found by clicking here https://fsapps.nwcggov/afm/index.php
Now looking at the wildland fire potential Outlooks.
By December 1, I will have updated the above maps. If you read this article a month from now, you can update these graphics by clicking here https://www.n ifc.gov
| I hope you found this article interesting and useful |