I realize that soon we will be looking back at November but it makes sense to look back at October. We should have done it a couple of weeks ago when we looked at October from a global perspective.
State ranking is interesting because it is not based on how the climate of the US is changing but on how the climate of each state compares to other states. But it does this by looking at how the climate of a state for a given period of time compares to the state’s 128-year recent history. There are many ways to present data and I like this approach a lot.
In this article, we look at the month of October 2022 and the year-to-date data for 2022 through October.

–
| First, we will look at the month of October and then the year-to-date through October results. |
–
–
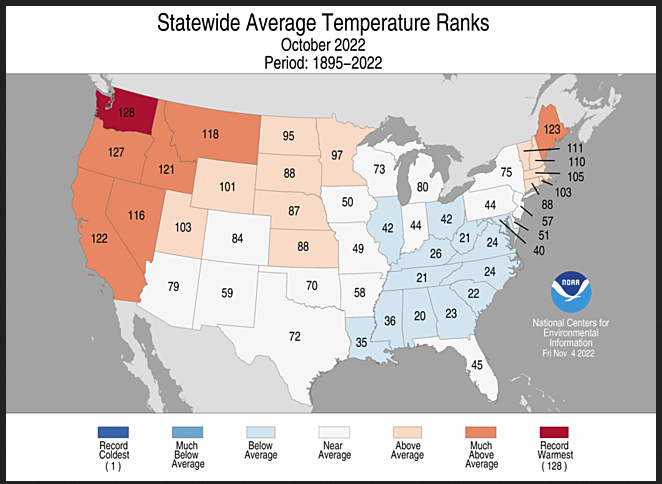
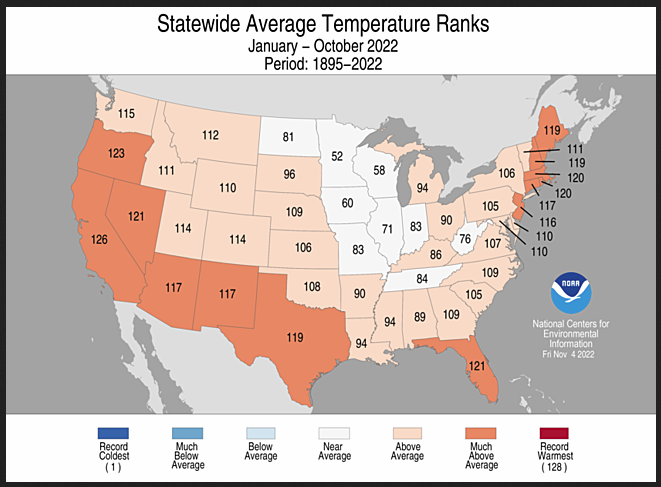
| One month had record warm. Six more were much above average. The ranking of each state is shown relative to its recent history. The most recent 128 years of data are considered the most reliable data. |
–
–
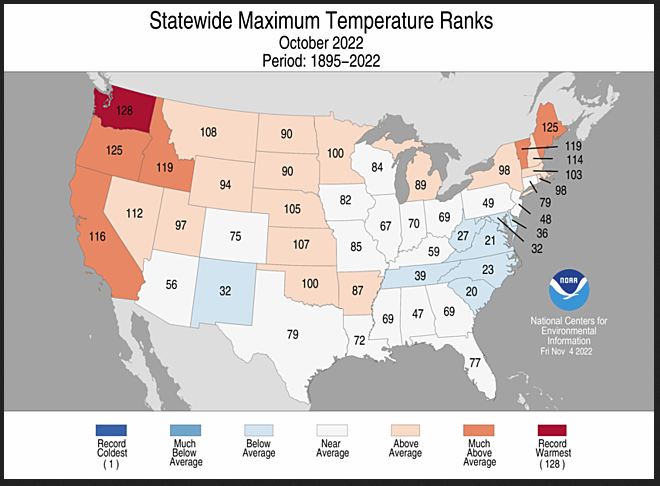
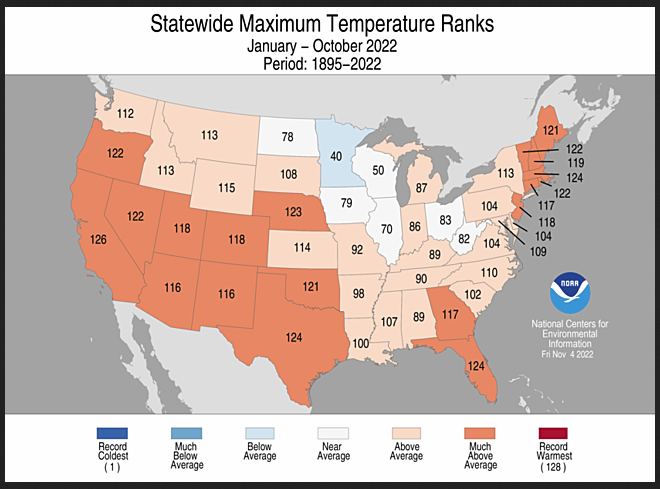
| Here we look at the maximum temperature not the average temperature. It is a little different than for the average temperature. But again one state set a record. |
–
–
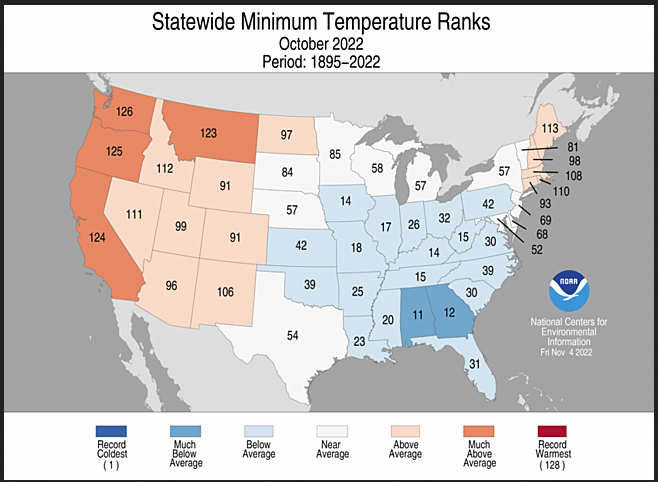
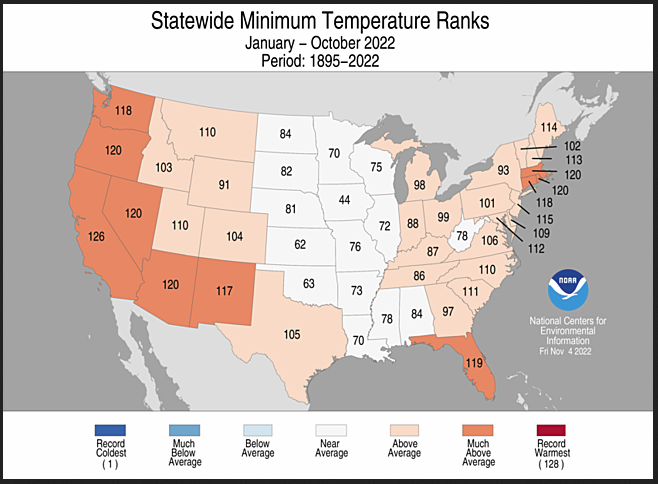
| Minimum temperatures are very important. No state set a record for high minimum temperatures. That is characteristic of Global Warming. It tends to raise the highs more than it raises the lows. Two states were fairly cold relative to their history. That is why we look at average, high and low temperatures. |
–
–
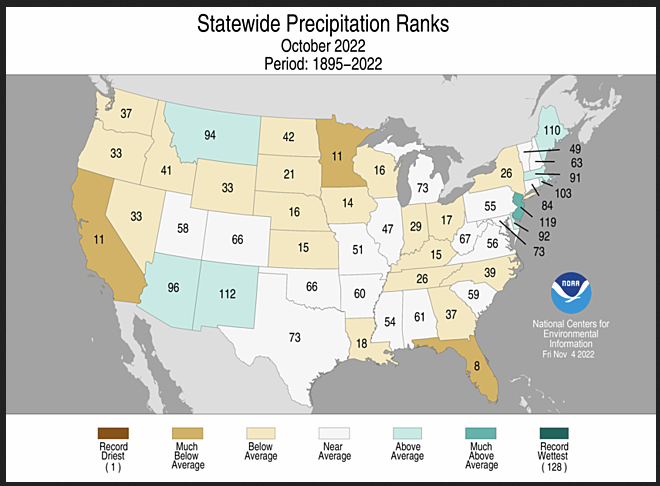
| Strange: three much below-average states in three different parts of CONUS (the part of the U.S. that is connected thus excluding Alaska and Hawaii). |
–
–
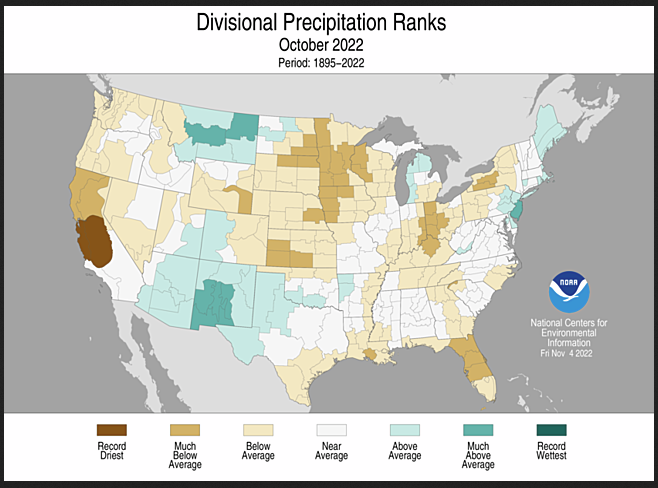
| Sometimes looking at climate divisions within states is helpful. There are maps that do the ranking by climate divisions for temperature, maximum temperature and minimum temperature but I try to keep the number of graphics to a minimum and it is useful the most for precipitation. |
–
Now we take a look at the year-to-date information. So it is the same procedure but looking at a different time period.
–
| I used to organize this information in tables but it is difficult to do with this version of WordPress. It would be nice to show the current month and the YTD side by side. I can do that but the maps are too small. But you can scroll up to the single month rankings to do the comparison. |
–
–
| With Maximum temperature, there are more states that were much above average. |
–
–
| Less so for minimum temperature. There are fewer states in the Much Above Average category. |
–
–
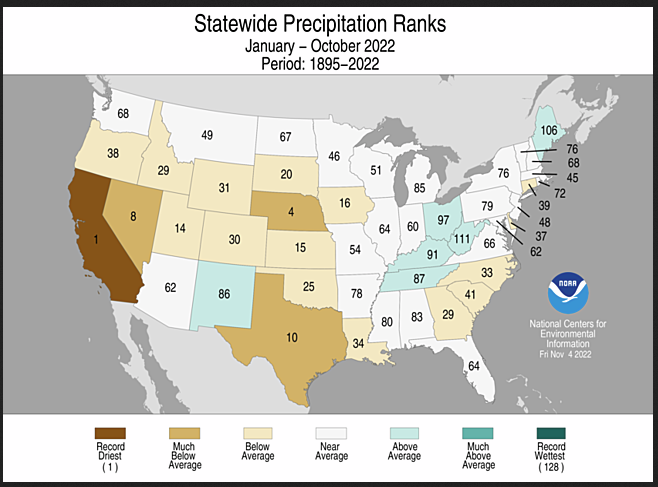
| California set a record. Three other states were much below average. The large number of states below average was what prolonged the drought. |
–
–
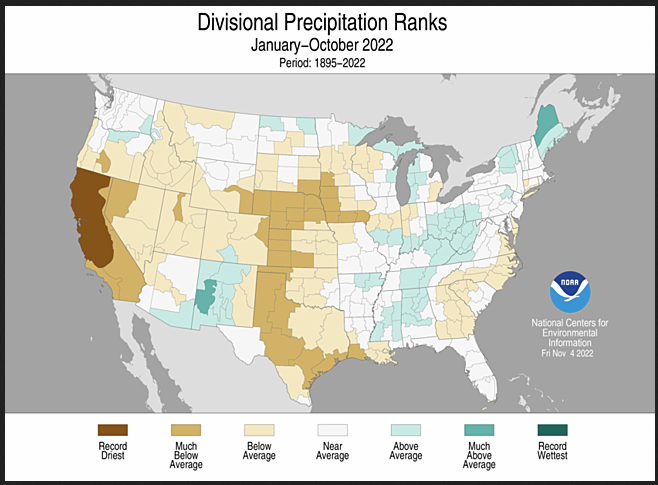
| Sometimes looking at climate divisions within states is helpful. You can really understand the situation in California and New Mexico better this way and the situation in the Great Plains. |
–
–
| I hope you found this article interesting and useful. |
–