Updated at 9:30 p.m. EST November 28, 2027. Our Monday – Tuesday 48-Hour forecast will be published soon. And there will be an updated Outlook for the Month of December issued by NOAA CPC Wednesday and we will report on that Wednesday evening/Thursday morning.
Once a week we show many of the actual forecast maps not just provide the links to these maps. This makes it easier for the reader. Our report provides a separate forecast for Days 1 and 2, Days 1-5, Days 6 -10, Days 8 – 14, and weeks 3 and 4. We also include a next-day and 10-Day World Temperature and Precipitation Forecast. This provides information that is useful to readers in terms of planning their activities for the weekend and the next 28 days. Saturday through Monday I will update the article with more recent short-term forecasts.
Because like last week there is a major change in the forecast shown mid-month (and last week the 6 to 14 Day part of the outlook was dramatically changed on the Monday following Friday), I have included excerpts from the discussions at the beginning of the article as you will see. This will allow us to track how that part of the Outlook might change over the weekend.
The comments within the article discuss what we observed.
When we publish on Friday night, it provides a 28-day view of the future. What is important is that this is a longer-term view than one that is typically available in the media and online.

–
This weekend you can again also look at the recent NOAA Mid-Month Outlook for December and overlapping three-month forecasts through the end of next year. We reported on this HERE We will have the end-of-month update soon. You can also look at a recent article on the World Climate for last Month namely October. That report can be accessed HERE. |
We moved some of the analysis to the end of the article so that readers can get the forecasts more easily so we now have our normal sequence of presenting information with the short-term (today, tomorrow and five-day cumulative)- It is up-to-date as of the time of publication. We will be doing selected updates all weekend. Links are generally provided so the reader can update any of the graphics (plus often you will end up with a lot of additional information).
Maps that relate the forecast to geography can be found by clicking Here for Day 1 and Here for Day 2.
Monday
Tuesday
Here is the National Weather Service 48 hour+forecast. Updates can be found here.
I will be doing updates during the weekend. It only updates twice a day.
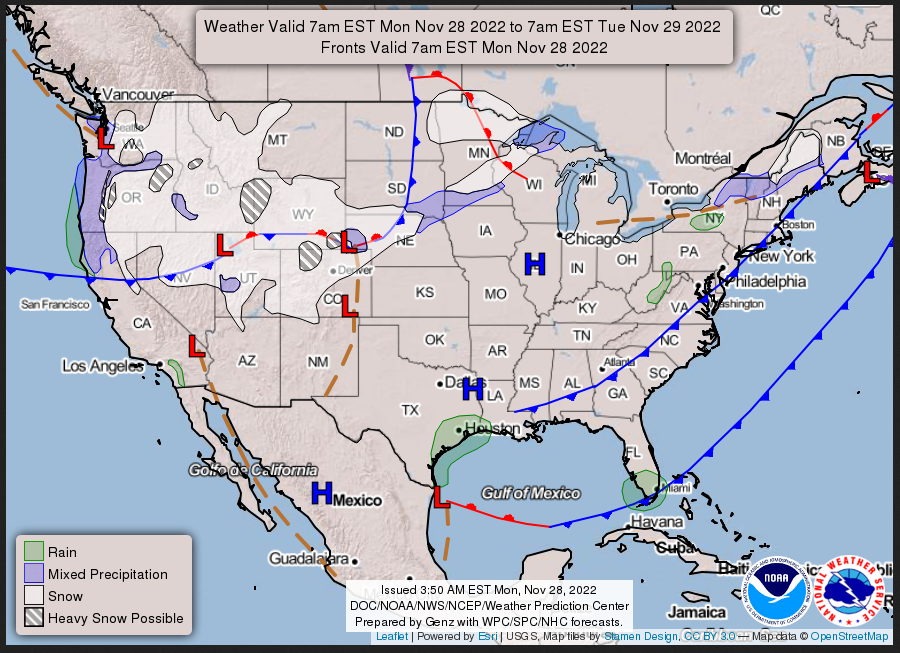
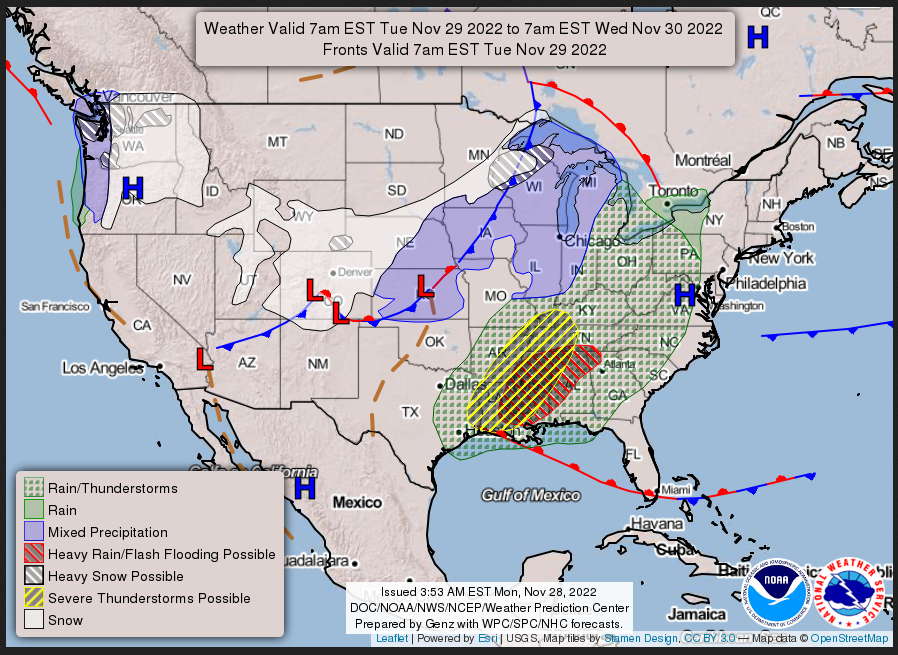
Short Range Forecast Discussion
NWS Weather Prediction Center College Park MD
303 PM EST Mon Nov 28 2022

Valid 00Z Tue Nov 29 2022 - 00Z Thu Dec 01 2022

...Severe thunderstorms expected for portions of the lower Mississippi
Valley along with possible flash flooding on Tuesday...

...Light to moderate snowfall will likely impact the central High Plains
into the upper Mississippi Valley late tonight through Tuesday...

...Strong Pacific storm system to begin impacting Washington and Oregon
Tuesday night with heavy rain and snow along with strong winds...

As an upper level trough begins to shift eastward into the Great Plains
tonight, low pressure at the surface will organize over Kansas, eventually
tracking into the upper Great Lakes region for Tuesday night. Snow will
develop eastward from the central Rockies into Nebraska along with gusty
winds tonight, creating dangerous travel conditions due to reduced
visibility across the region. A swath of light to moderate snow is
expected to translate northeastward into portions of southern Minnesota,
northwestern Wisconsin and the Upper Peninsula of Michigan. Lake effect
snow showers are expected to enhance snowfall totals into the 6-12 inch
range for portions of northwestern Wisconsin into Michigan with colder air
moving in behind the system's cold front, In fact, a significant drop in
temperature is expected behind the cold front for much of the Colorado
Front Range into the central Plains with a 20 to 30 degree drop in maximum
temperatures anticipated between today and Tuesday.

As the strong cold front advances eastward, severe storms and heavy
rainfall are expected for portions of the lower/middle Mississippi Valley
into a portion of the Gulf Coast states. A Moderate Risk of severe
thunderstorms (Storm Prediction Center) and Slight Risk of excessive
rainfall (Weather Prediction Center) is in place on Tuesday for much of
the lower Mississippi Valley. A few strong/long-track tornadoes will be
possible from eastern Arkansas, northeastern Louisiana into the northern
half of Mississippi with this storm system.

By mid-week, a significant Pacific storm system is forecast to reach the
Pacific Northwest. An occluded frontal system will near the coast of the
Northwest Tuesday night, bringing  areas of heavy lower elevation rain and
heavy mountain snow. Through Wednesday night, the heaviest snowfall
accumulations, some in excess of 1-2 feet, will impact the Washington
Olympics and Cascades. Lowering snow levels are also expected to impact
many mountain passes and lower elevation communities with snowfall later
in the week.
This animation shows how things may play out over the next 60 hours. To update click here.
| Temperature (Maximum or Minimum Anomaly) for the next five days | Precipitation (Five days of cumulative precipitation) |
| https://www.wpc.ncep.noaa.gov/medr/me dr_mean.shtml | https://www.wpc.ncep.noaa.gov/qpf/day1-7.shtml |
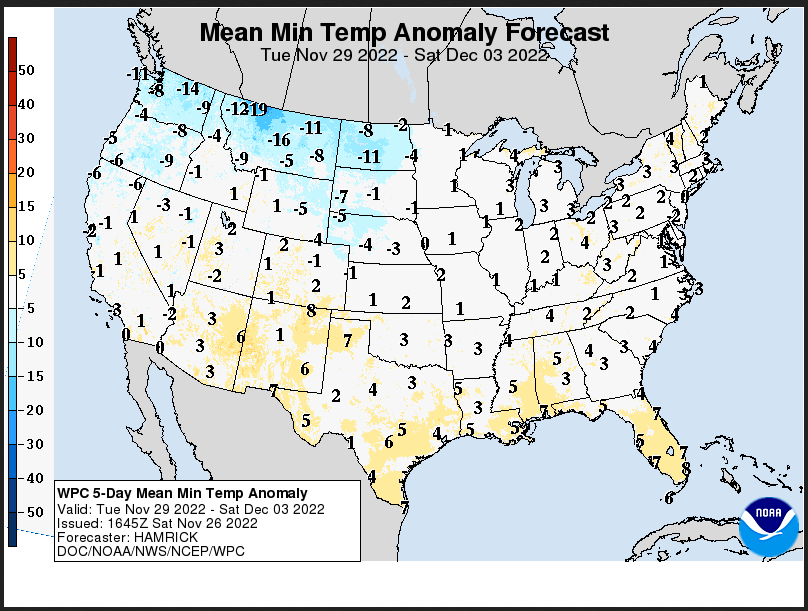
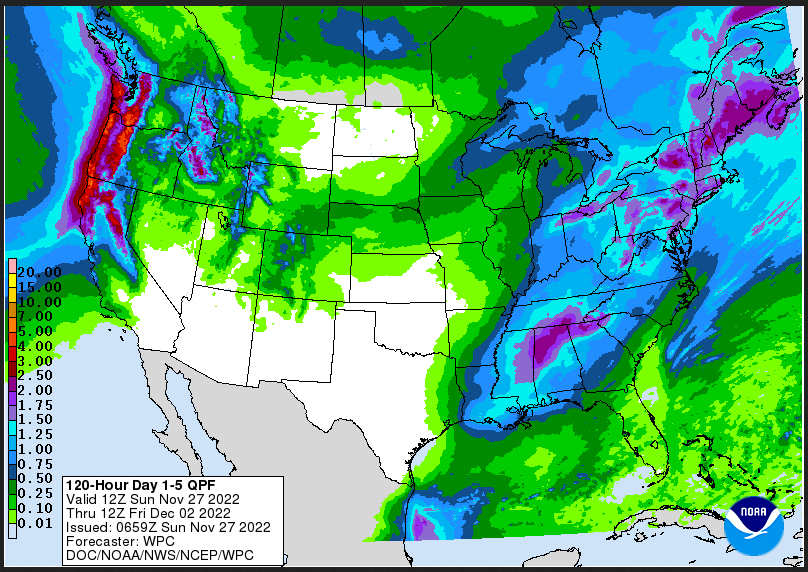
| There was a change in format for the minimum temperature map. I preferred the prior format. But the color coding is useful for quickly seeing where the average low is higher or lower than normal. Precipitation entering the Northwest and again impacting the Gulf Coast but more to the east than in recent days. |
Now we look at Intermediate-Term “Outlook” maps for three time periods. Days 6 – 10, Days 8 – 14, and Weeks 3 and 4. An outlook differs from a forecast based on how NOAA uses these terms in that an “outlook” presents information as deviation from normal and the likelihood of these deviations.
I have provided the maps so you do not need to click to get them. But they do not update daily. But you can get the current images simply by clicking on the links provided. Then hit the return arrow at the upper left of your screen to return to the article. There is no need to do that right away since what is published today is up to date. The Week 3 – 4 Outlook only updates on Fridays.
Below are the links to obtain updates and additional information.
 Then updated a day later
Then updated a day later
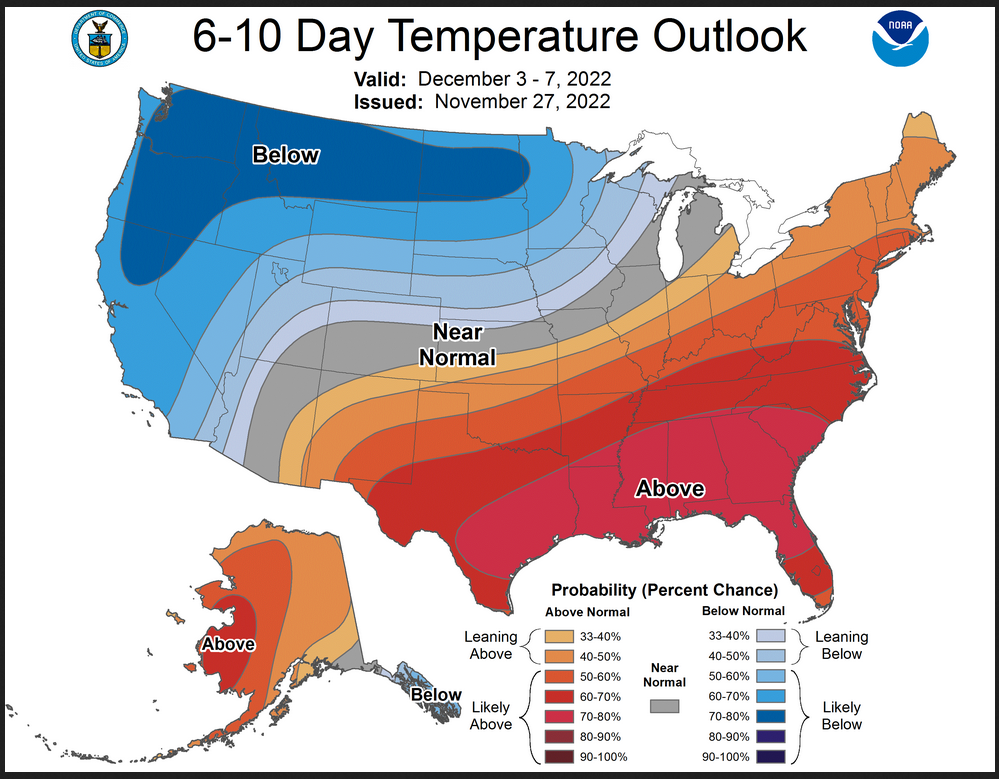
And on Monday November 28
Remember that one day was added and one day was removed each day (total now of two). But it is certainly quite different.
Then updated a day later
And on Monday, November 28, 2022
–
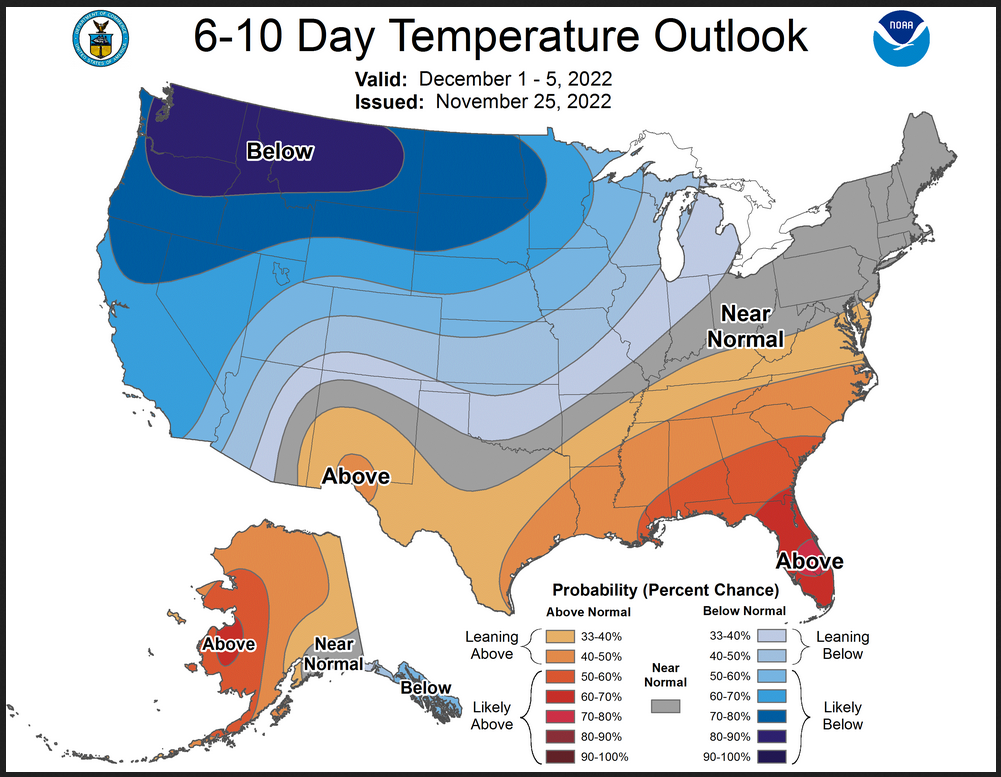
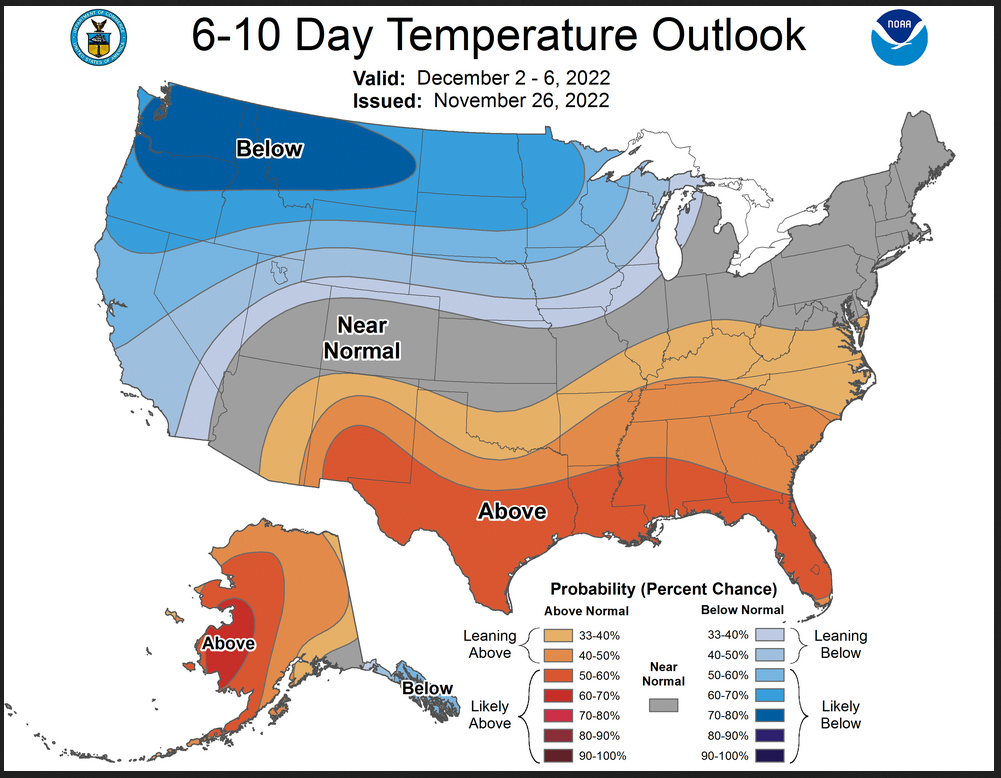
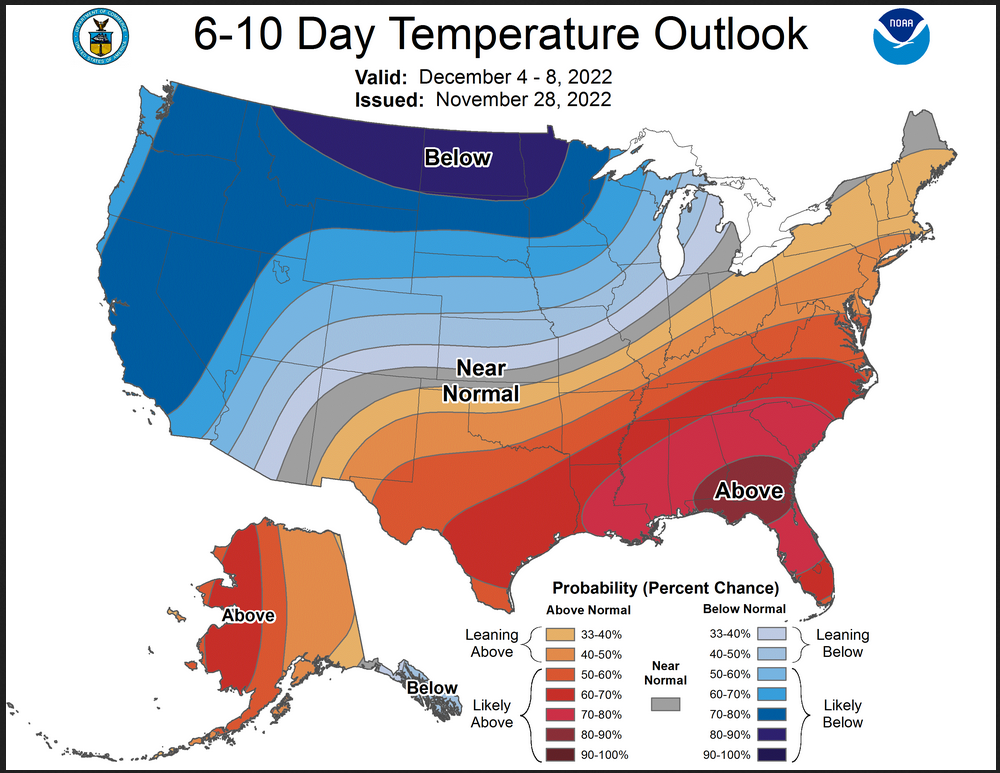
| I have not noticed anything very unusual for the 6 – 10 day Outlooks as the maps changed from Friday to Monday. Each day one day was added and one removed. The day added was previously in the 8 -14 day Outlook. |
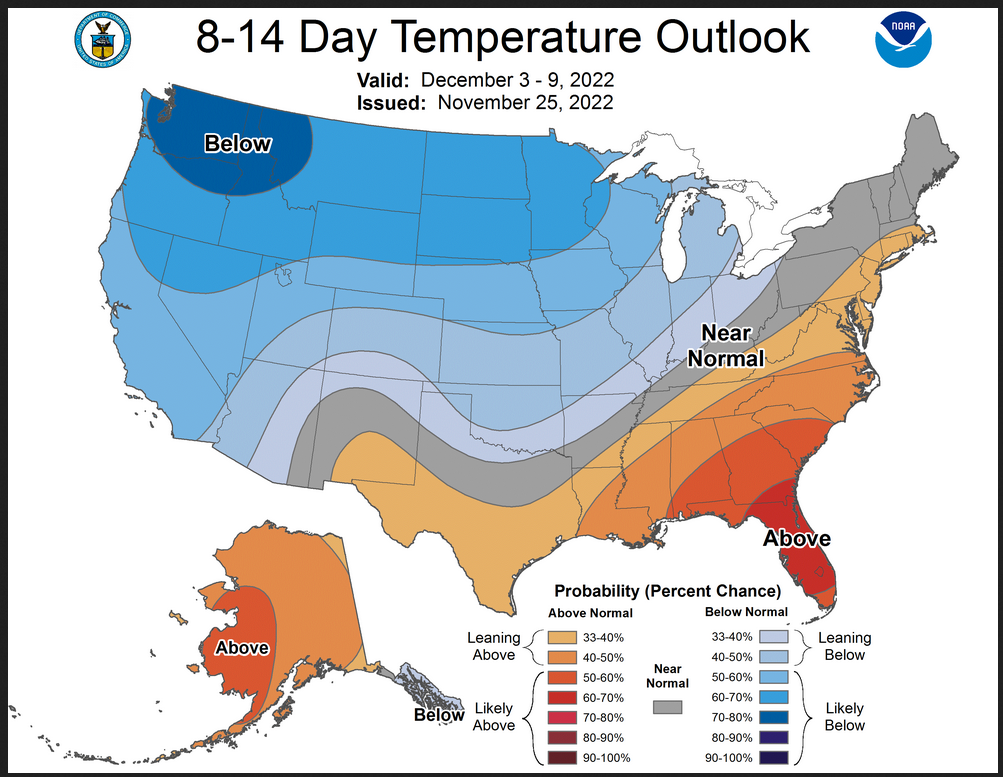
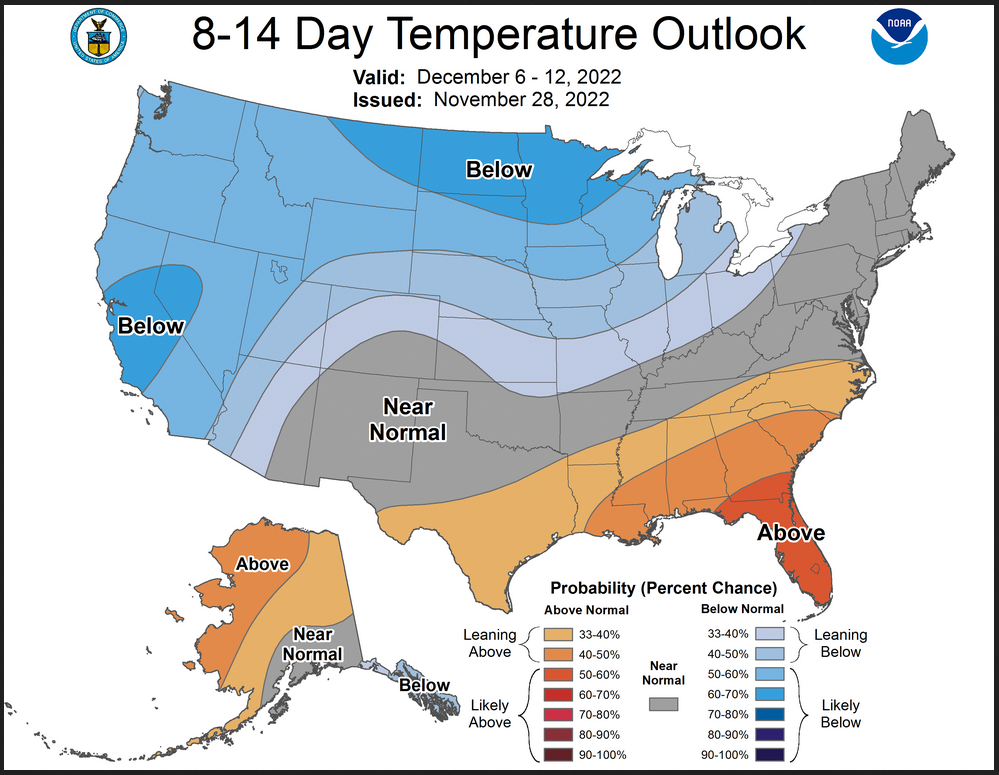
And the 8 – 14 Day Outlook issued a day later. Remember we are now looking at a period of time that is one day later so one day was moved into the 6 – 10 day outlook and one day was added to the 8 – 14 Day outlook and the two days of overlap are one day later.
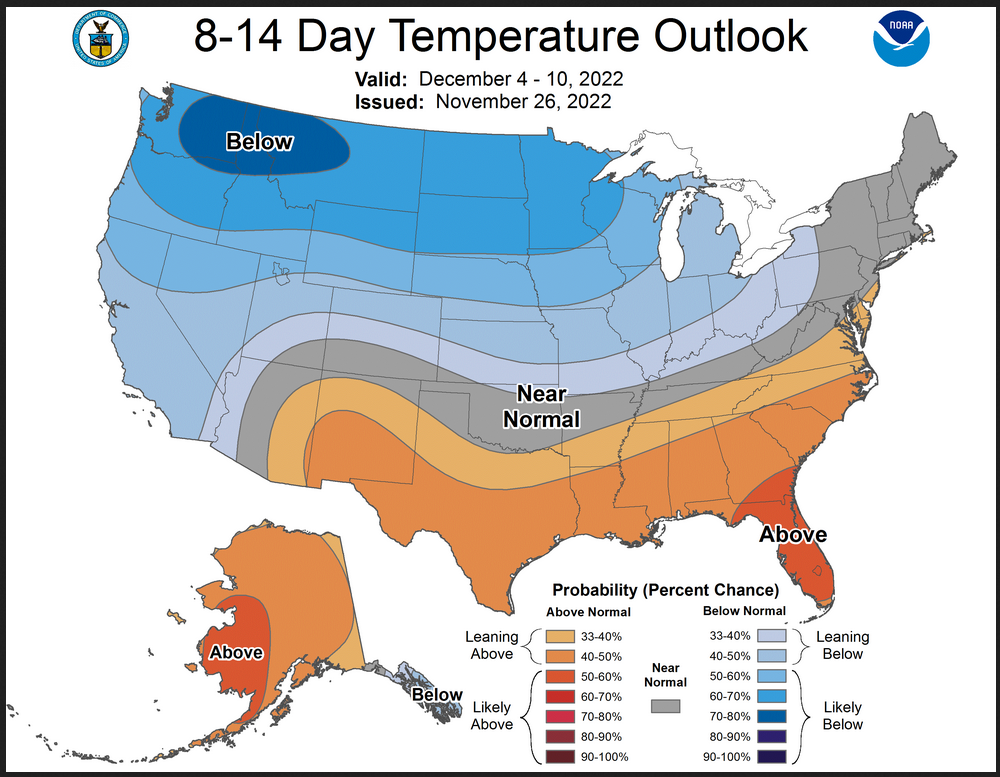
And one day later
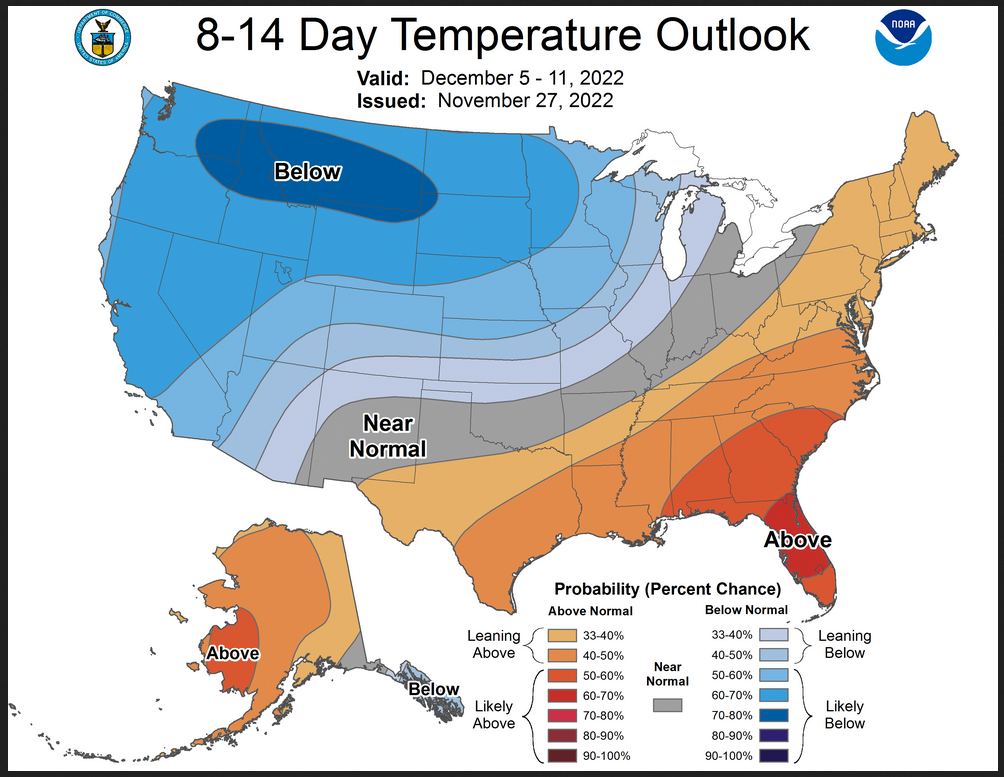
And on Monday November 28, 2022
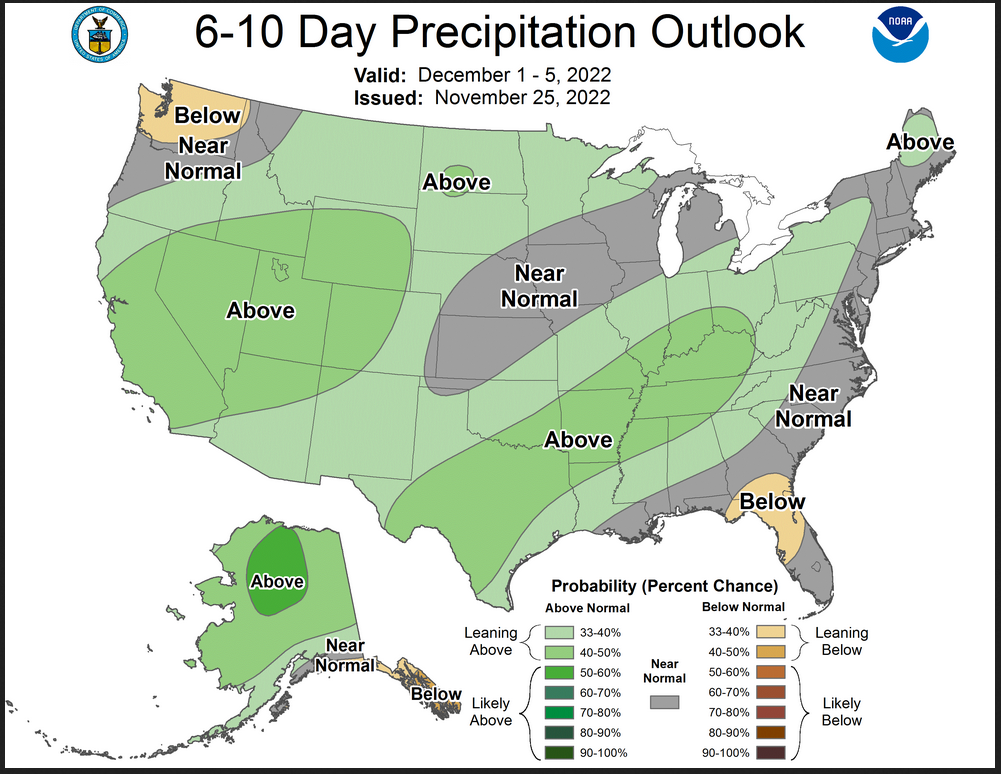
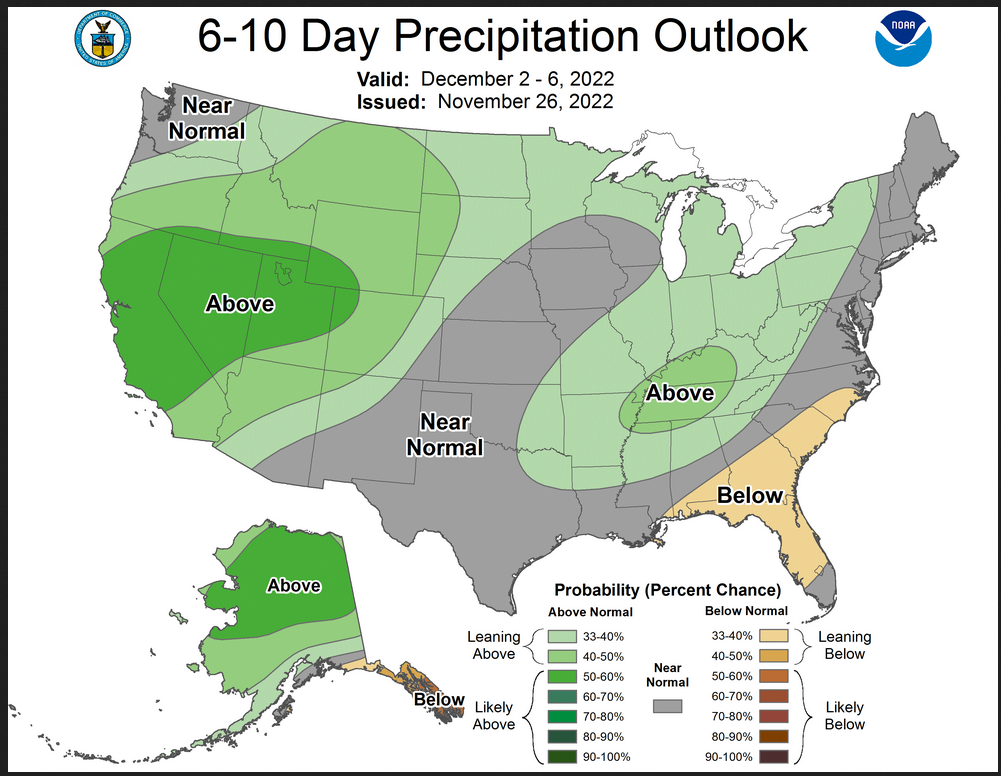
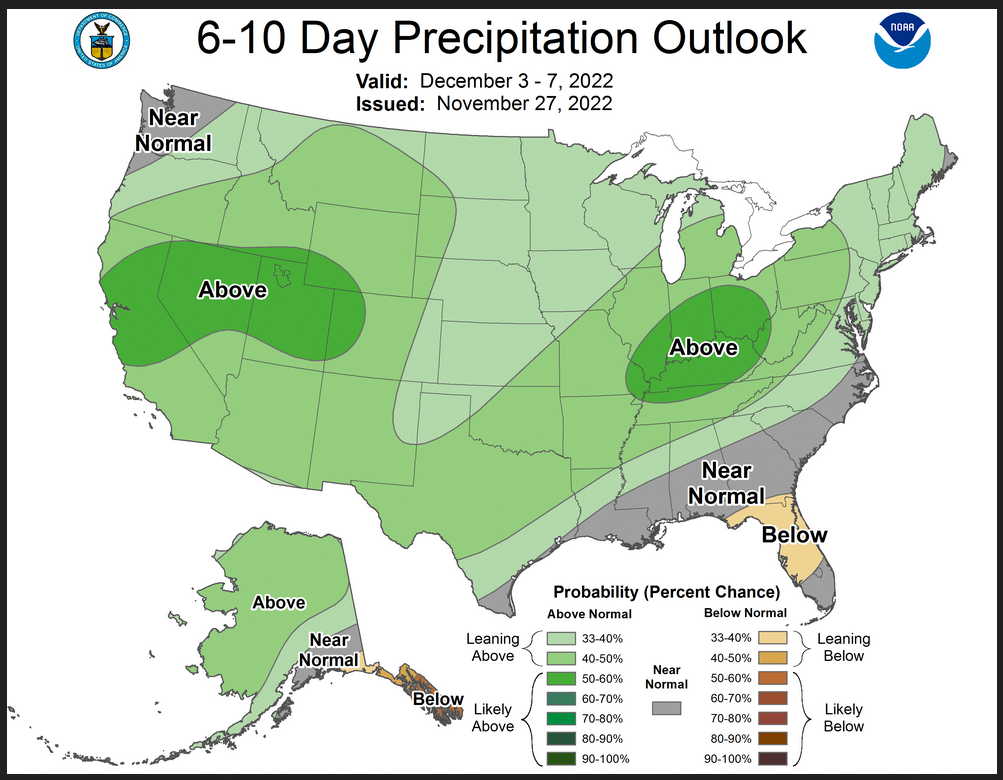
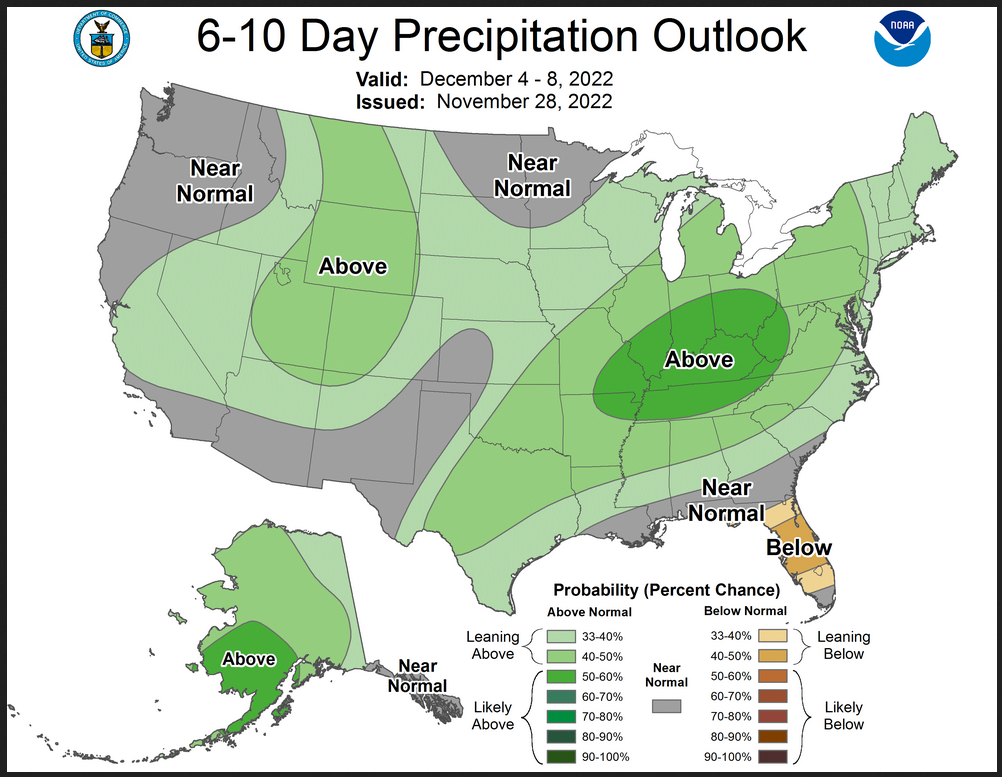
Now Precipitation
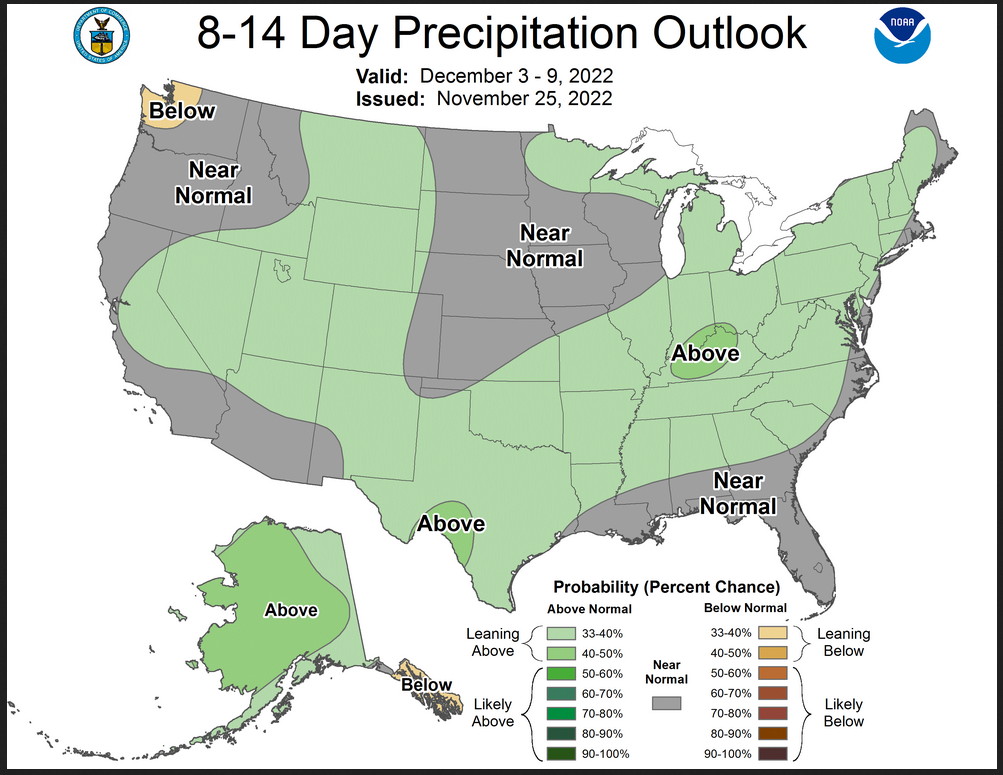
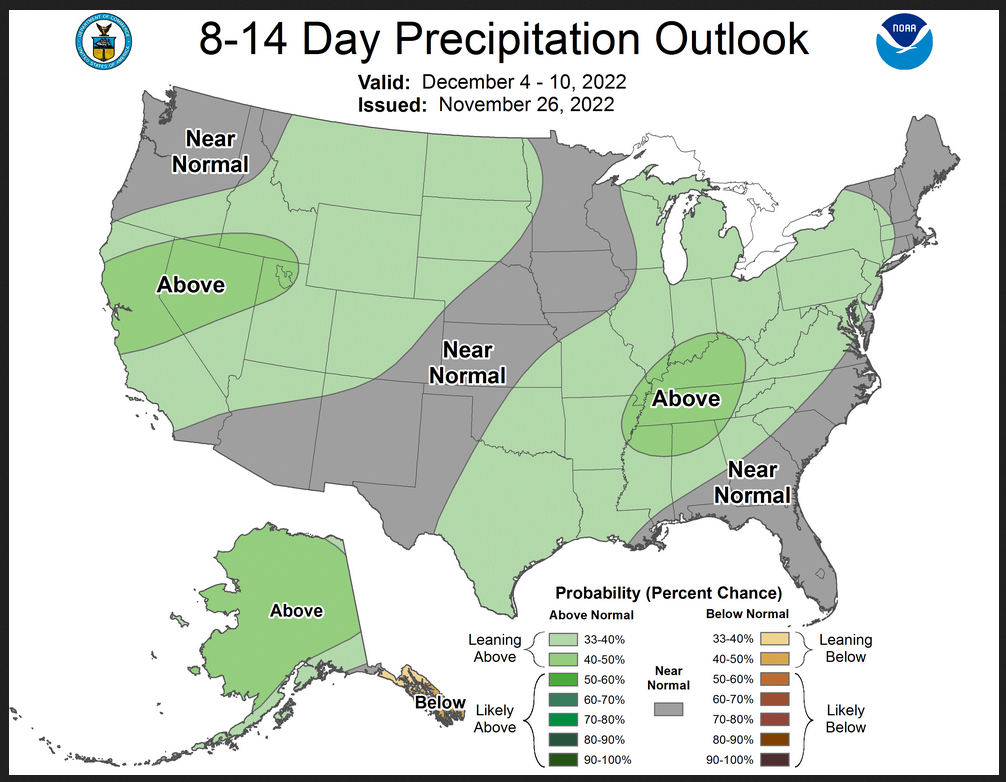
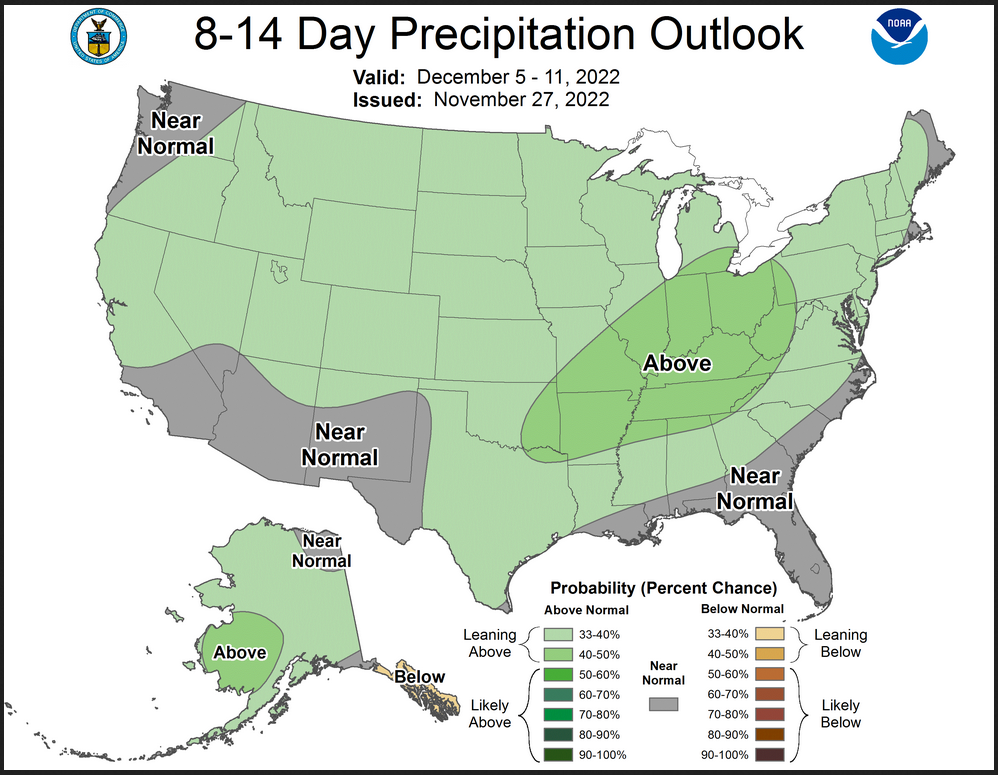
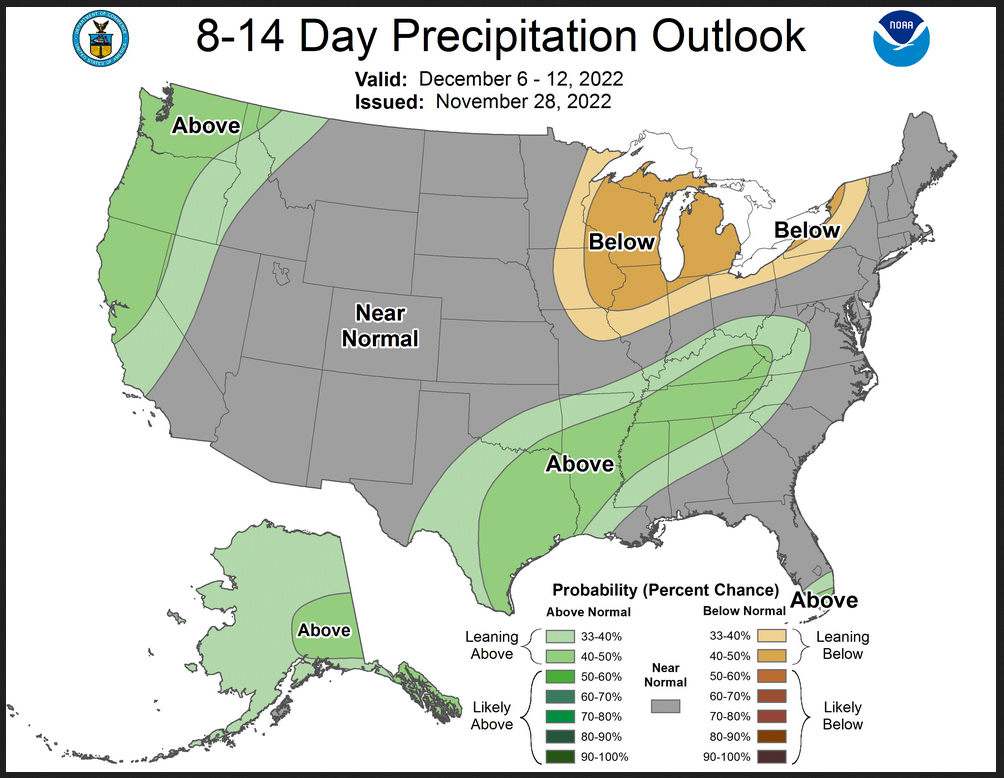
| With respect to the 8 – 14 Day Outlooks, the changes were greater than they were for the 6 – 10 day Outlooks. The change on Monday was as expected different from the weekend maps. We would have expected the 8 – 14 day Outlook to begin to converge towards the weeks 3 – 4 Outlook Issued on Friday. For temperature, we saw that and for precipitation, we did not. That is what we were looking for and somewhat confirms that the 8- 14 Day Outlook and the Week 3 – 4 Outlook showed a questionable transition. The reader might want to compare Monday’s 8 – 14 Day Outlook with the Week 3 – 4 Outlook issued last Friday. It is not what we expected to see. At this point, it raises questions about the Week 3 – 4 Outlook but it covers 14 days and we expected the change to come in the first week of the Week 3 – 4 Outlook as per the excerpts of the discussion shown at the end of this article. That does not seem to be happening but we have only three days of data to work with. We will learn more on Friday. For now, this experiment is concluded. |
Now we address Weeks 3 and 4. This is a time frame that is very important. It is half of the 28-Day forecast period. That is why we include the discussion that accompanies the maps.
–
I am concerned that we may have the same problem as last week when the CPC Friday 6 – 14 Day forecasts changed dramatically on the following monday. A shift occurs in Weeks 3 – 4 as described in the below discussion. There is more cool air intrusion along the Northern Tier. What is most interesting however is the way the Southern Tier turns dry. So that is what has peaked my interest.
–Prognostic Discussion for Week 3-4 Temperature and Experimental Precipitation Outlooks
NWS Climate Prediction Center College Park MD
300PM EST Fri Nov 25 2022Week 3-4 Forecast Discussion Valid Sat Dec 10 2022-Fri Dec 23 2022
La Niña conditions are present in the Tropical Pacific with sea surface temperature (SST) anomalies in the NINO3.4 region reaching -0.8 degrees Celsius. La Niña is expected to persist through the Northern Hemisphere winter and remains a key influence on the Weeks 3-4 Temperature and Precipitation Outlooks. Though there is some eastward propagation of the Madden Julian Oscillation (MJO) favored in the upcoming week, destructive interference from the La Niña base state is expected to weaken the MJO signal. Longer term forecasts of the Realtime Multivariate MJO (RMM) from the Global Ensemble Forecast System (GEFS) and European Centre for Medium-Range Weather Forecast (ECMWF) indicate some re-emergence of the MJO signal, but model solutions have considerable spread. Thus, the MJO’s role in the Weeks 3-4 Temperature and Precipitation Outlooks will likely be confined to the Week 3 period associated with the current active MJO. However, its influence is expected to fade into Week 4. Temperature and Precipitation Outlooks this week rely primarily on dynamical model forecasts from the Climate Forecast System version 2 (CFSv2), GEFSv12, ECMWF, and Japan Meteorological Agency (JMA) models, the Subseasonal Prediction Experiment (SubX) multimodel ensemble (MME), and persistence from the Week 2 period. Expected impacts from La Niña, decadal trends, and (when applicable) MJO are considered via Multiple Linear Regression (MLR) guidance. A manual blend of CFSv2, GEFSv12, ECMWF, JMA, and the MLR was also considered.
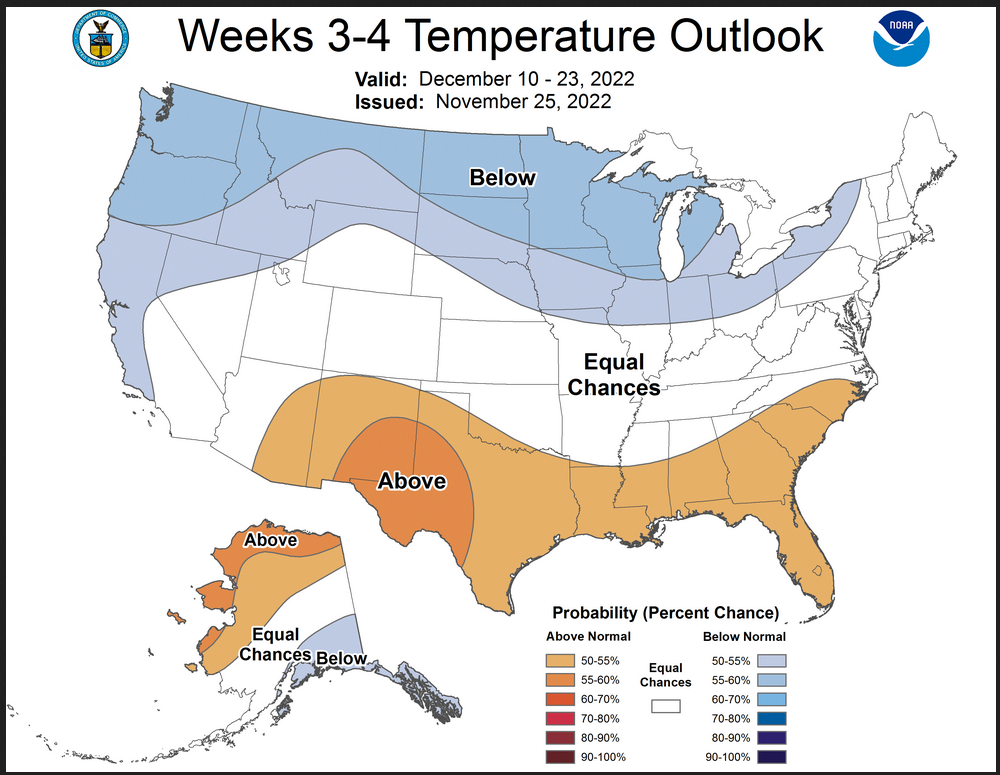
Week 3-4 500 hPa height forecasts are somewhat mixed, with CFSv2 and GEFSv12 favoring ridging over Alaska, and troughing over the northern contiguous United States (CONUS). ECMWF and JMA favor troughing over Alaska, with ECMWF expanding the troughing into the western CONUS. CFSv2, GEFSv12, and ECMWF forecast ridging over parts of the southern CONUS. JMA is an outlier with ridging over the western CONUS and troughing over New England. Higher weight was given to CFSv2, ECMWF, and GEFSv12 given their more consistent forecasts. The northern CONUS troughing is more prevalent and stronger in week 3, with forecasts of 500 hPa heights anomalies weakening and becoming more uncertain in week 4. Forecasts for week 3 were given more weight due to the stronger 500 hPa anomalies, along with the expectation that week 3 is more skillful than week 4.
Given the expectation for strong week 3 troughing over northern CONUS, a broad region of below normal probabilities is favored from the Pacific Northwest through the Great Lakes and parts of New England. Though the forecasted pattern weakens in Week 4 and potentially shifts to weak above normal probabilities, the stronger cooling in week 3 is expected to tilt the week 3-4 period as a whole toward below normal. Below normal temperature probabilities are also favored along parts of the west coast given troughing that extends along the coast in ECMWF and GEFSv12, as well as anomalously cool coastal SSTs. Above normal temperature probabilities are indicated for the southern CONUS from the Southwest to the Southeast, with the highest probabilities over parts of New Mexico and Texas where dynamical models agreed on stronger probabilities. Though the strongest ridging is over the Southeast in CFSv2, ECMWF, and GEFSv12, probabilities are weaker given below normal temperatures related to a forecasted potential negative North Atlantic Oscillation (NAO) pattern. Equal chances of above and below normal temperatures (EC) is indicated for parts of New England and the Mid-Atlantic given uncertainty among models as well as the potential for cooler temperatures related to the negative NAO. Over Alaska, above normal temperatures are forecast for northwestern parts of the state given decadal trends, and below normal is forecasted over the southeast and panhandle consistent with expected impacts from La Niña.
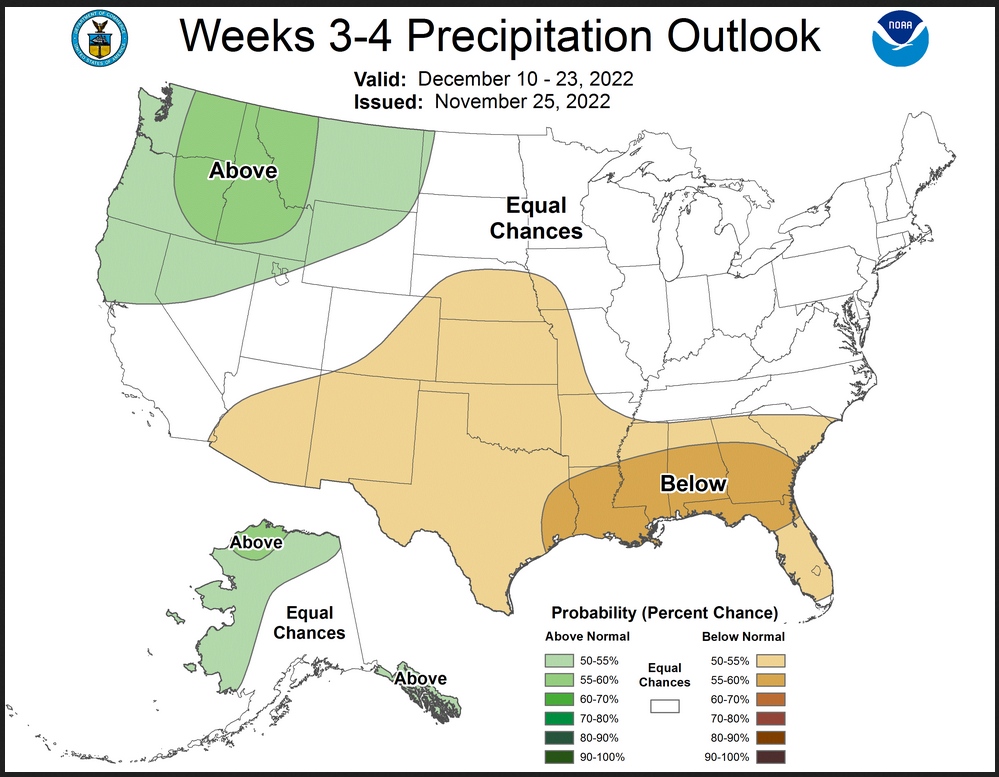
The Weeks 3-4 precipitation outlook remains consistent with last week’s forecast. Above median precipitation is indicated over the Pacific Northwest into parts of the Northern Plains, consistent with La Niña impacts and given model agreement. Below median precipitation is forecast over the Southern and Central CONUS, also expected with La Niña. Higher below normal probabilities are forecast over southern parts of the Gulf States where models have good agreement. EC is indicated for parts of southern and central California given uncertainty on the southward extent of forecasted troughing. EC is also indicated for the Great Lakes, Ohio River Valley, and New England given inconsistent model forecasts. Over Alaska, westerly flow supports enhanced probabilities for above median precipitation over western parts of the state, and models showed strong consistency for the probability of above median precipitation over the Alaskan panhandle.
The SubX MME favors above normal temperature probabilities over Hawaii consistent with above average SST anomalies, and elevated probabilities are indicated across Hawaii with the highest probabilities over Hilo. Precipitation predictions in the SubX MME generally favor probability of above median precipitation over Hilo and Kahului, with mixed but still overall above median probabilities over Honolulu and Lihue.
| It is important to note that the Week 3 -4 Outlook is prepared by a different team than the 6 -10 and 8 – 14 day Outlooks as well as the update of the monthly outlook. |
Month to Date Information

Temperature month to date can be found at https://hprcc.unl.edu/products/maps/acis/MonthTDeptUS.png
Precipitation month to date can be found at https://hprcc.unl.edu/products/maps/acis/MonthPNormUS.png
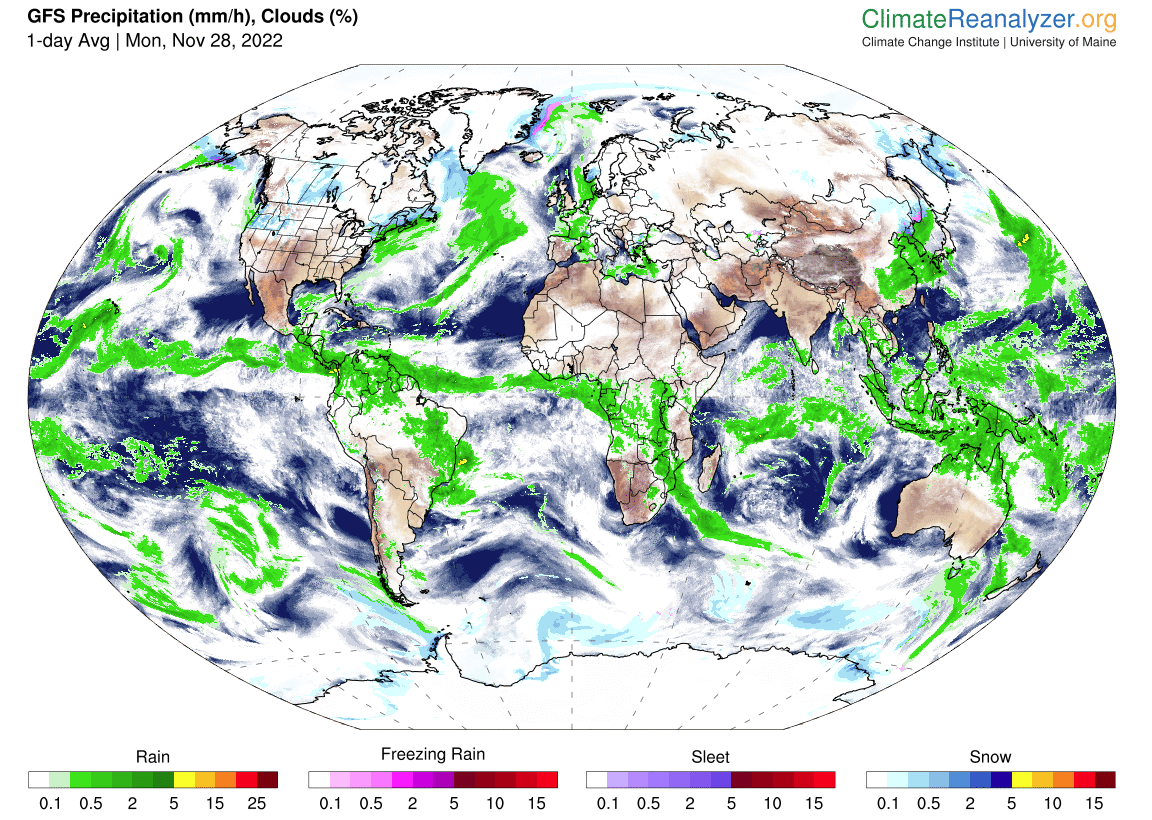
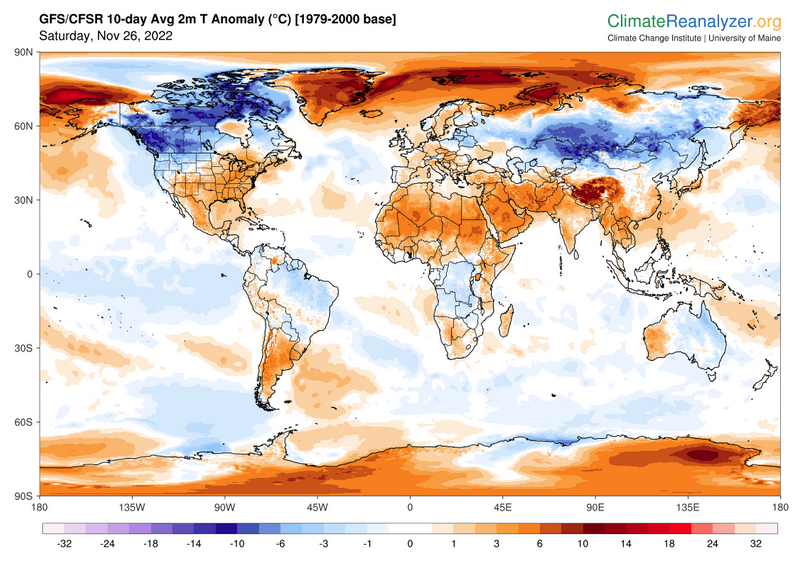
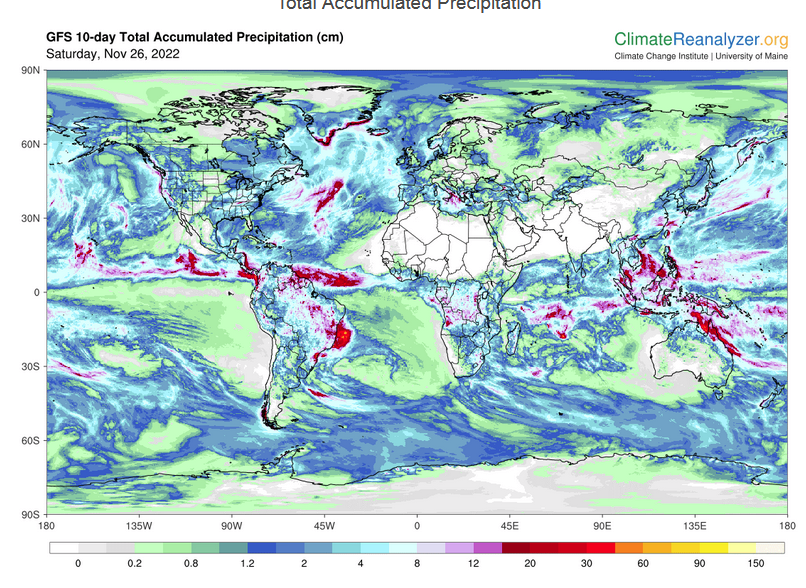
World Forecast
Below are the current precipitation forecast and the 10-Day forecasts for temperature and precipitation. Updates and additional information can be obtained HERE. Much of this information is provided by the University of Maine. They draw upon many different sources.
Worldwide Tropical Forecast (This is a NOAA Product)

(This graphic updates on Tuesdays) If it has not been updated, you can get the update by clicking here
| We now show excerpts from the 6 – 10, 8 – 14 Day, and Weeks 3 – 4 Discussions. Normally I do not show the 6- 10 Day and 8 – 14 Day Discussions in this article and they properly belong with the corresponding maps but based on what happened last weekend when the forecast flipped over the weekend, I thought it important to start with the relevant excerpts from these discussions. The mid-month change is not as dramatic as last week and to some extent may be differences in the styles of how the two teams present their outlooks but I wanted to document the excerpts from the discussions in case we have to revisit the 28-Day Outlook on Monday. |
From the 6 – 10 Day Discussion:
"The height pattern strongly supports elevated probabilities for below normal
temperatures across most of the west and central CONUS, which extend into the
Upper and Middle Mississippi Valley as well as the Upper Great Lakes region,
underneath a mean mid-level trough. Over the eastern CONUS, southerly return
flow associated with mean surface high pressure over the Southeast is favored
to keep temperatures above normal across much of the eastern CONUS, southern
New Mexico, and southern Texas."

"Predicted mid-level troughing and an active storm track increase chances of
near to above normal precipitation across much of the CONUS, except for
Washington (due to northerly flow) and parts of the Southeast (as systems are
likely to bypass these areas to the north), where below normal precipitation is
favored, consistent with the consolidation temperature forecast tool."
From the 8 – 14 Day Discussion:
"Over the western and central CONUS, predicted mean mid-level troughing and
below normal mid-level heights enhance chances for below normal temperatures,
which extend into the Upper and Middle Mississippi Valley, and the Upper Great
Lakes region. Downstream of the mean mid-level trough in the West, return flow
is forecast to keep temperatures above normal over southeastern New Mexico,
Southern Texas, and much of the eastern CONUS."

"Over the CONUS, troughing over the West and zonal flow over the remainder of
the CONUS favors a potentially active storm track. Therefore near to above
normal precipitation probabilities are slightly favored across much of the
CONUS, except for western Washington due to northerly flow, where near to below
normal precipitation is favored."
From the Week 3 -4 Discussion:
“Given the expectation for strong week 3 troughing over northern CONUS, a broad region of below normal probabilities is favored from the Pacific Northwest through the Great Lakes and parts of New England”……….. “Above normal temperature probabilities are indicated for the southern CONUS from the Southwest to the Southeast, with the highest probabilities over parts of New Mexico and Texas where dynamical models agreed on stronger probabilities. Though the strongest ridging is over the Southeast in CFSv2, ECMWF, and GEFSv12, probabilities are weaker given below normal temperatures related to a forecasted potential negative North Atlantic Oscillation (NAO) pattern. Equal chances of above and below normal temperatures (EC) is indicated for parts of New England and the Mid-Atlantic given uncertainty among models as well as the potential for cooler temperatures related to the negative NAO. Over Alaska, above normal temperatures are forecast for northwestern parts of the state given decadal trends, and below normal is forecasted over the southeast and panhandle consistent with expected impacts from La Niña.”
“The Weeks 3-4 precipitation outlook remains consistent with last week’s forecast. Above median precipitation is indicated over the Pacific Northwest into parts of the Northern Plains, consistent with La Niña impacts and given model agreement. Below median precipitation is forecast over the Southern and Central CONUS, also expected with La Niña. Higher below normal probabilities are forecast over southern parts of the Gulf States where models have good agreement. EC is indicated for parts of southern and central California given uncertainty on the southward extent of forecasted troughing. EC is also indicated for the Great Lakes, Ohio River Valley, and New England given inconsistent model forecasts.”
| What we seem to have is three similar discussions but a large difference in the week 3 – 4 Outlook as compared to the Day 6 – 10 and 8 – 14 Outlooks. It may all make sense especially when you read the Week 3 – 4 Discussion carefully. But there was a problem last week and I decided to carefully monitor the situation over this weekend. It will be interesting if the Monday 6 – 10 and 8 – 14 Day outlook maps change a lot taking into consideration that they reflect a period of time that is three days later. I usually do not pay attention to the maps produced over the weekend as they are what is called “first look” maps and are what come off the computer without any review by meteorologists unless they clearly are messed up. I think this means that the mix of forecasts from different models does not change over the weekend. That is why there are often significant changes on Monday. But I will look at the Saturday and Sunday maps and may show them in this article if they are interesting. Usually, I just publish what NOAA produces. But sometimes I see the need to provide a little more depth for readers. Given what took place last weekend and the less dramatic but still significant change projected for the second part of the 28-day period, I thought I would be a bit more critical in my article tonight. It may turn out that everything is exactly as it should be or it may turn out that being a little skeptical could turn out to be interesting. Either way, it is a good exercise in how one should look at weather reports. It is always a good idea to compare maps to discussions. The maps should reflect what is in the discussion. There should be continuity from one time period to the next in the sense that changes in maps should be reflected in the change in the discussion. In my articles, I only provide the final product. There is a lot of additional information that is publicly available but I do not have the time to review let alone publish that information and my article would be unreadable if I included all of that information. So it is always a challenge to decide if I should be comfortable with the maps produced by NOAA (in this case the CPC Division) or if I should say that we need to be careful with the maps right now to see if the predictions remain stable over a two or three day period. We will see if it gets interesting or not. |