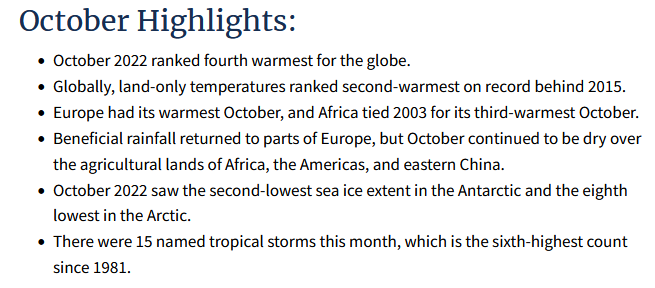
I have consolidated a few NOAA Reports on Worldwide Climate in October 2022. In one case I have tried to put it the information in a better perspective. October was very warm but did not set a record. Temperatures seem to have plateaued. If ENSO switches to El Nino we may then see another true increase in Global Land Temperatures. In a couple of days, I will provide an article specific to the U.S.

–
| I assembled the information from two related sources Here and Here. They are basically the same source NCEI. NOAA has a very large amount of information available to them and different parts of the organization prepare reports for the public and use different graphics and present different highlights. I have tried to integrate two or three reports and I am not sure I have done it perfectly. |
–
–
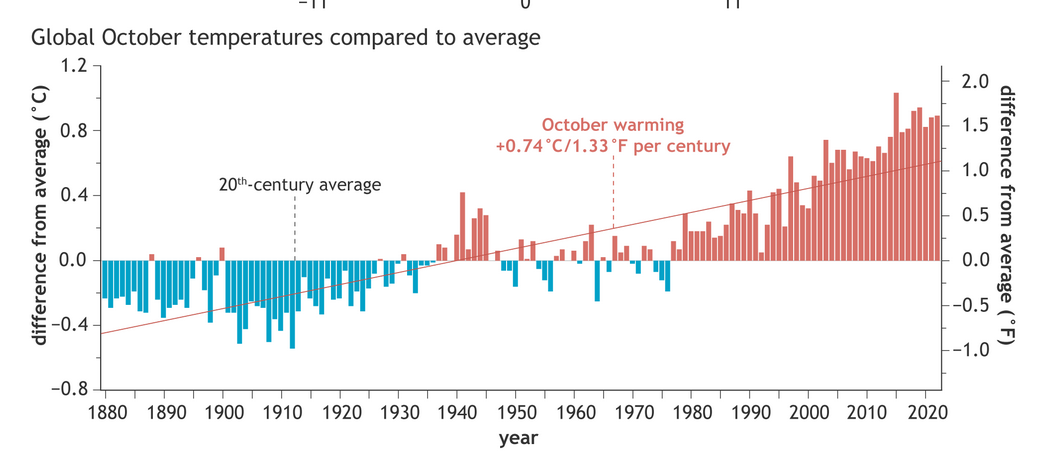
| The above in my opinion is the most important graphic. It shows that the Earth is getting warmer. It has a regression line that shows the rate of the warming. +0.74C increase in temperature per century helps to put the problem in perspective. It shows that recent years have been quite warm. But it also shows a plateau i.e. 2022 did not set a new record. One might detect some long cycles in the data. Let’s now look at the additional information from the two or three related reports that I utilized. |
–
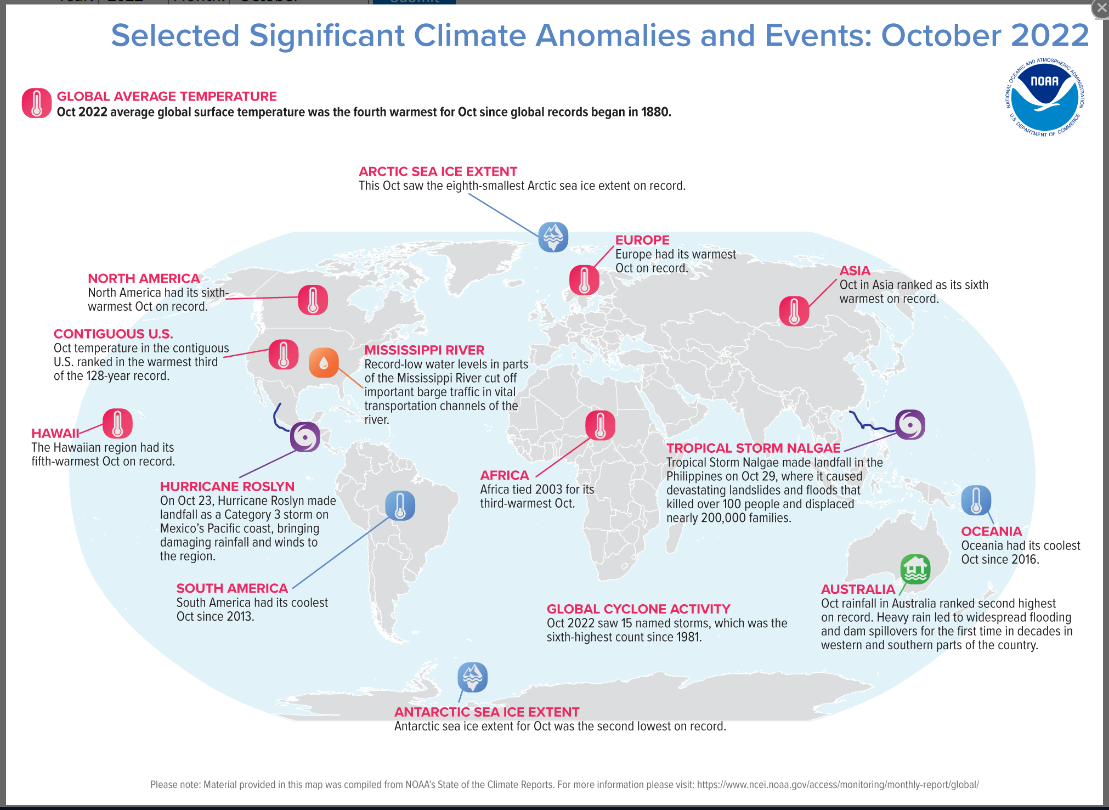
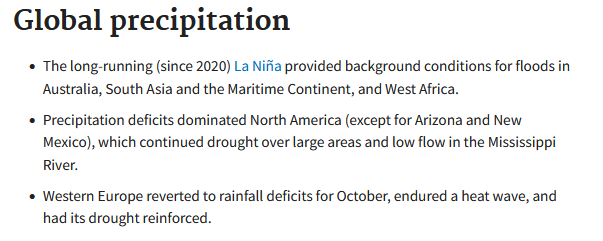
| This shows the significant climate anomalies and events in October 2022 |
–
Now let us look at Temperature and Precipitation
–
–
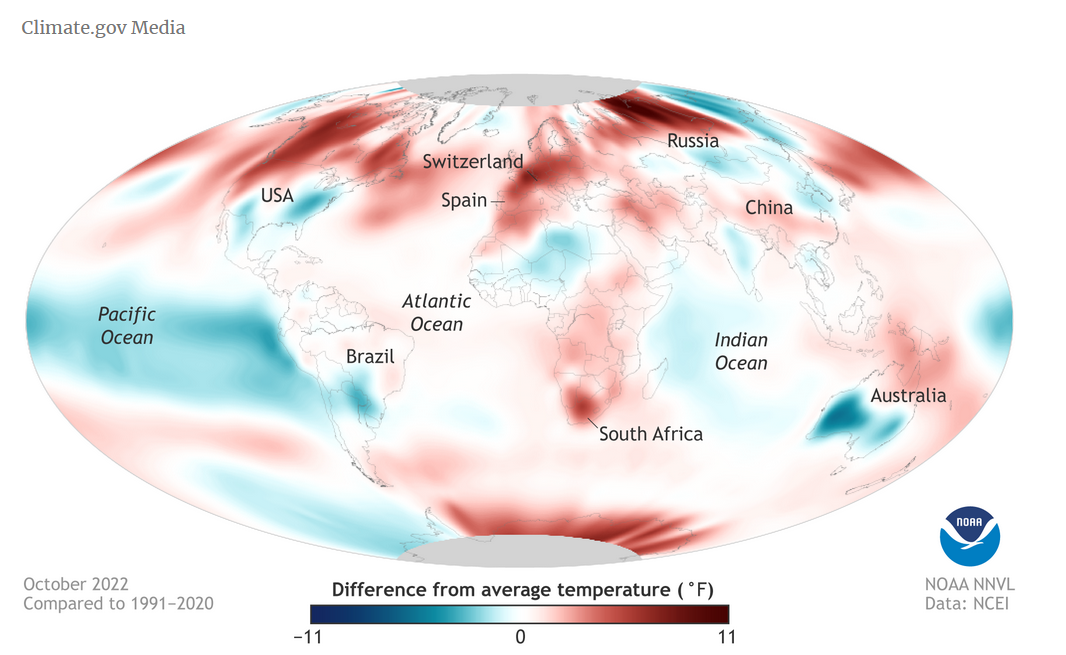
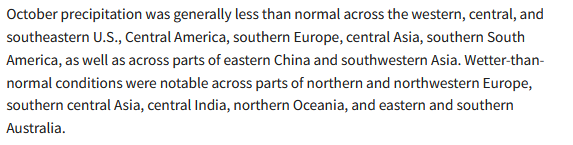
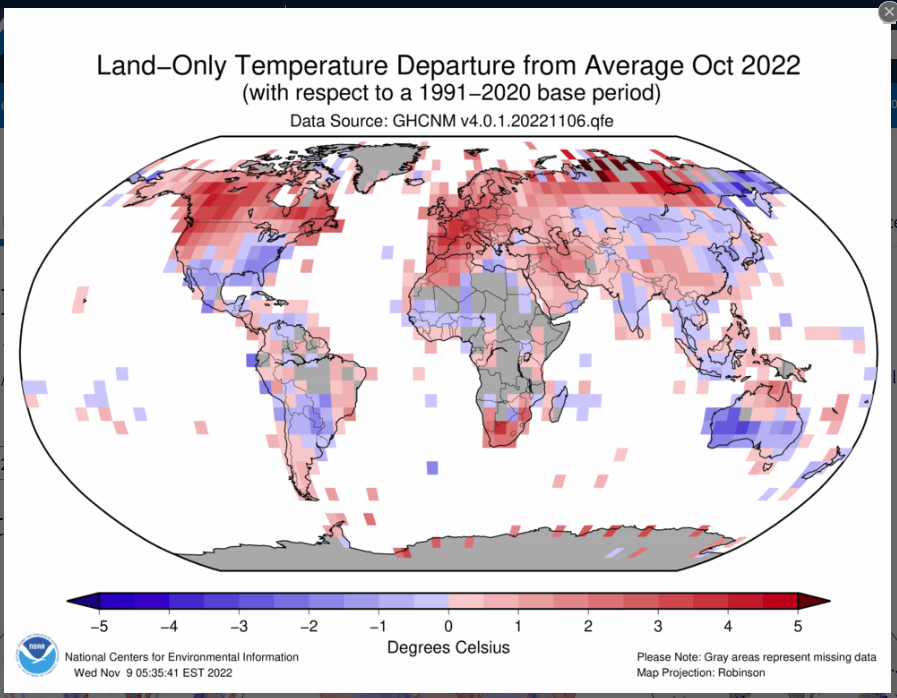
| This shows where it was warm and where it was cool relative to Climate Norms. |
–
Additional Graphics
–
–
| Similar to a graphic shown above, this provides more detail as to where it was warm and where it was cool relative to climatology |
–
–
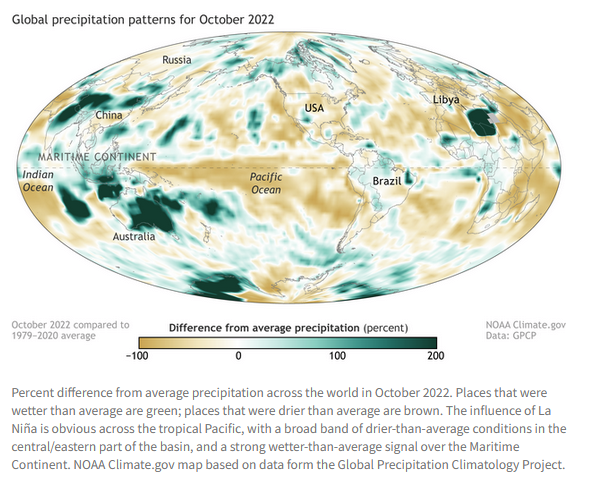
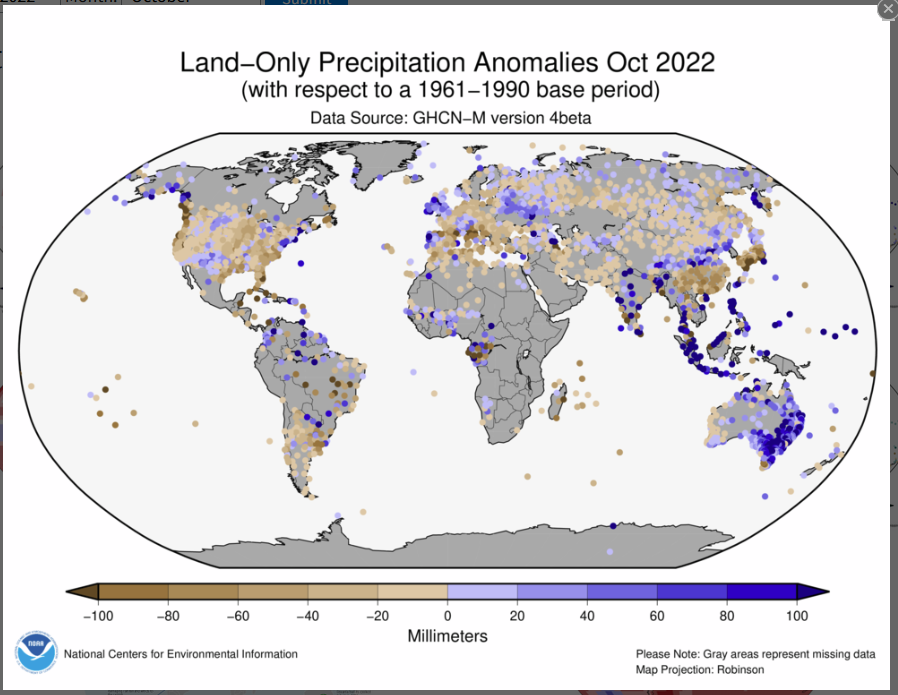
| This does the same for precipitation |
–
| I hope you found this article interesting and useful |
–