Updated Wednesday Morning
Here is what we are paying attention to today and the next 48 hours from Wednesday Morning’s NWS Forecast.
...Rain and mountain snow possible across the Northern/Central Rockies and
Northern Plains today...

...Heavy rainfall to spread across parts of the Southern Plains and Lower
Mississippi Valley on Thanksgiving Day...

...Potentially impactful snow could begin as early as Thursday night for
parts of the Southern Plains...
Continuation of the NWS Short Range Forecast (It is updated by NWS twice a day and these updates can be found here. We post at least one of those updates daily, sometimes both.
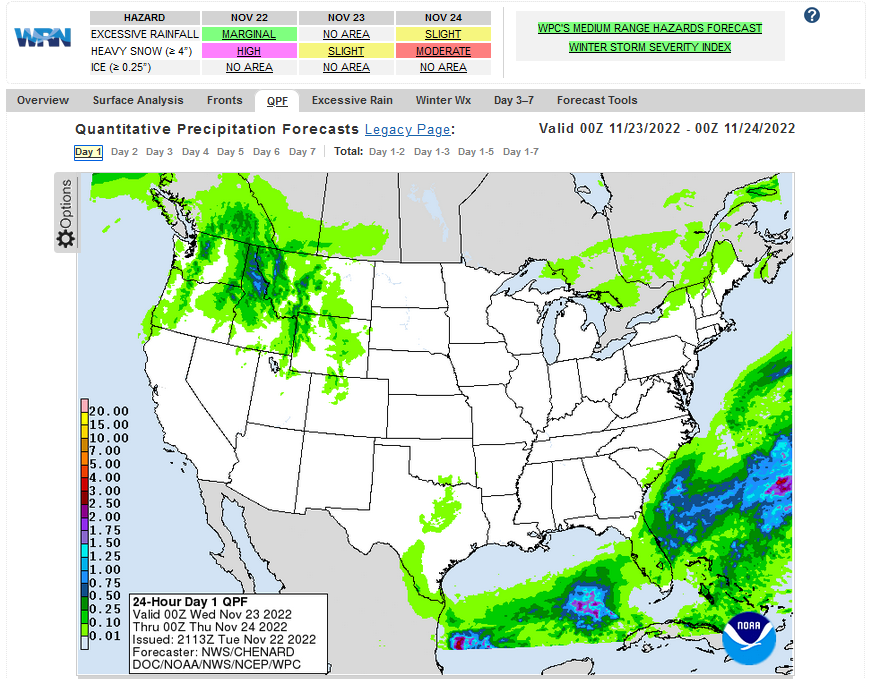
An upper-level trough will dig into the Rockies today and into the
Southern Plains as a closed low by Thanksgiving. An upper ridge moves into
the West while an elongated trough emerges over the Pacific Northwest
toward the end of the week.

The main area of concern heading into the Thanksgiving holiday will be the
potential for a dynamic low pressure system to impact portions of the
Southern Plains and Lower Mississippi Valley with heavy rainfall, snow and
thunderstorms. An upper trough will rapidly intensify as it digs into the
Rockies today. Mountain snow is expected over the higher elevations of the
Northern/Central Rockies and Northern/Central Plains, while light rain is
likely over lower elevations of the Northwest. Anywhere between 4-8 inches
of snow are possible for the aforementioned areas with locally higher
amounts possible. This precipitation will be welcomed in the Northwest,
due to poor air quality which has plagued the region since early this
week. Air stagnation advisories and air quality alerts remain in effect
for parts of southern Oregon and western Idaho as high pressure and calm
surface winds persist over those areas.

Our western trough will amplify over the Southern Plains and begin tapping
into moisture from the Gulf of Mexico on Thanksgiving. Heavy rainfall will
spread across eastern Texas and into the Lower Mississippi Valley as a
result. A slight risk of excessive rainfall leading to flash flooding is
in effect for eastern Texas, much of north-central Louisiana, southern
Arkansas and much of Mississippi on Thursday. Scattered thunderstorms are
expected with the potential for isolated severe thunderstorms to develop
within areas of increased instability. Several inches of rain are expected
to have fallen across the aforementioned areas by this Saturday morning.
Holiday travel within the Lower Mississippi Valley may be impacted by the
heavy rain on Thursday and Friday.

Moderate to heavy snow is possible on the backside of this surface low
pressure system over the Texas Panhandle and eastern New Mexico on
Thanksgiving night into Friday morning. Moisture is expected to wrap
around the surface low and interact with cold air filtering into the
region on Thursday night. A stripe of moderate snowfall is likely to
develop somewhere from eastern New Mexico into the Texas Panhandle where
between 4-6 inches of snow is likely with locally higher amounts possible.
There's still some uncertainty with respect to the timing and placement of
the heaviest snow band associated with this system, but folks doing
holiday shopping or traveling within the Texas Panhandle should consider
impacts from the snow on Thursday night-Friday morning. Temperatures will
remain above average for much of the north-central and eastern part of the
country through Friday while the Southern Plains cools down on the
backside of the deepening trough. High temperatures in the 30s and 40s
over New Mexico and western Texas on Thanksgiving will be a 15-25 degree
departure from normal. An upper ridge will shift into the West bringing
with it above normal temperatures to the West Coast through Friday.
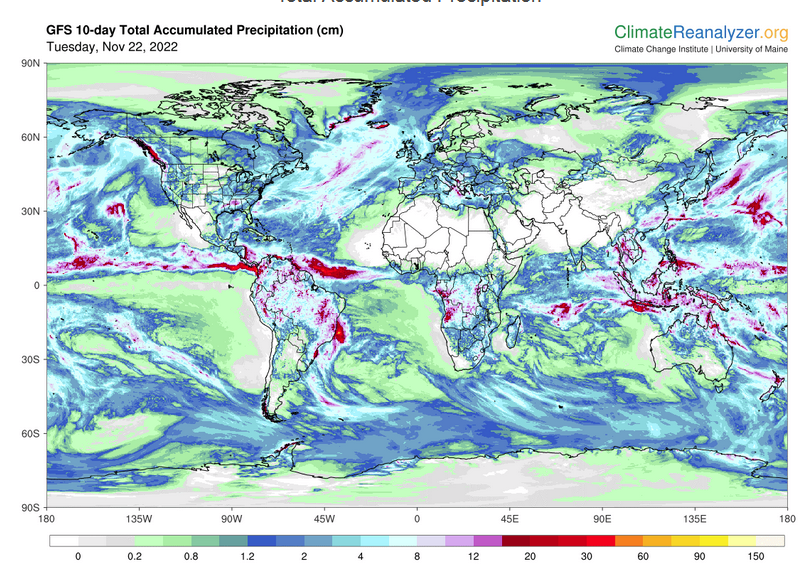
Current forecast of heavy precipitation (Updates can be found HERE)
Maps that relate the forecast to geography can be found by clicking Here for Day 1 and Here for Day 2.
Here is a 60-hour animated forecast map that shows how the short-term forecast is expected to play out
If it needs to be updated click here.
ATMOSPHERIC RIVERS
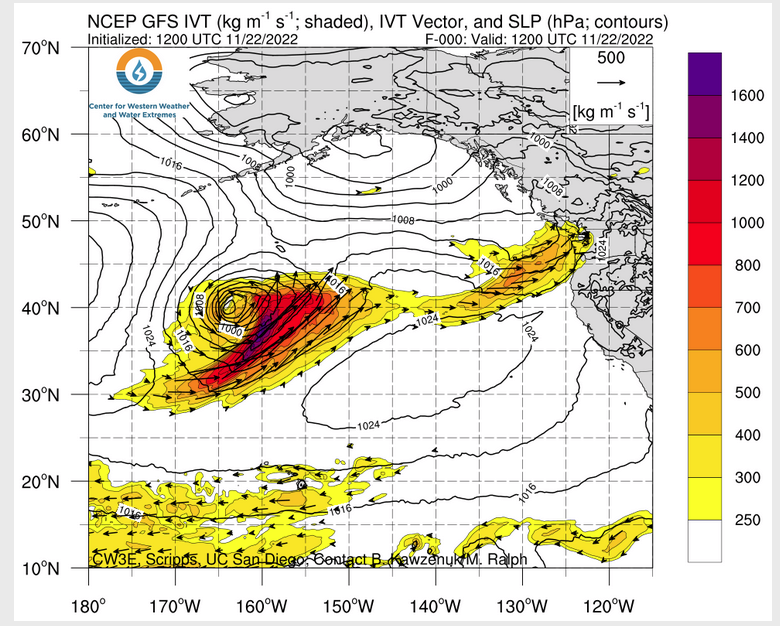
Click HERE to update. Here is some useful information about Atmospheric Rivers.
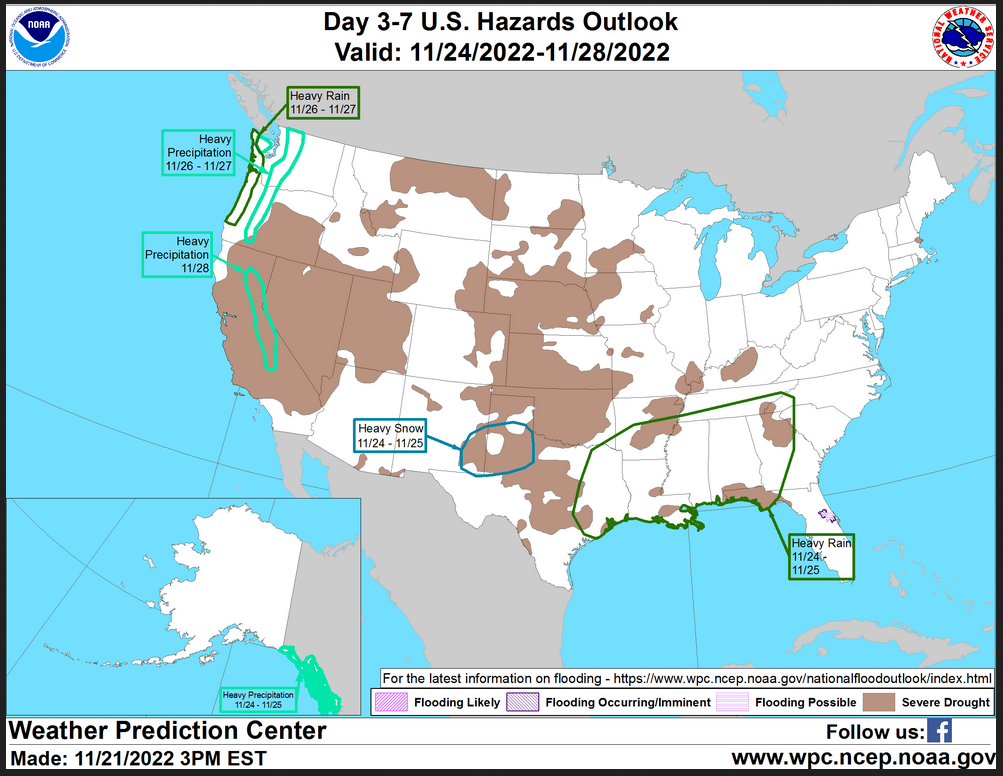
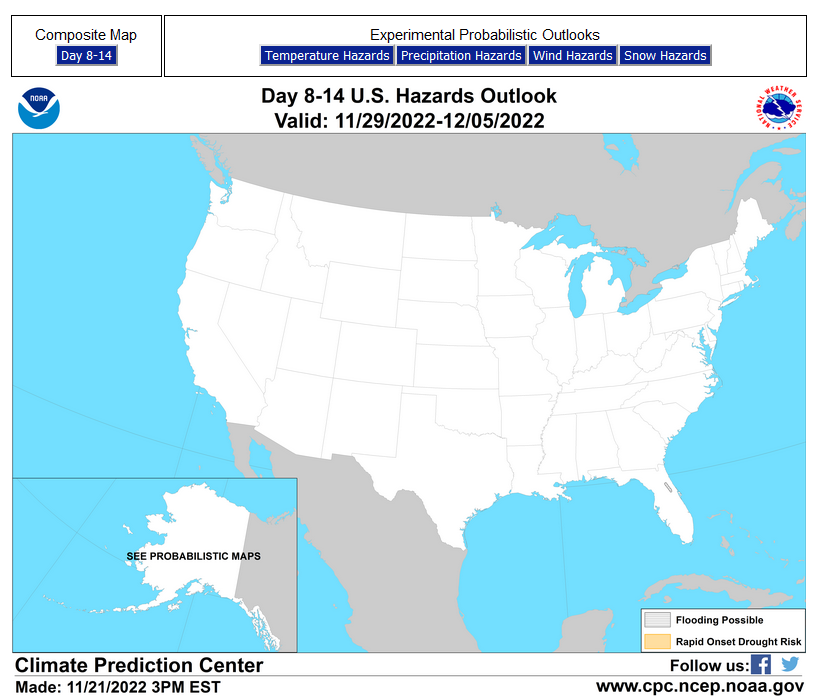
HAZARDS OUTLOOKS
Click here for the latest complete Day 3 -7 Hazards forecast which updates only on weekdays. Once a week probably Monday or Tuesday I will update the images. I provided the link for readers to get daily updates on weekdays. Use your own judgment to decide if you need to update these images.
Worldwide Tropical Forecast
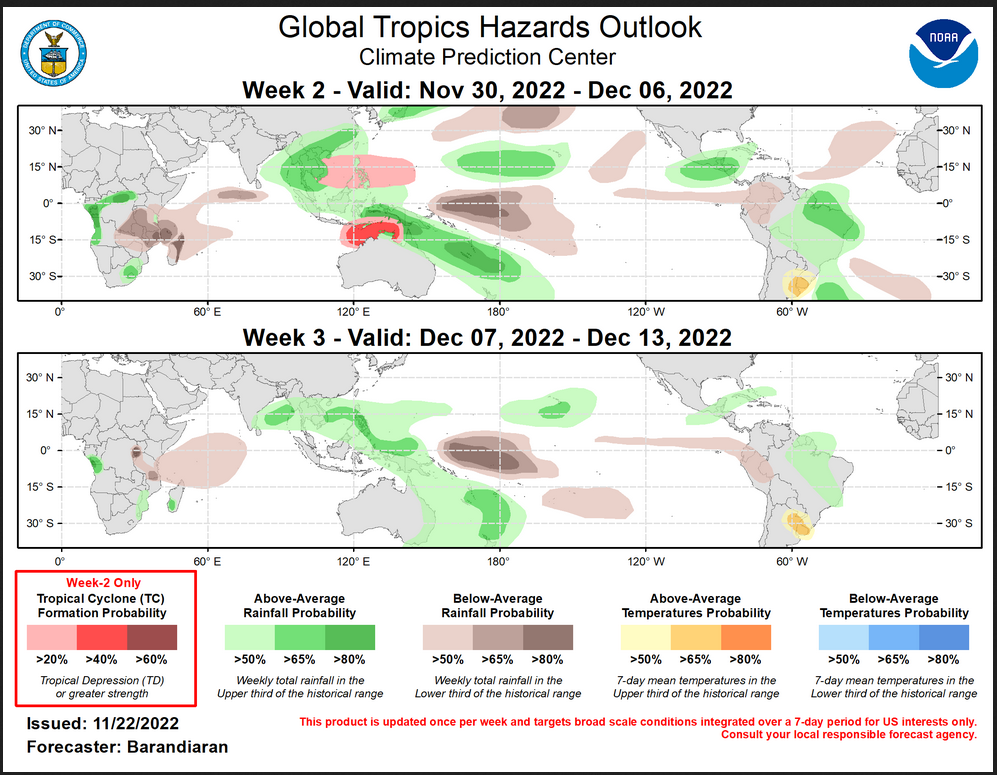
(This graphic updates on Tuesdays) If it has not been updated, you can get the update by clicking here This is a new approach and covers weeks 2 and 3 not weeks 1 and 2. It has more information but I am having trouble getting used to it. As usual, it comes with a discussion which is below
Detailed Maps and Reports for the Western Atlantic and the Pacific Oceans
Below are four maps that summarize the situation for the Atlantic, Eastern, Central Pacific, and Western Pacific. Additional information can be accessed by clicking HERE
First the Atlantic
Click to view the forecast map and have access to additional information https://www.nhc .noaa.gov/gtwo.php?basin= atlc&fdays=5
Then Eastern Pacific
Click to view the forecast map and have access to additional information https://www.nhc.noaa.gov/gtwo.php?basin=epac&fdays=5
Then Central Pacific
Click to view the forecast map and have access to additional information https://www.nhc.noaa.gov/gtwo.php?basin=cpac&fdays=5
And the Western Pacific
Click to view the forecast map and have access to additional information https://www.metoc.navy.mil/jtwc/jtwc.html
Some Intermediate-Term Outlooks
Links to “Outlook” maps and discussions for three time periods. Days 6 – 10, Days 8 – 14, and Weeks 3 and 4. An outlook differs from a forecast based on how NOAA uses these terms in that an “outlook” presents information from deviation from normal and the likelihood of these deviations.
You have to click on the links because they do not update automatically and I do not want to have stale images in the article. But it is not difficult to click on a link and you get a large image plus a discussion. On Fridays in a separate article, we will show the images and provide a link in this article that article. But remember what you will see is the images as of Friday. But here you can get the current images simply by clicking on them. Then hit the return arrow at the upper left of your screen to return to the article. You will not find this information easily anywhere else.

| There was a drastic change in the forecast from Friday to Monday so you may want to click on the above links to see the current outlook. We show the maps in the weekend edition of our weather reporting. It is not possible at this time for us to provide all of the weather maps every day but we provide the links so readers can click on the links and view them. |
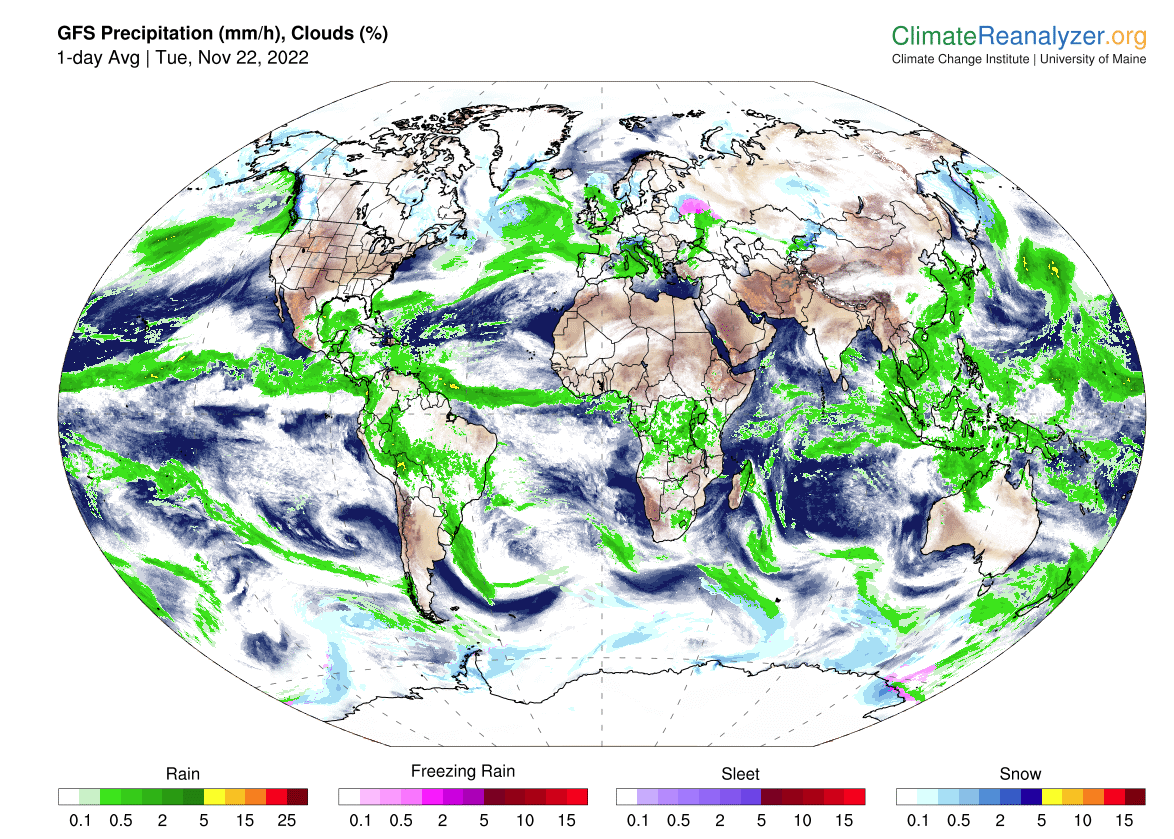
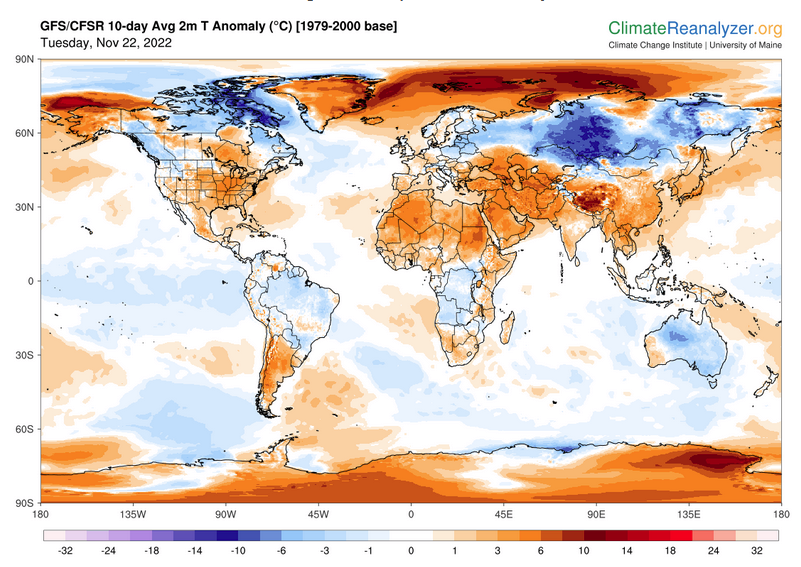
Worldwide Weather
Below maps are the short-term forecast for precipitation and 10-day forecast for temperature and precipitation. I update them daily but if you are looking at an out-of-date version of this article the current forecast maps can be obtained HERE.
Month to Date Information
Month to date Temperature can be found at https://hprcc.unl.edu/products/maps/acis/MonthTDeptUS.png
Month to date Precipitation can be found at https://hprcc.unl.edu/products/maps/acis/MonthPNormUS.png