Updated at 6:32 pm EST November 21, 2022: There has been a shocking major change in the 6 – 14 Day Outlook. I will review the NOAA discussions to better understand why. There are no discussions issued with the Saturday and Sunday 6- 10 and 8 – 14 day Outlooks but perhaps I should have looked at the maps coming off the printer/plotter. I usually pay more attention to the discussion released on Fridays with the Week 3 – 4 Outlook as I think they do a better job.
During the week, we provide 48-Hour reports which focus on the shorter-term predictions but also have links to all the partial-month outlooks.
Once a week we show many of the actual forecast maps not just provide the links to these maps. This makes it easier for the reader. Our report provides a separate forecast for Days 1 and 2, Days 1-5, Days 6 -10, Days 8 – 14, and weeks 3 and 4. We also include a next-day and 10-Day World Temperature and Precipitation Forecast. This provides information that is useful to readers in terms of planning their activities for the weekend and the next 28 days. Tomorrow and Monday I will update the article with more recent short-term forecasts.
From the Week 3 -4 Discussion:
Over the equatorial Pacific, La Niña conditions persist, with below normal sea surface temperatures (SSTs) and reduced tropical convection in all Niño regions. In contrast, convection currently exists over the Maritime Continent associated with the emergence of the MJO into RMM phase 5. Both GEFS and ECMWF ensemble forecasts depict the propagation of the MJO through phases 5, 6 and 7 (Maritime Continent to the Western Pacific) over the next two weeks. After this time, the ensemble spread indicates a great deal of uncertainty as to either the continued propagation or the decay of the MJO. Regardless, the tropical convection associated with this active MJO during the two weeks leading up to Week 3-4 will produce upper-level divergence that resides in a favorable location to interact with the subtropical jet exiting southeast Asia. This interaction will produce a source for Rossby waves capable of propagating downstream and impacting surface conditions over CONUS/AK during the Week 3-4 period. Statistically, this sort of propagation is associated with troughing over AK and ridging over CONUS at short leads. However, at Week 3-4 leads the pattern typically reverses with ridging over AK and trouging over CONUS, reminiscent of a negative PNA pattern. Further downstream, a negative NAO is typically observed. Thus, a pattern shift that projects onto the negative phases of both the PNA and NAO is favored to occur near the end of Week 2 or beginning of Week 3. Whether this shift actually occurs and its exact timing are uncertain, which leads to overall low confidence probabilities throughout this Week 3-4 forecast.
I have chosen not to try to explain all the factors that go into this forecast. If anyone is interested post a comment and I will reply to it.
When we publish on Friday night, it provides a 28-day view of the future. What is important is that this is a longer-term view than one that is typically available in the media and online.

–
This weekend you can also look at the recent NOAA Mid-Month Outlook for December and overlapping three-month forecasts through the end of next year. We reported on this HERE |
We will start with the short-term (today, tomorrow and five-day cumulative)- It is up to date as of today. If you look at this article after today you can click the links to update (plus you will end up with a lot of additional information)
Maps that relate the forecast to geography can be found by clicking Here for Day 1 and Here for Da y 2.
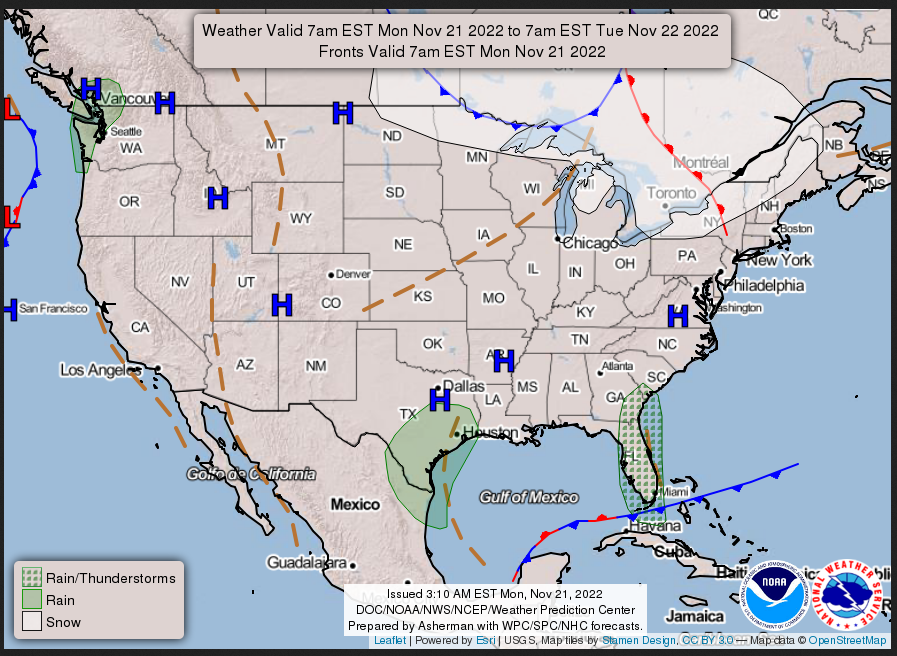
Today
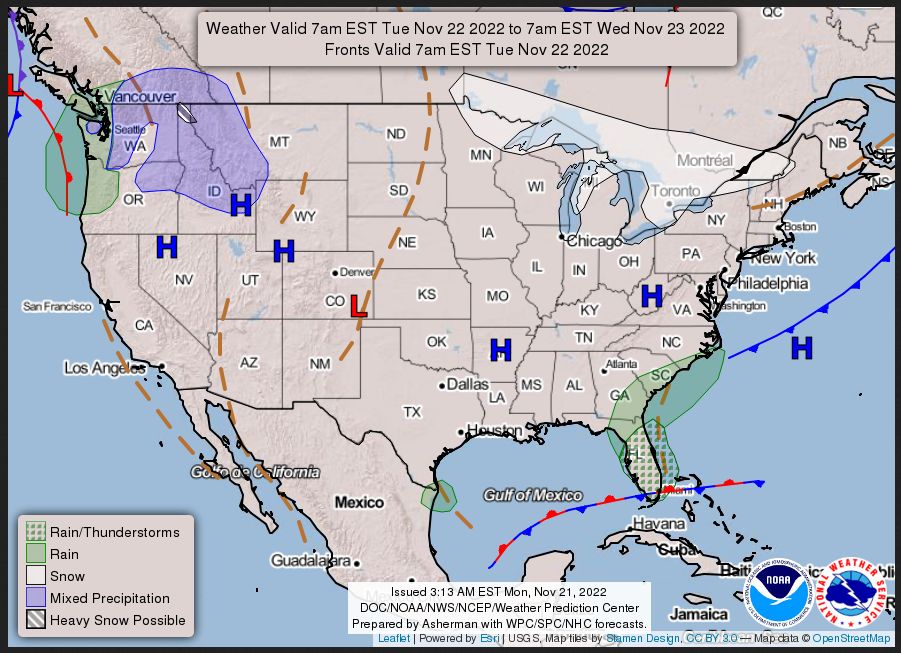
Tomorrow
Here is the National Weather Service 48 hour+forecast. Updates can be found here.
I will probably be doing updates during the weekend. It only updates twice a day. I definitely will update this discussion every twelve hours. It is not likely to change much other than things forecast to occur later will then show as happening 12 hours sooner. But you never know.
Short Range Forecast Discussion
NWS Weather Prediction Center College Park MD
201 PM EST Mon Nov 21 2022

Valid 00Z Tue Nov 22 2022 - 00Z Thu Nov 24 2022

...Snow for the Northern Cascades and Northern Intermountain
Region/Northern Rockies...

...Temperatures will be 10 to 25 degrees below average over the Western
/Central Gulf Coast...

...Rain/freezing rain over parts of Washington State on Tuesday...

Upper-level impulses will produce lingering light snow over parts of
Northern New England and the Upper Great Lakes through Wednesday.
Meanwhile, a front over the Northern Pacific will move onshore over the
Northwest on Tuesday, moving to the Northern Plains by Wednesday evening.
The system will produce light rain and higher-elevation snow over the
Pacific Northwest on Tuesday morning, becoming more scattered by Tuesday
evening. The combination of snow and ice may cause hazardous road
conditions through tonight in this region. As the warm air moves inland
over Washington State, rain/freezing rain will develop over parts of
Central Washington State. Overnight Tuesday, snow moves into the Northern
Intermountain Region/Northern Rockies into Wednesday. Moreover, the Air
Stagnation Advisories will end on Monday afternoon as the approaching
system stirs the air.

Elsewhere, the upper-level energy over the Southern Plains will move
eastward off the Southeast Coast by late Tuesday evening. As a result, the
energy will produce light rain over parts of the Southern Plains/Western
Gulf Coast through Wednesday. In addition, weak upper-level impulses and
onshore flow will produce light rain and embedded thunderstorms over parts
of Florida from Tuesday into Wednesday. Furthermore, cold high pressure
and upper-level energy will aid in keeping temperatures 10 to 20 degrees
below average over the Southern Plains into the Western/Central Gulf Coast
through Wednesday.
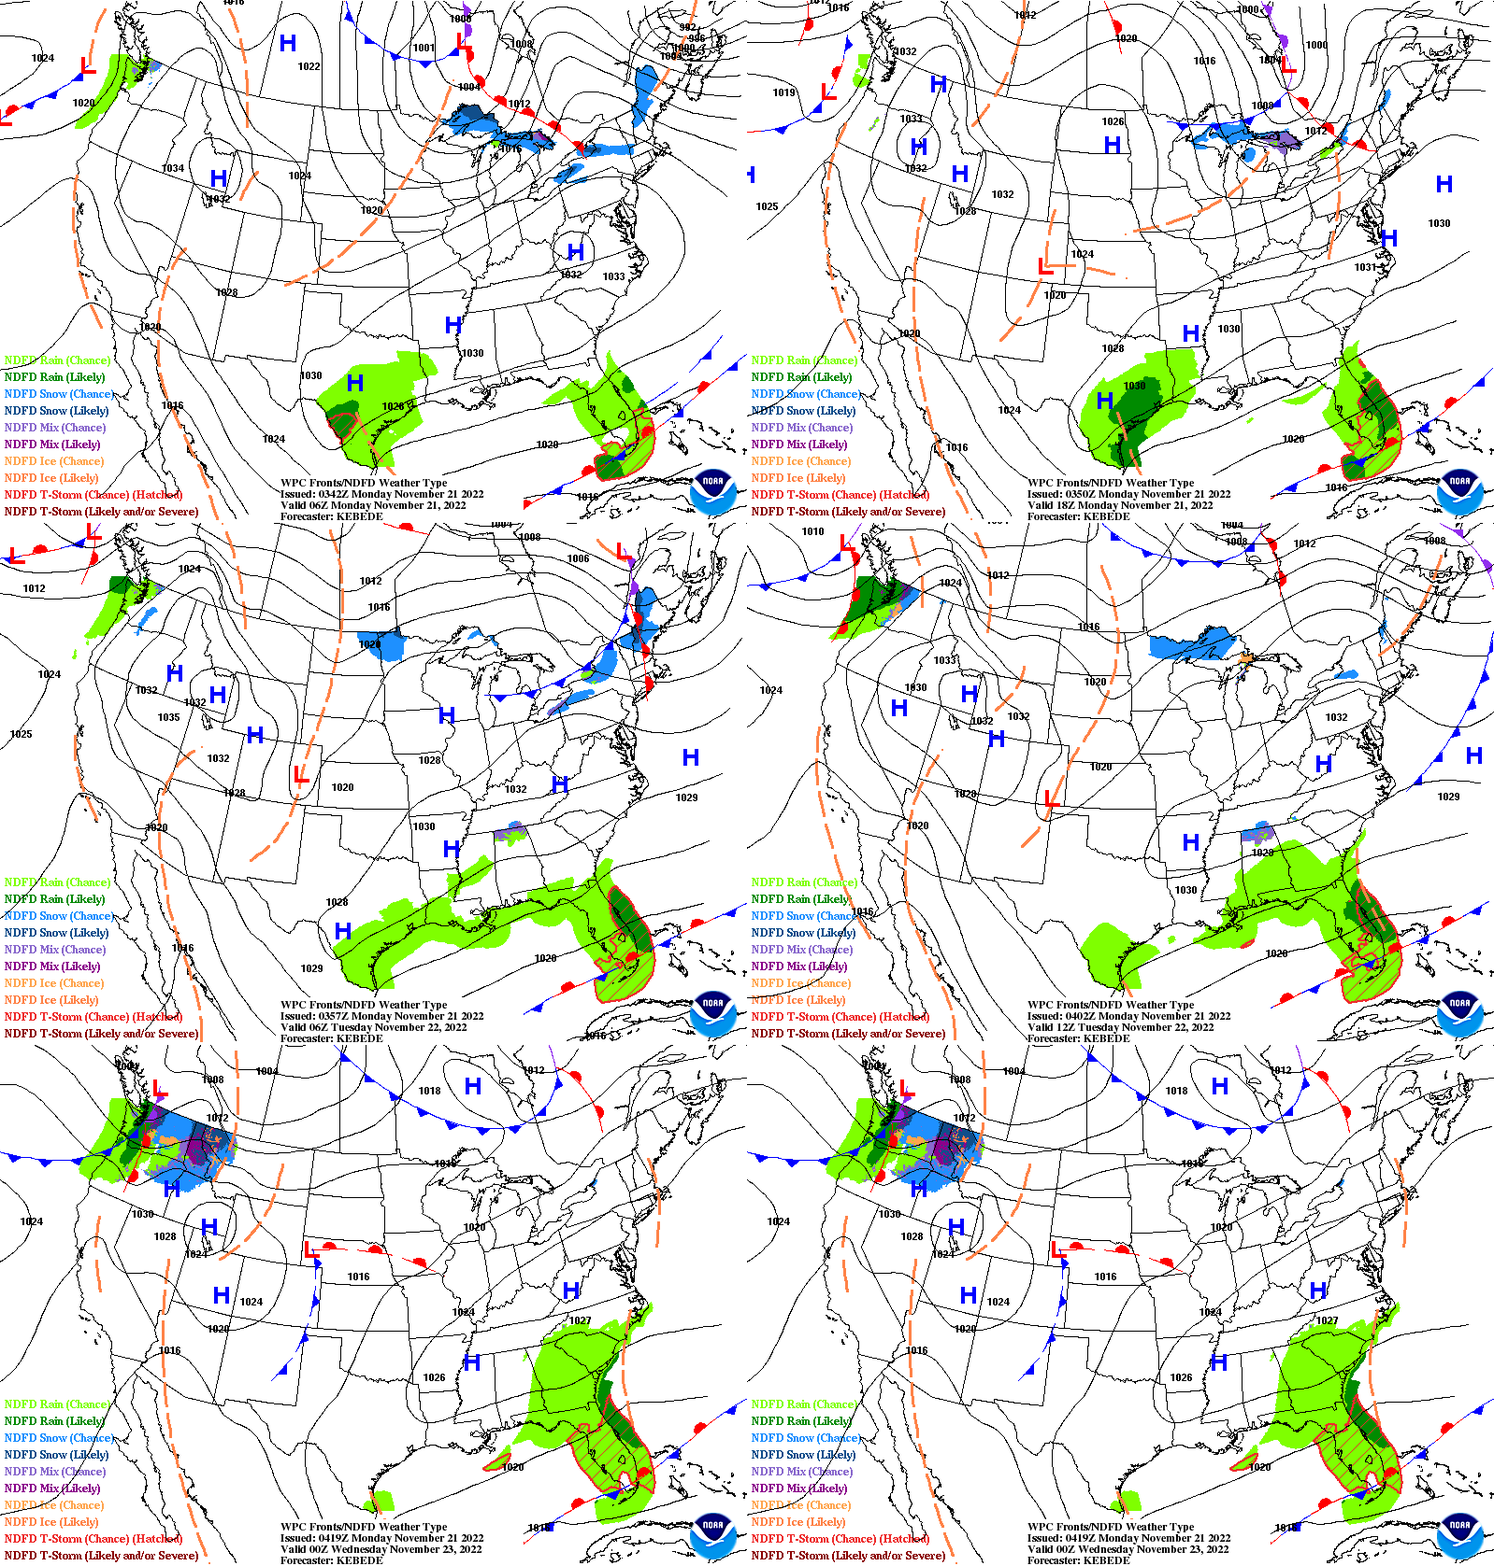
This animation shows how things may play out over the next 60 hours.
–
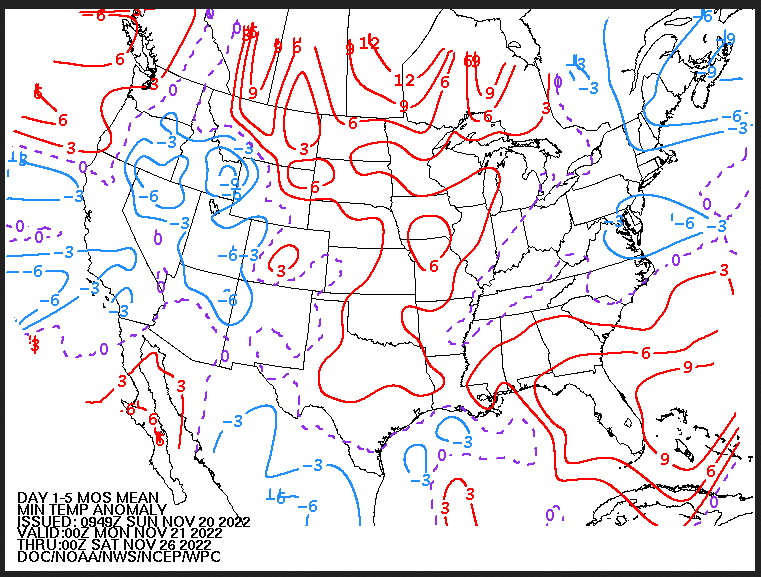
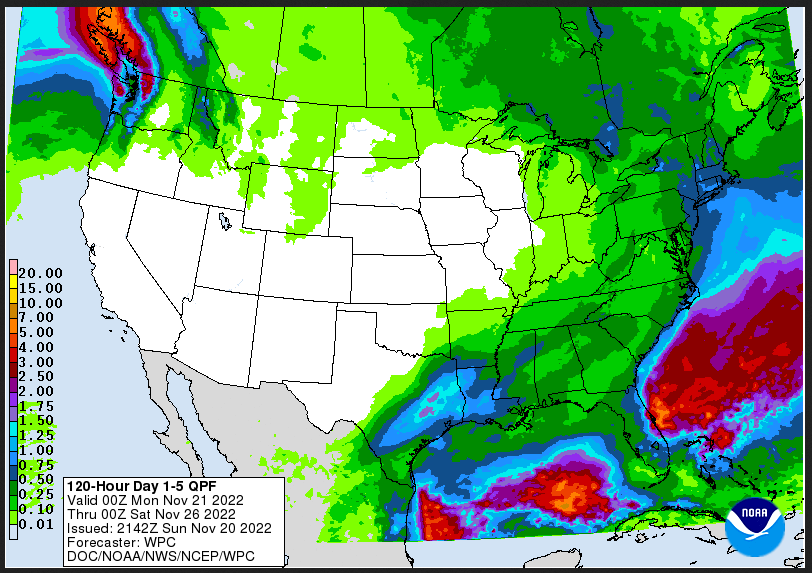
| Temperature (Maximum or Minimum Anomaly) for the next five days | Precipitation (Five days of cumulative precipitation) |
| https://www.wpc.ncep.noaa.gov/medr/me dr_mean.shtml | https://www.wpc.ncep.noaa.gov/qpf/day1-7.shtml |
| More areas are in the morning cooler than normal than warmer than normal; It is easy to see where it is expected to be wetter than normal and offshore of the Gulf Coast and Southeast is where it is extreme. |
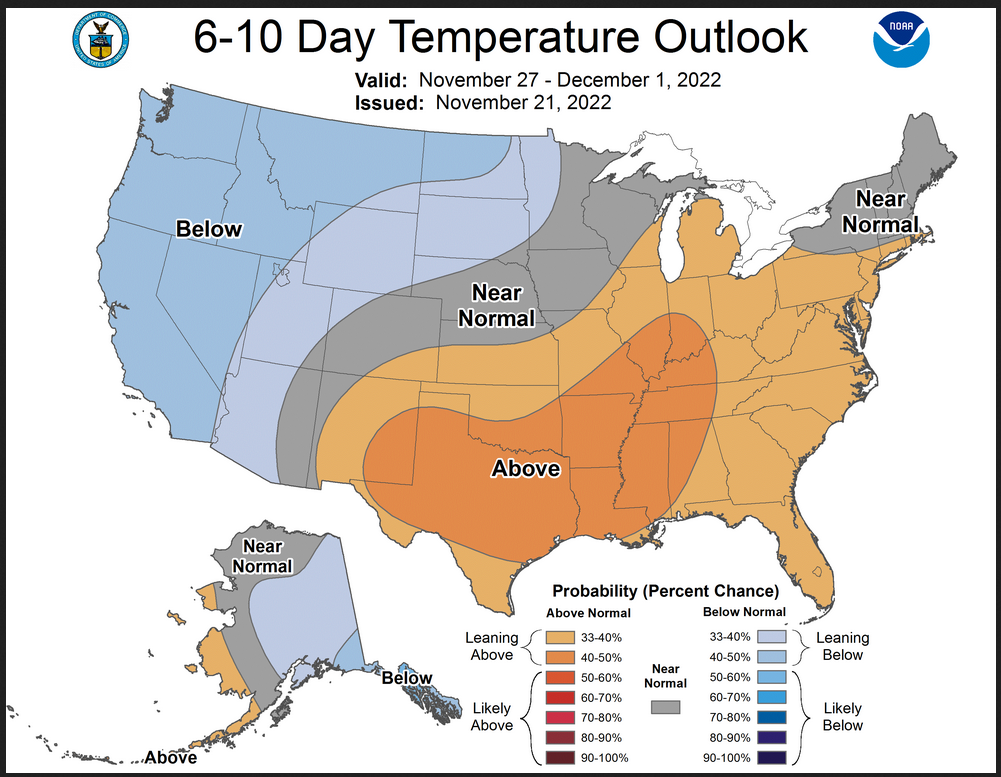
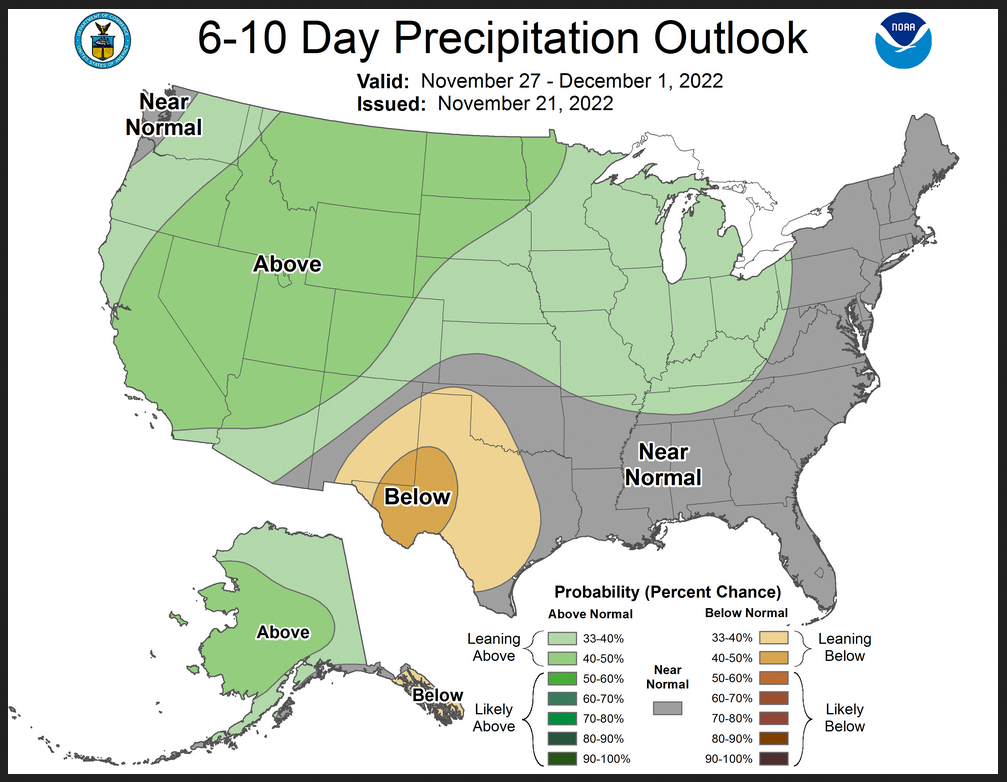
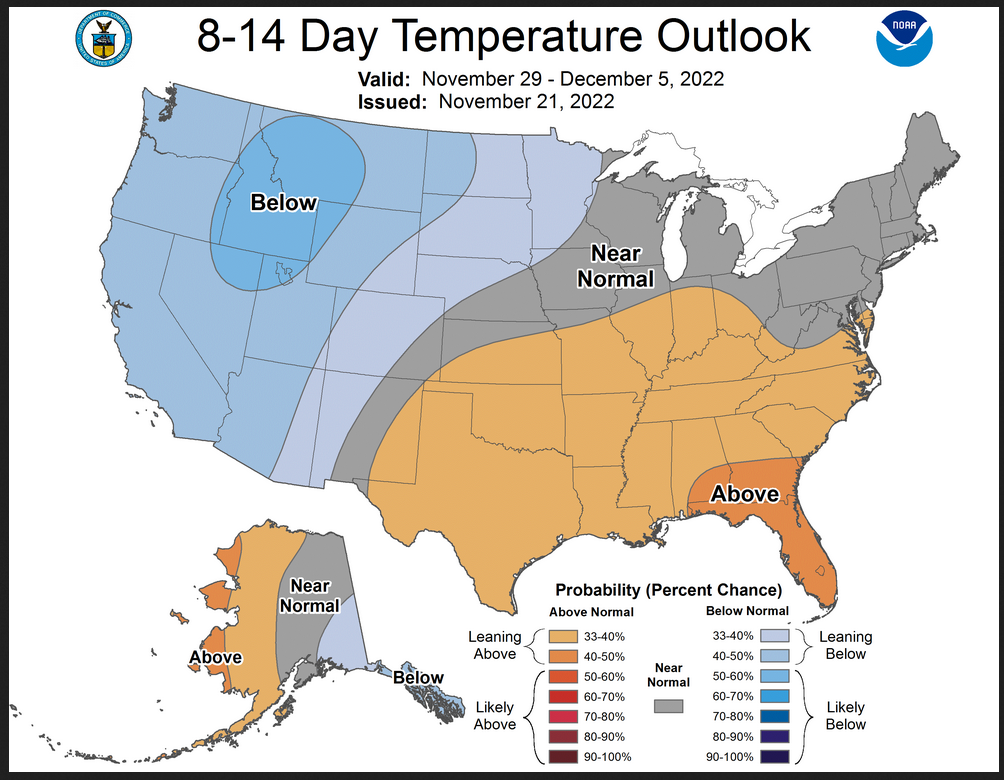
Now we look at Intermediate-Term “Outlook” maps for three time periods. Days 6 – 10, Days 8 – 14, and Weeks 3 and 4. An outlook differs from a forecast based on how NOAA uses these terms in that an “outlook” presents information as deviation from normal and the likelihood of these deviations.
I have provided the maps so you do not need to click to get them. But they do not update daily. But you can get the current images simply by clicking on the links provided. Then hit the return arrow at the upper left of your screen to return to the article. There is no need to do that right away since what is published today is up to date. The Week 3 – 4 Outlook only updates on Fridays.
Below are the links to obtain updates and additional information.
–
| Now working from the Monday maps which are very different than the Friday maps. Less area is cooler than normal but we get the dry areas back in a large area. |
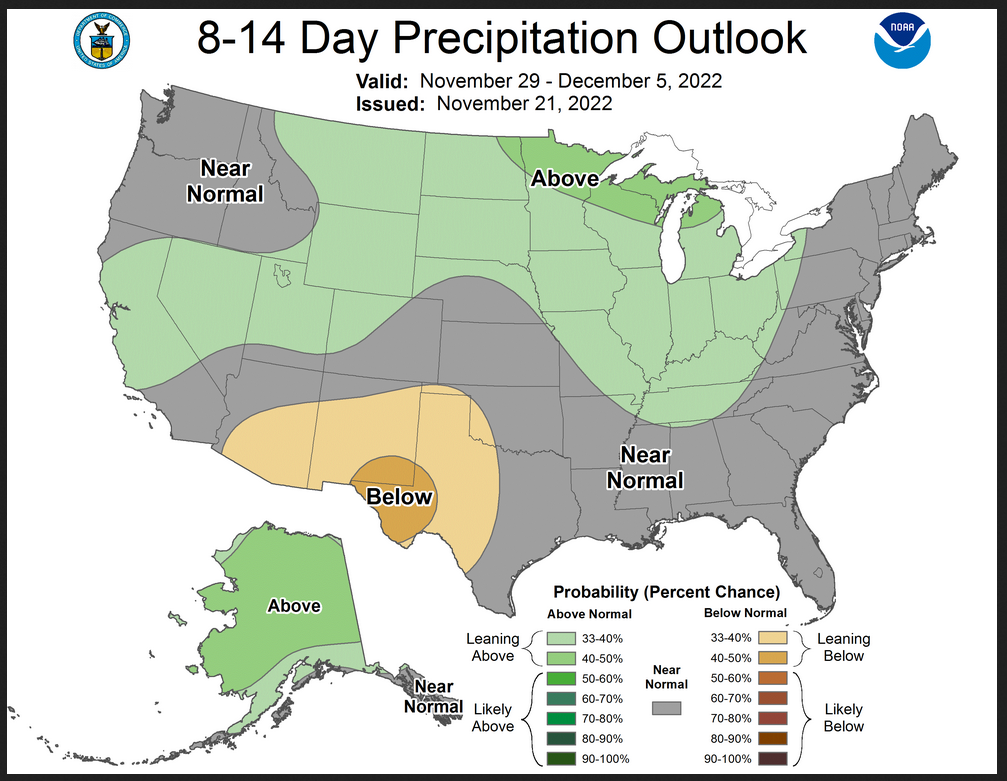
| Similar to Days 6 – 10 but the pattern moves to the east. |
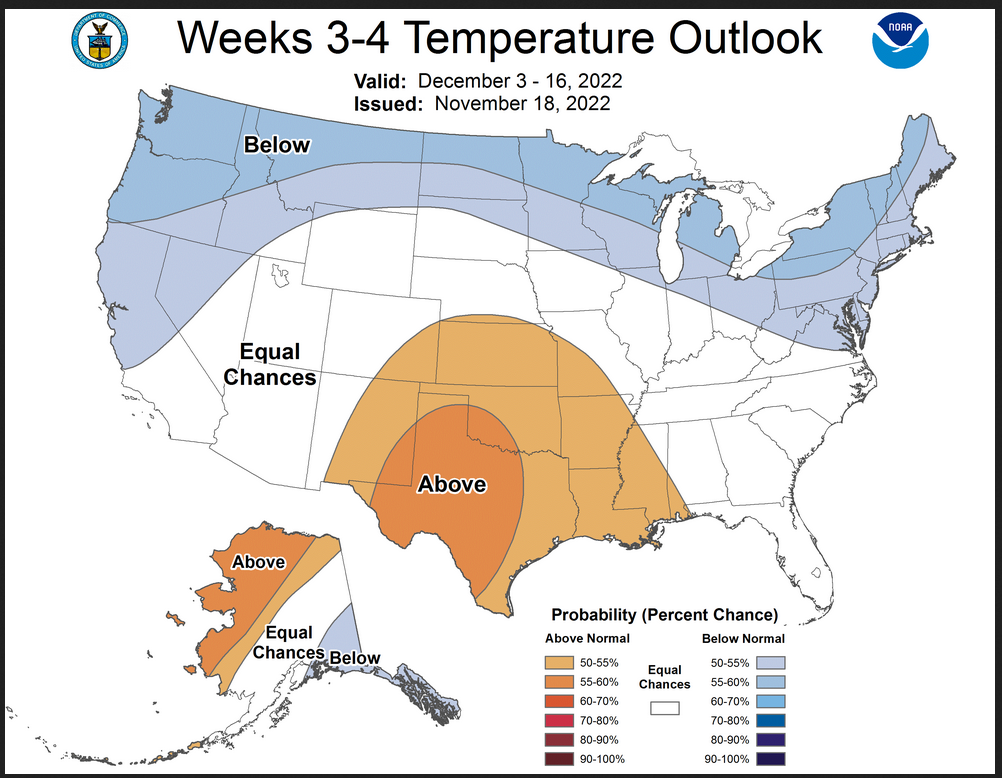
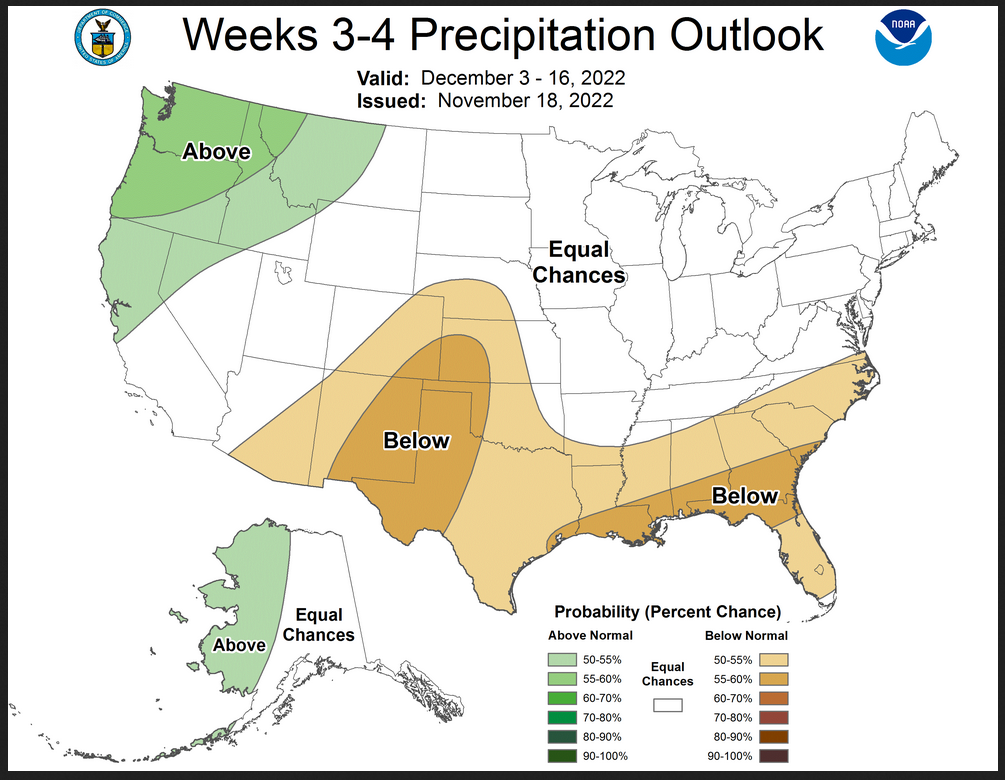
Now we address Weeks 3 and 4. This is a time frame that is very important. It is half of the 28-Day forecast period. That is why we include the discussion that accompanies the maps.
–
A shift occurs in Weeks 3 – 4 as described in the below discussion. The is more cool air intrusion along the Northern Tier. –Prognostic Discussion for Week 3-4 Temperature and Experimental Precipitation Outlooks
NWS Climate Prediction Center College Park MD
300PM EST Fri Nov 18 2022Week 3-4 Forecast Discussion Valid Sat Dec 03 2022-Fri Dec 16 2022
Over the equatorial Pacific, La Niña conditions persist, with below normal sea surface temperatures (SSTs) and reduced tropical convection in all Niño regions. In contrast, convection currently exists over the Maritime Continent associated with the emergence of the MJO into RMM phase 5. Both GEFS and ECMWF ensemble forecasts depict the propagation of the MJO through phases 5, 6 and 7 (Maritime Continent to the Western Pacific) over the next two weeks. After this time, the ensemble spread indicates a great deal of uncertainty as to either the continued propagation or the decay of the MJO. Regardless, the tropical convection associated with this active MJO during the two weeks leading up to Week 3-4 will produce upper-level divergence that resides in a favorable location to interact with the subtropical jet exiting southeast Asia. This interaction will produce a source for Rossby waves capable of propagating downstream and impacting surface conditions over CONUS/AK during the Week 3-4 period. Statistically, this sort of propagation is associated with troughing over AK and ridging over CONUS at short leads. However, at Week 3-4 leads the pattern typically reverses with ridging over AK and trouging over CONUS, reminiscent of a negative PNA pattern. Further downstream, a negative NAO is typically observed. Thus, a pattern shift that projects onto the negative phases of both the PNA and NAO is favored to occur near the end of Week 2 or beginning of Week 3. Whether this shift actually occurs and its exact timing are uncertain, which leads to overall low confidence probabilities throughout this Week 3-4 forecast.
Shifting to teleconnections that exist further north, the AO is expected to trend slightly negative to near neutral over the next two weeks. The polar stratosphere also appears to be in a quiescent state for the time being. However, at longer leads the ensemble mean 50-hPa heat flux anomaly is slightly positive, which will need monitoring for forecasts beyond this particular Week 3-4 period.
This Week 3-4 forecast is based on a blend of statistical model guidance that incorporates ENSO, the MJO, the long-term trend, and the PNA as predictors along with dynamical model output from the ECMWF, GEFS, CFS, ECCC, JMA, and SubX multi-model ensemble suites. More weight was given to the statistical models given: 1) their relative better performance than the dynamical models over recent forecasts and 2) the robust MJO forcing that is expected to occur in the context of ongoing La Niña background conditions. The multi-model ensemble forecast of 500-hPa heights from the dynamical models reveals strong ridging south of the Aleutians, consistent with La Niña. Further, they depict troughing over the West Coast, ridging over central CONUS, and ridging over the Labrador Sea and Greenland. The statistical models are similar to the dynamical guidance, except they depict more ridging over Alaska. Further, they show downstream troughing centered to the west of Hudson Bay with below normal heights stretching into the northern tier of CONUS.
For the temperature outlook, below normal temperatures are expected to occur over the West Coast, the Northern Plains, and the Great Lakes, as a result of the negative PNA conditions. Further east, below normal temperatures are expected in New England and the northern Mid-Atlantic due to expected negative NAO conditions that should force the trough southward into CONUS. Over Alaska, above normal temperatures are anticipated in the north and west due to the long term trend, while below normal temperatures are expected in the southeast and panhandle due to the negative PNA conditions. It should be noted that a great deal of uncertainty exists as to the extent and magnitude of any potential ridging that develops over Mainland Alaska and how this projects onto the PNA. Thus the air mass over CONUS may not be of Arctic/Siberian origin as with the current cold air outbreak, rather of Canadian origin and simply colder than normal. In the southern half of CONUS, where ridging is forecasted, above normal temperatures are anticipated in the Southern Plains. Elsewhere, Equal Chances(EC) of above or below normal temperatures are depicted due to the uncertainty of the exact centers of action of the -PNA and -NAO features. Finally, while relying heavily on the statistical guidance, it is encouraging to note that this forecast is overall very similar to the temperature patterns predicted by the dynamical models, particularly the ECMWF.
The precipitation outlook is largely persistent from last week’s forecast while also incorporating calibrated dynamical model guidance. Above normal precipitation is expected in the Pacific Northwest and Northern California as troughing in that region should lead to onshore flow and possible atmospheric river activity. Dry conditions are favored in the Southern Plains, New Mexico and the Southeast given their distant location from large-scale forcing in the form of troughing and active baroclinic zones. Equal chances are forecasted over the rest of CONUS. However, given the expected -NAO conditions, it is plausible that above normal precipitation can occur in the mid-Atlantic and New England from enhanced onshore easterly flow associated with any synoptic-scale storms that may develop. Finally, over Alaska, westerly flow provides slightly enhanced above normal precipitation probabilities over the western Mainland.
The multi-model ensemble from SubX shows above normal temperature probabilities throughout Hawaii of over 80%, which corresponds to the above normal SSTs surrounding the islands. Above normal precipitation also appears likely according to SubX, particularly in the southeastern islands.
| It is important to note that the Week 3 -4 Outlook is prepared by a different team than the 6 -10 and 8 – 14 day Outlooks as well as the update of the monthly outlook. |
Month to Date Information
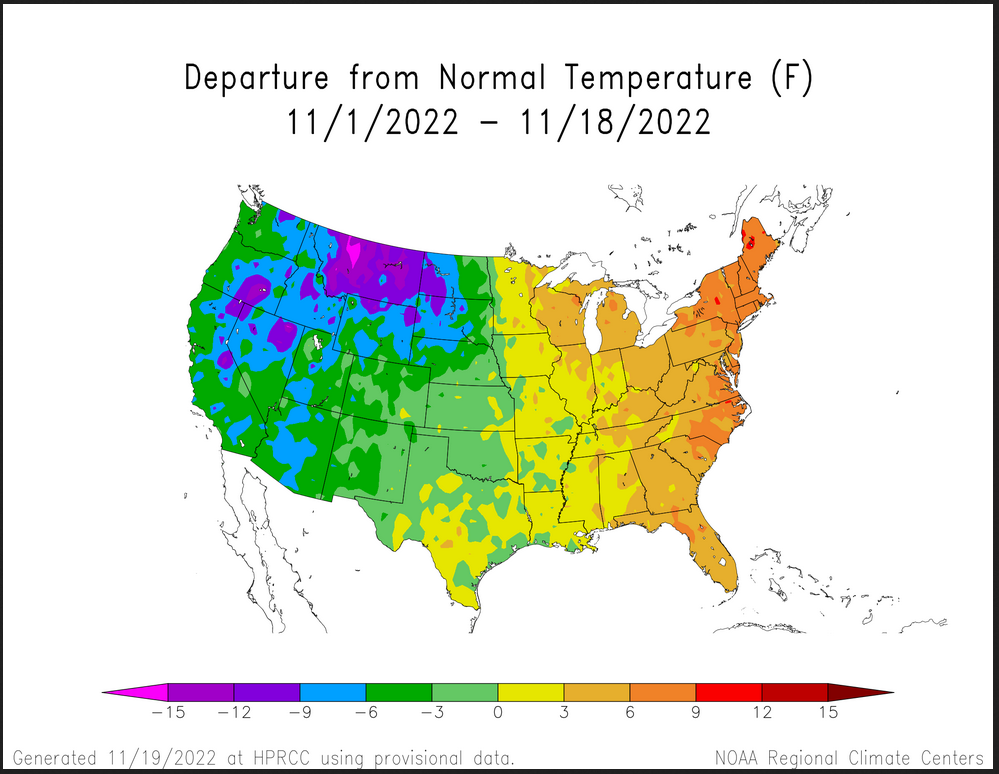
Temperature month to date can be found at https://hprcc.unl.edu/products/maps/acis/MonthTDeptUS.png
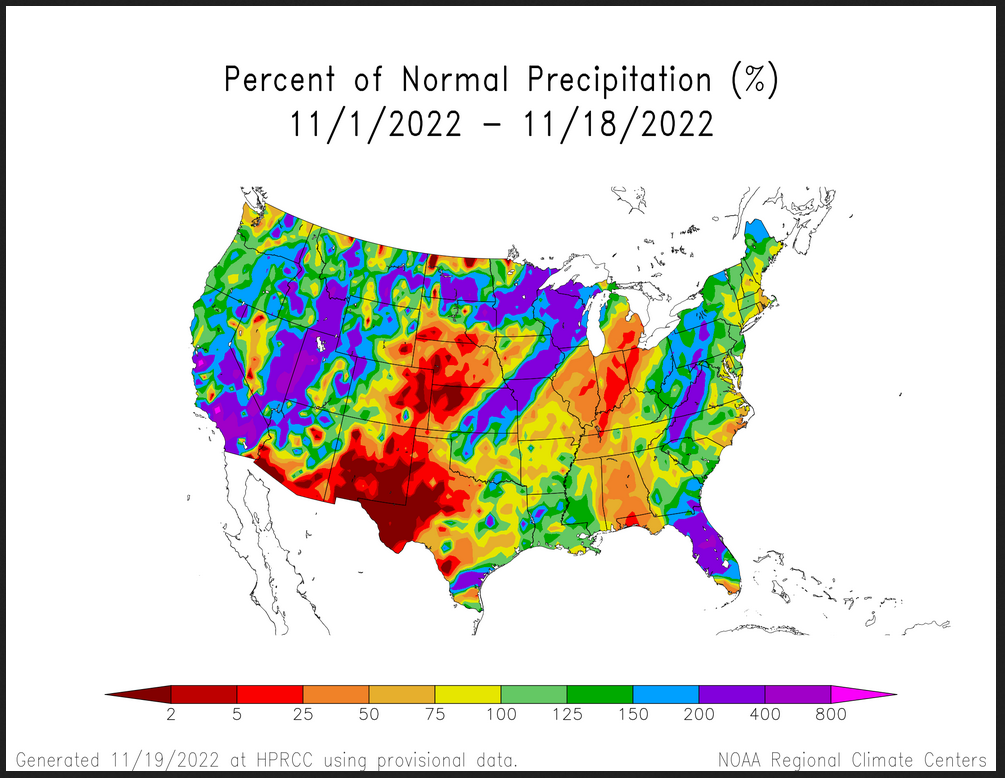
Precipitation month to date can be found at https://hprcc.unl.edu/products/maps/acis/MonthPNormUS.png
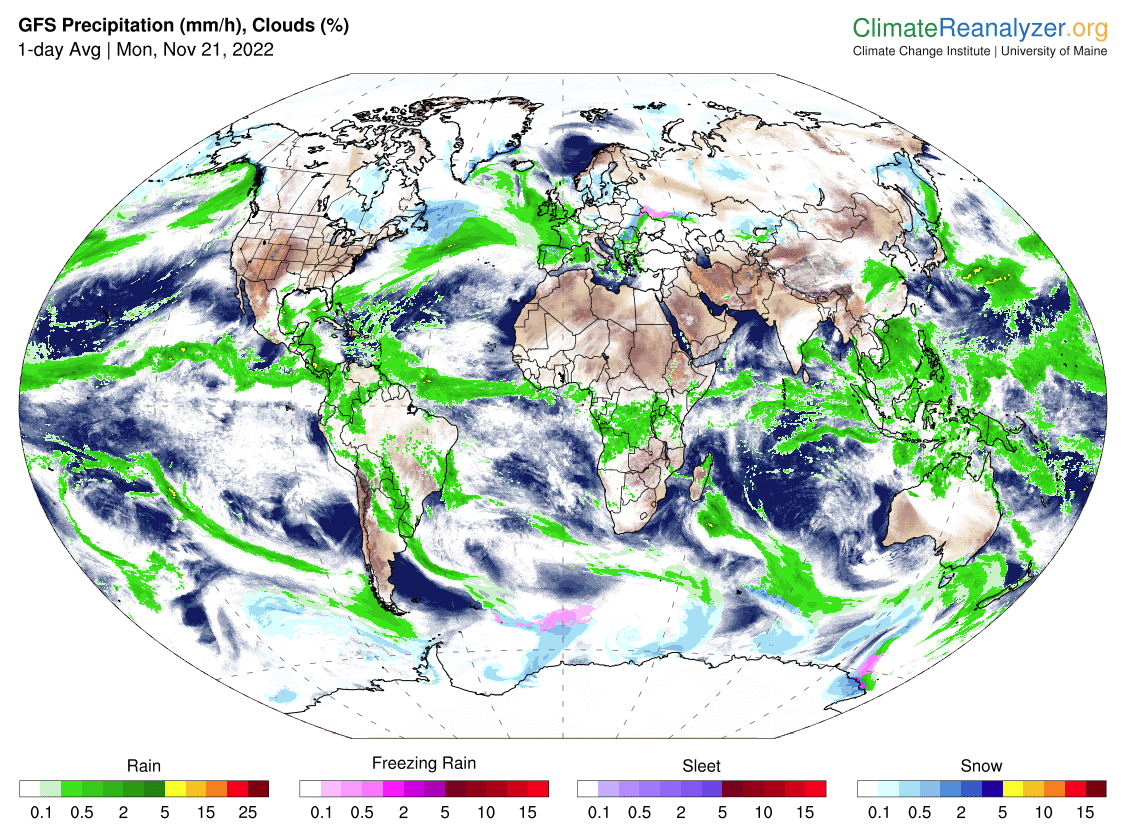
World Forecast
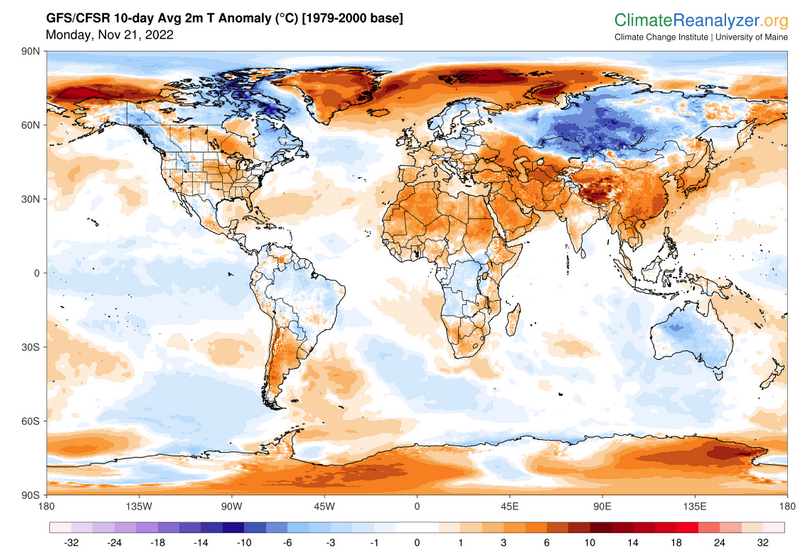
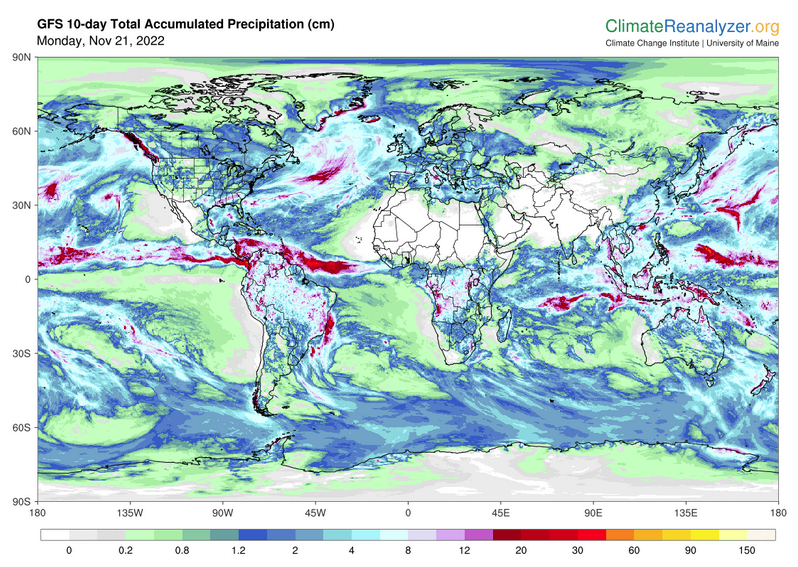
Below are the current precipitation forecast and the 10-Day forecasts for temperature and precipitation. Updates and additional information can be obtained HERE. Much of this information is provided by the University of Maine. They draw upon many different sources.
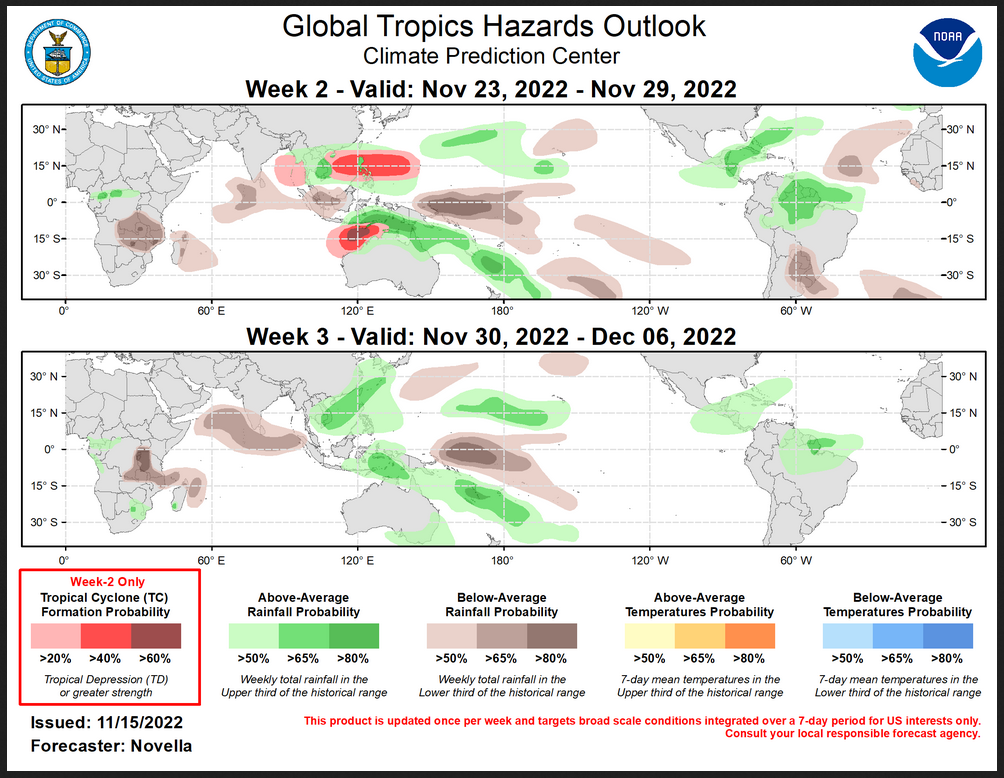
Worldwide Tropical Forecast (This is a NOAA Product)
(This graphic updates on Tuesdays) If it has not been updated, you can get the update by clicking here
