Here is what we are paying attention to this evening and the next 48 hours from this evening’s NWS Forecast.
...Mixed precipitation expected for inland areas in the Northeast and
Mid-Atlantic this afternoon into Wednesday morning...

...Heavy Lake Effect Snow in the Great Lakes region Wednesday and
Thursday, especially downwind of Lake Erie and Lake Ontario...

...Strong Santa Ana winds return today across Southern California...

...Anomalous cold will continue for most of the CONUS through the end of
the week...
Continuation of the NWS Short Range Forecast (It is updated twice a day and these updates can be found here.
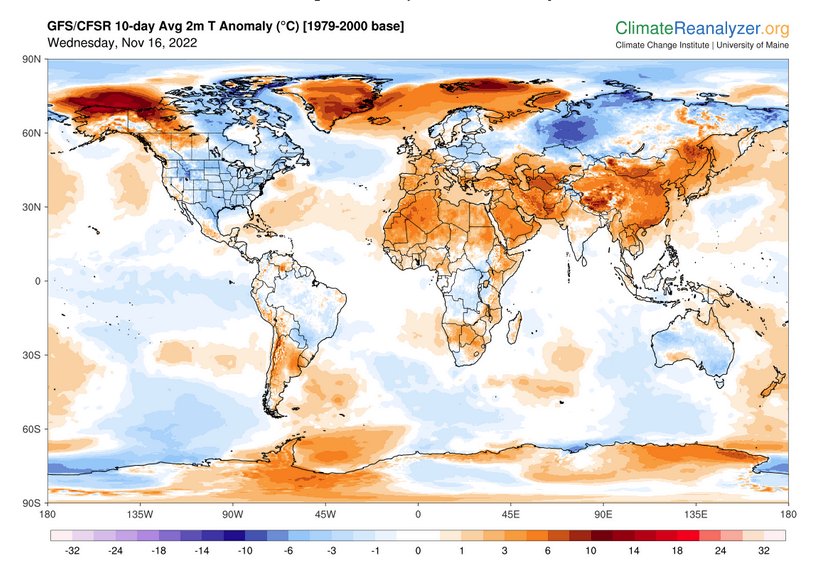
A deep upper level trough is currently swinging towards the eastern U.S.
while a wave of energy rounds the base of the trough and slingshots
towards the Northeast. This wave will allow a coastal low pressure system
to quickly strengthen and push across the Mid-Atlantic and Northeast
tonight through Wednesday. Widespread precipitation is expected to
develop, falling as rain near the coast and a mixture of snow, sleet, and
freezing rain for inland areas. A swath of Winter Weather Advisories have
been issued from the central Appalachians through Maine, and higher
elevations will likely see significant accumulations of wintry
precipitation. Heavy snow is expected across northern Maine on Wednesday,
and Winter Storm Warnings are in effect for this area.

The low pressure system will lift northeast into the Canadian Maritimes
late Wednesday into Thursday, and cold west-northwesterly flow on the
backside of the system will cause lake effect snow to develop in the Great
Lakes region. Heavy lake effect snow is expected Wednesday and Thursday
with significant snow accumulations possible, especially downstream of
Lake Erie and Lake Ontario. Winter Storm Watches are in effect for these
areas. Total snowfall accumulations will be highly dependent on where snow
bands develop and could shift significantly with changes in wind
direction. A cold front will approach the region late Thursday into Friday
and southwesterly flow ahead of the front will help to decrease snowfall
amounts by pushing snow bands offshore over the lakes, but periods of lake
effect snow will remain possible each day through the end of the week.

Out West, mostly dry weather is expected through the end of the work week
as high pressure builds across the region. Strong Santa Ana winds will
return to southern California today and persist through the end of the
week. High Wind Warnings and Wind Advisories are in effect through
Wednesday for portions of southern California where 40-60 mph wind gusts
are likely.

Anomalously cold air has surged across the CONUS and will likely stick
around through at least the end of this week. Temperatures are forecast to
be 10-20 degrees below normal for most of the nation with some locations
experiencing temperatures as low as 25 degrees below normal. The coldest
temperature anomalies will likely be in the Central U.S. behind a cold
front that will move south on Thursday. High temperatures below freezing
will be common across the region Thursday and Friday.
Current forecast of heavy precipitation (Updates can be found HERE)
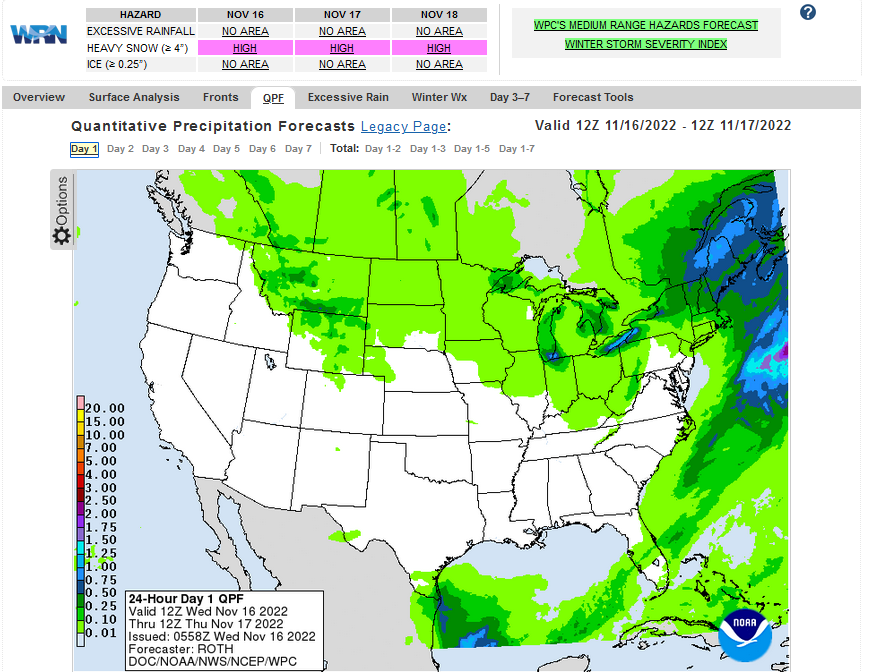
Maps that relate the forecast to geography can be found by clicking Here for Day 1 and Here for Day 2.
Here is a 60-hour animated forecast map that shows how the short-term forecast is expected to play out
If it needs to be updated click here.
ATMOSPHERIC RIVERS
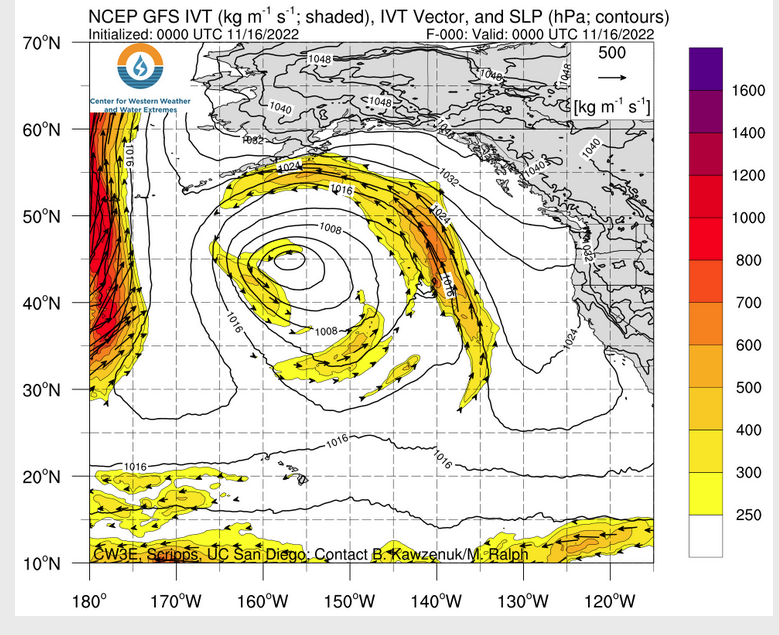
Click HERE to update. Here is some useful information about Atmospheric Rivers.
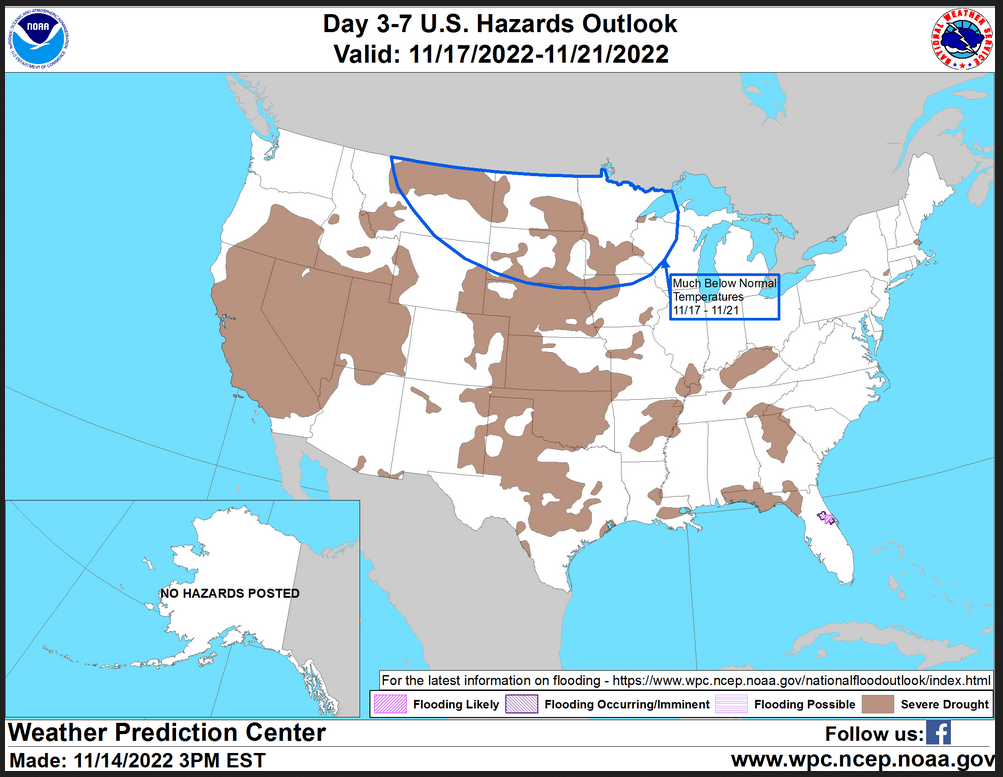
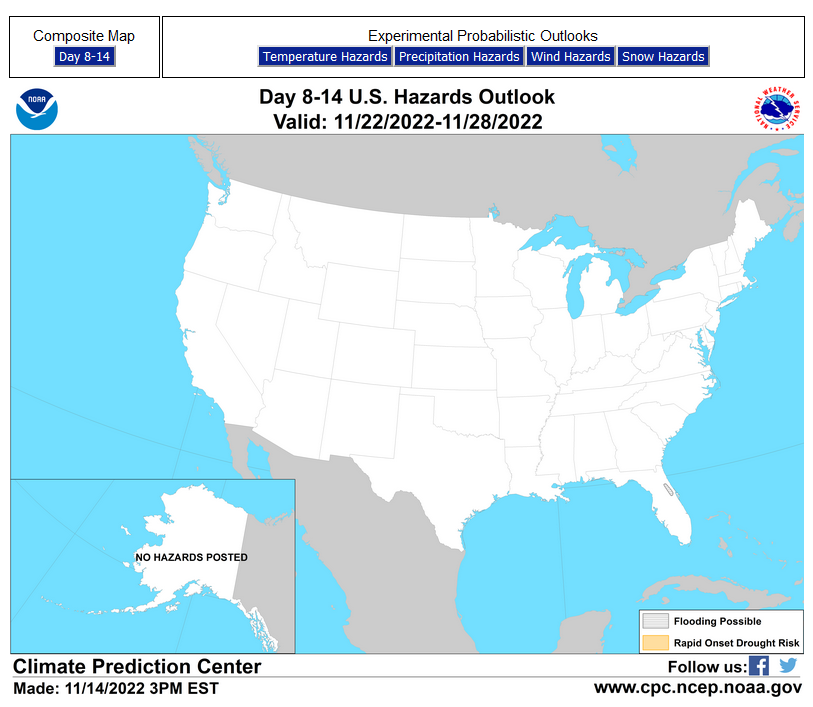
HAZARDS OUTLOOKS
Click here for the latest complete Day 3 -7 Hazards forecast which updates only on weekdays. Once a week probably Monday or Tuesday I will update the images. I provided the link for readers to get daily updates on weekdays. Use your own judgment to decide if you need to update these images.
Worldwide Tropical Forecast
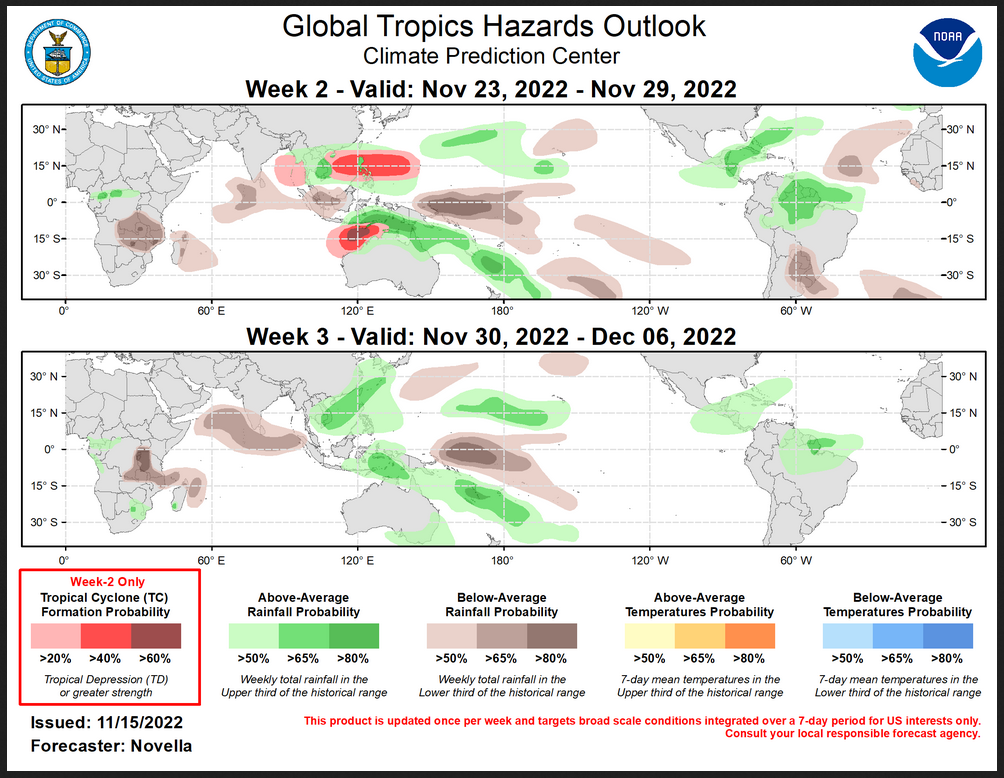
(This graphic updates on Tuesdays) If it has not been updated, you can get the update by clicking here This is a new approach and covers weeks 2 and 3 not weeks 1 and 2. It has more information but I am having trouble getting used to it. As usual, it comes with a discussion which is below
Detailed Maps and Reports for the Western Atlantic and the Pacific Oceans
Below are four maps that summarize the situation for the Atlantic, Eastern, Central Pacific, and Western Pacific. Additional information can be accessed by clicking HERE
First the Atlantic
Click to view the forecast map and have access to additional information https://www.nhc .noaa.gov/gtwo.php?basin= atlc&fdays=5
Then Eastern Pacific
Click to view the forecast map and have access to additional information https://www.nhc.noaa.gov/gtwo.php?basin=epac&fdays=5
Then Central Pacific
Click to view the forecast map and have access to additional information https://www.nhc.noaa.gov/gtwo.php?basin=cpac&fdays=5
And the Western Pacific
Click to view the forecast map and have access to additional information https://www.metoc.navy.mil/jtwc/jtwc.html
Some Intermediate-Term Outlooks
Links to “Outlook” maps and discussions for three time periods. Days 6 – 10, Days 8 – 14, and Weeks 3 and 4. An outlook differs from a forecast based on how NOAA uses these terms in that an “outlook” presents information from deviation from normal and the likelihood of these deviations.
You have to click on the links because they do not update automatically and I do not want to have stale images in the article. But it is not difficult to click on a link and you get a large image plus a discussion. On Fridays in a separate article, we will show the images and provide a link in this article that article. But remember what you will see is the images as of Friday. But here you can get the current images simply by clicking on them. Then hit the return arrow at the upper left of your screen to return to the article. You will not find this information easily anywhere else.

Right now you can find these maps here (We show them every Friday there but you can click above and find them).
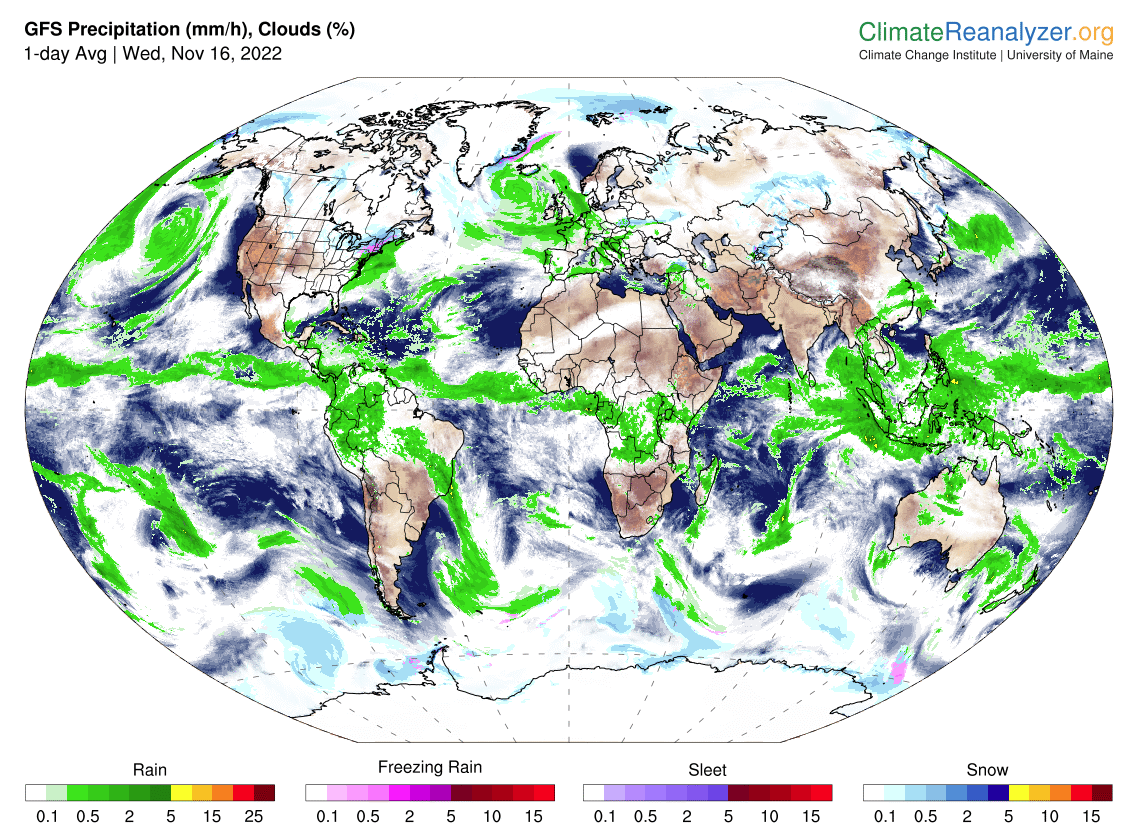
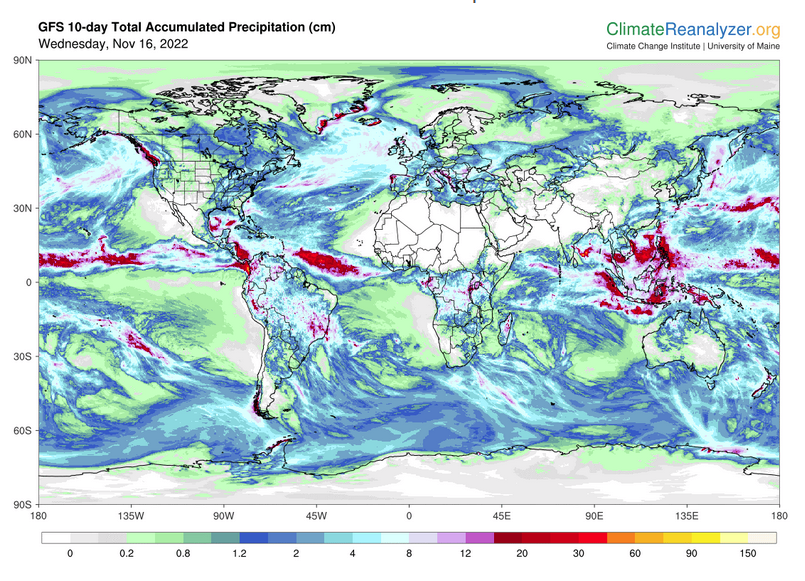
Worldwide Weather
Below is the current or short-term precipitation forecast which can be updated by clicking HERE Additional maps can be obtained HE RE.
Month to Date Information
Month to date Temperature can be found at https://hprcc.unl.edu/products/maps/acis/MonthTDeptUS.png
Month to date Precipitation can be found at https://hprcc.unl.edu/products/maps/acis/MonthPNormUS.png
