Here is what we are paying attention to this evening and the next 48 hours from this evening’s NWS Forecast.
...Heavy snow today along the Cascades, Sierra Nevada, and portions of the
northern Rockies...

...Heavy mountain snow moving into the central Rockies on Thursday into
early Friday...

...Showers and severe thunderstorms possible ahead of and along cold front
tomorrow into Friday for southern Plains...

...Record high temperatures today across northern Plains and Midwest; fire
weather possible due to dry and breezy conditions

...Atmospheric River will dump rain and elevated snow to parts of Pacific
Northwest through Friday evening...
Continuation of the NWS Short Range Forecast (It is updated twice a day and these updates can be found here.
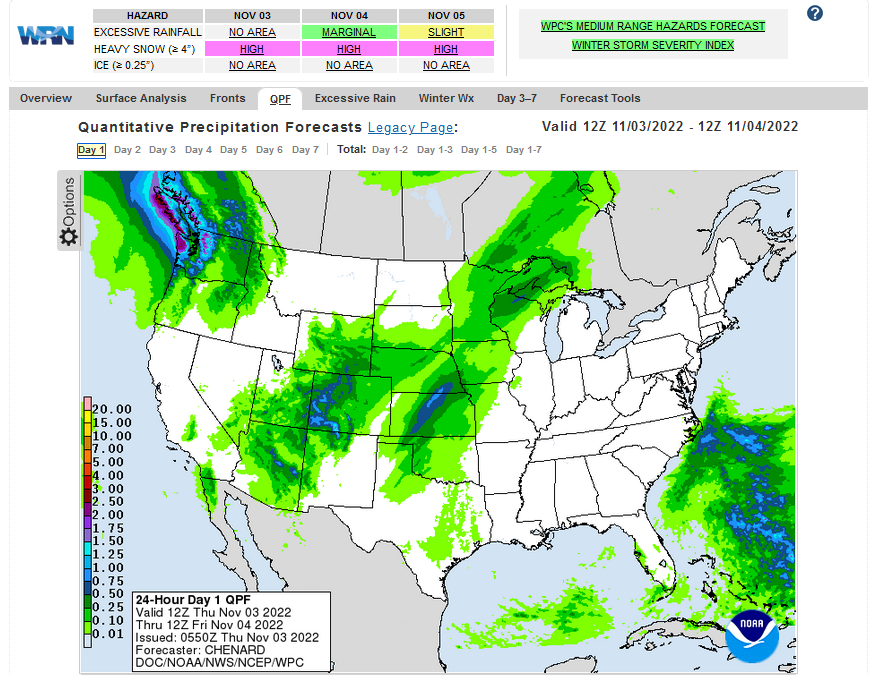
An active end to the work week is in store for much of the country as an
amplifying upper-level trough swings eastward, ushering in multitudinous
weather hazards for areas west of the Mississippi River. In the wake of a
potent, eastward-progressing cold front, significantly colder air will
infiltrate the western United States this evening, contributing to a bout
of heavy snow across higher elevations. As colder air and strong, gusty
winds move further inland, this system will aid in lowering snow levels
across the Cascade and Sierra Nevada ranges through tonight. By tomorrow,
the mountain snows will shift eastward into the central and northern
Rockies, with heavy snowfall most likely occurring at higher elevations in
the central Rockies, which will lead to decreased visibility and hazardous
driving conditions. Conditions will improve late Thursday night as the
system moves eastward into the Plains, leading to a pleasant, albeit cold,
Friday for central and western portions of the Intermountain West.

As the strong storm system moves east into the central and southern Plains
on Thursday, hazardous weather will occur along and ahead of the
progressing cold front and developing dry line as warm, moist air surging
northward from the Gulf clashes with the cooler, drier air. As a result,
showers and potentially severe thunderstorms will erupt tomorrow across
Texas and the central Plains before the threat shifts further east on
Friday into eastern Texas and Oklahoma. As a result, the Storm Prediction
Center has placed portions of the region under a Slight Risk for Severe
Thunderstorms on Thursday, and an Enhanced Risk Friday, due to the
potential for damaging winds, hail, and isolated tornadoes. In addition to
the severe threat, anomalously moist air in conjunction with developing
showers and thunderstorms along the cold front may lead to heavy rainfall
rates and isolated instances of flash flooding across the Mississippi
Valley and central Plains on Friday. Therefore, a Slight Risk of Excessive
Rainfall has been issued for the Ark-La-Tex region.

Ahead of the cold front, warmer-than-average temperatures will persist
across the eastern two-thirds of the country under the influence of an
expansive high-pressure system centered over the Northeast. Widespread
record high temperatures are forecast today across the northern Plains and
Midwest, with temperatures in the mid-to-upper 70s (15-25 degrees above
average) due to a dry, southerly flow. The dry and breezy conditions will
also promote fire danger across the northern and central High Plains
today, with Red Flag Warnings issued for much of the region.

Meanwhile, the next moisture surge from the Pacific is forecast to reach
the Pacific Northwest later on Thursday, with mountain snow and
lower-elevation rain rapidly overspreading the area. Rainfall amounts of
2-6" are possible across the region, which, in unison with the recent
rainfall, may lead to isolated instances of flash flooding, especially in
areas with elevation. In contrast, mild and pleasant autumn weather is
forecast for the eastern U.S. under the expansive high-pressure system.
Current forecast of heavy precipitation (Updates can be found HERE)
Maps that relate the forecast to geography can be found by clicking Here for Day 1 and Here for Day 2.
Here is a 60-hour animated forecast map that shows how the short-term forecast is expected to play out
If it needs to be updated click here.
ATMOSPHERIC RIVERS
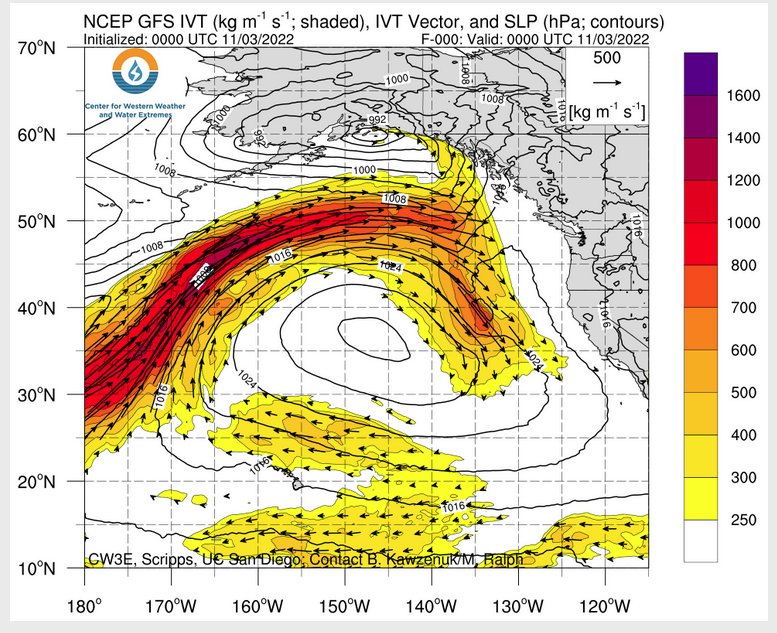
Click HERE to update. Here is some useful information about Atmospheric Rivers.
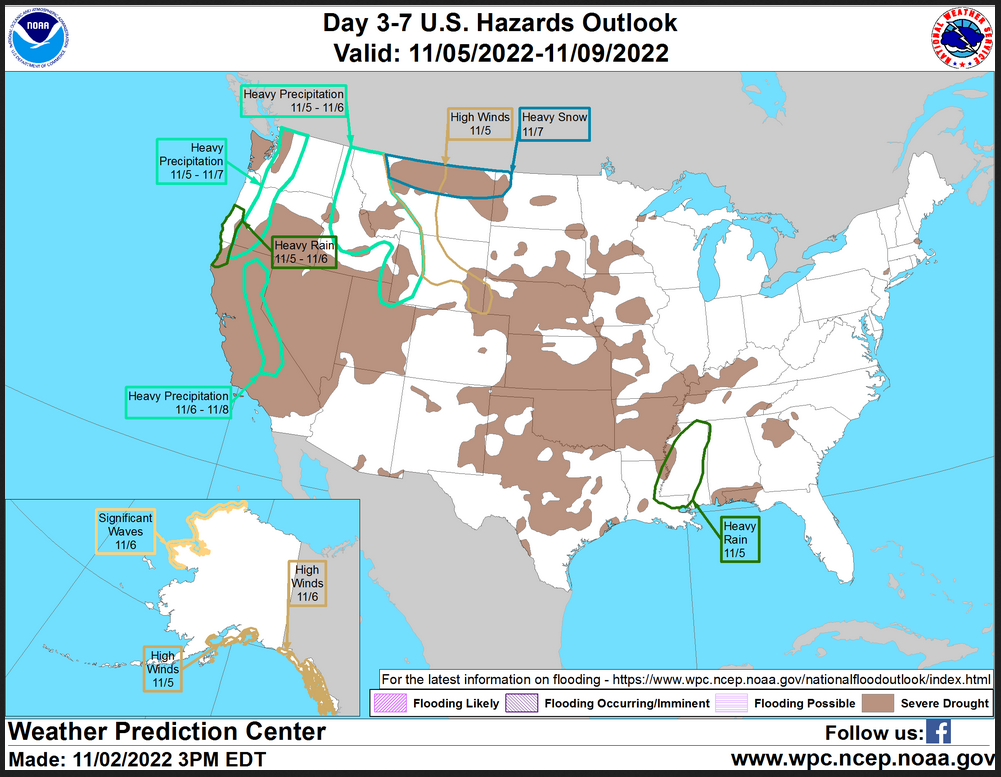
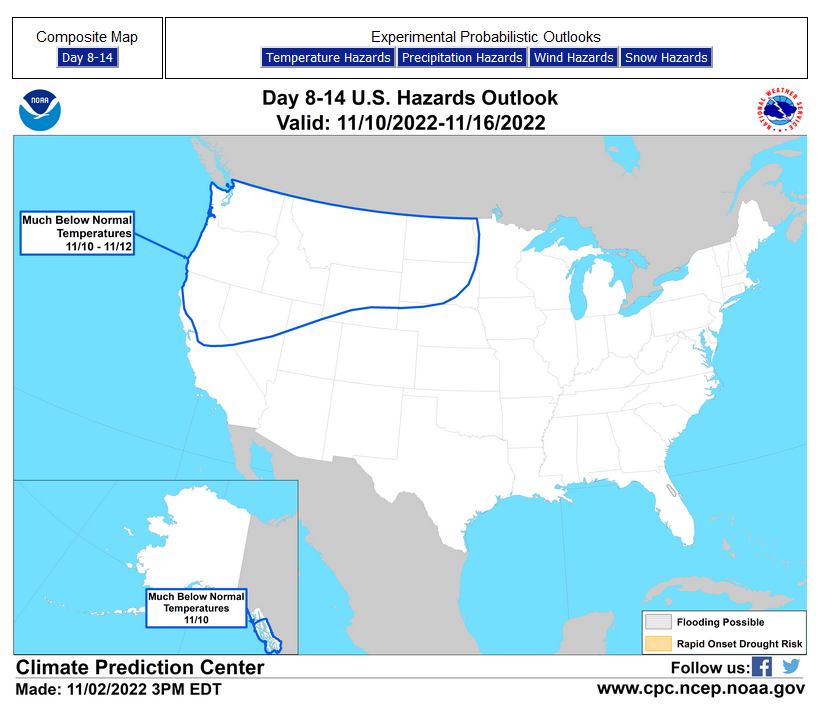
HAZARDS OUTLOOKS
Click here for the latest complete Day 3 -7 Hazards forecast which updates only on weekdays. Once a week probably Monday or Tuesday I will update the images. I provided the link for readers to get daily updates on weekdays. Use your own judgment to decide if you need to update these images.
Worldwide Tropical Forecast
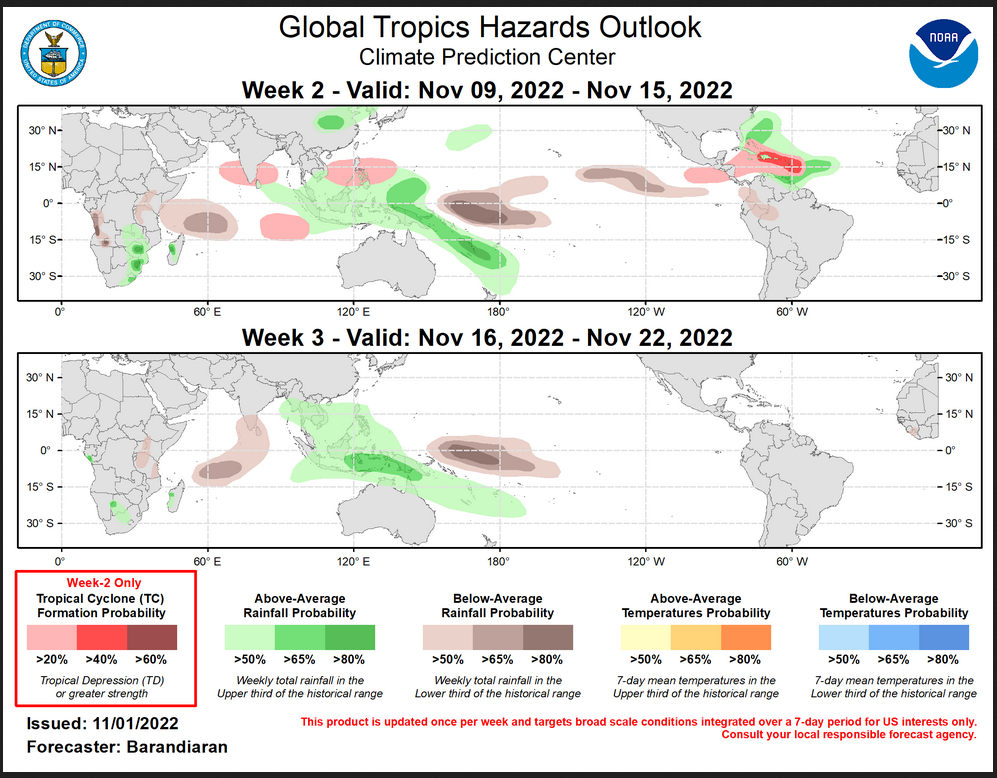
(This graphic updates on Tuesdays) If it has not been updated, you can get the update by clicking here This is a new approach and covers weeks 2 and 3 not weeks 1 and 2. It has more information but I am having trouble getting used to it. As usual, it comes with a discussion which is below
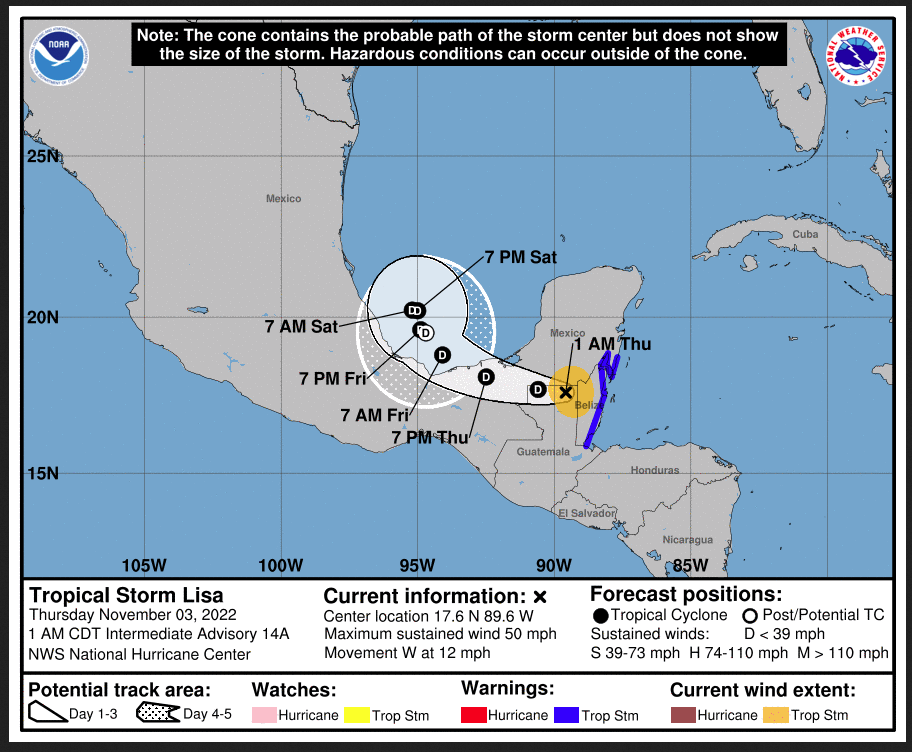
Detailed Maps and Reports for the Western Atlantic and the Pacific Oceans
Below are four maps that summarize the situation for the Atlantic, Eastern, Central Pacific, and Western Pacific. Additional information can be accessed by clicking HERE
First the Atlantic
Click to view the forecast map and have access to additional information https://www.nhc .noaa.gov/gtwo.php?basin= atlc&fdays=5
Then Eastern Pacific
Click to view the forecast map and have access to additional information https://www.nhc.noaa.gov/gtwo.php?basin=epac&fdays=5
Then Central Pacific
Click to view the forecast map and have access to additional information https://www.nhc.noaa.gov/gtwo.php?basin=cpac&fdays=5
And the Western Pacific
Click to view the forecast map and have access to additional information https://www.metoc.navy.mil/jtwc/jtwc.html
Some Intermediate-Term Outlooks
Links to “Outlook” maps and discussions for three time periods. Days 6 – 10, Days 8 – 14, and Weeks 3 and 4. An outlook differs from a forecast based on how NOAA uses these terms in that an “outlook” presents information from deviation from normal and the likelihood of these deviations.
You have to click on the links because they do not update automatically and I do not want to have stale images in the article. But it is not difficult to click on a link and you get a large image plus a discussion. On Fridays in a separate article, we will show the images and provide a link in this article that article. But remember what you will see is the images as of Friday. But here you can get the current images simply by clicking on them. Then hit the return arrow at the upper left of your screen to return to the article. You will not find this information easily anywhere else.

Right now you can find these maps here (We show them every Friday there but you can click above and find them).
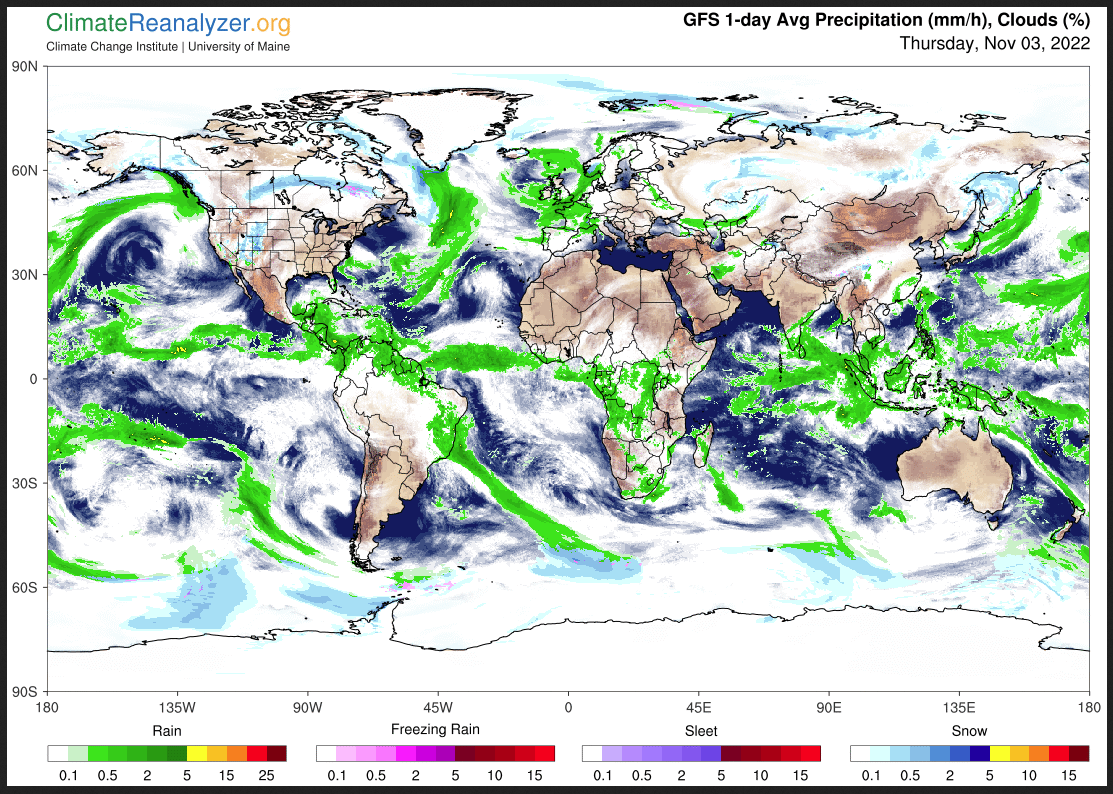
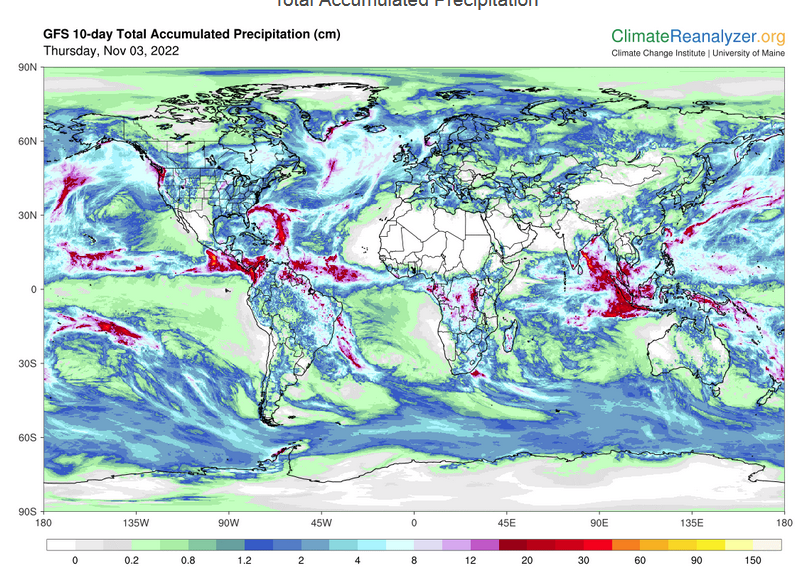
Worldwide Weather
Below is the current or short-term precipitation forecast which can be updated by clicking HERE Additional maps can be obtained HERE.
Month to Date Information
Month to date Temperature can be found at https://hprcc.unl.edu/products/maps/acis/MonthTDeptUS.png
Month to date Precipitation can be found at https://hprcc.unl.edu/products/maps/acis/MonthPNormUS.png