Drought and Heat Shift to the East
At the end of every month, NOAA updates its Outlook for the following month which in this case is November. They also issue a Drought Outlook for the following month. We are reporting on that this morning.
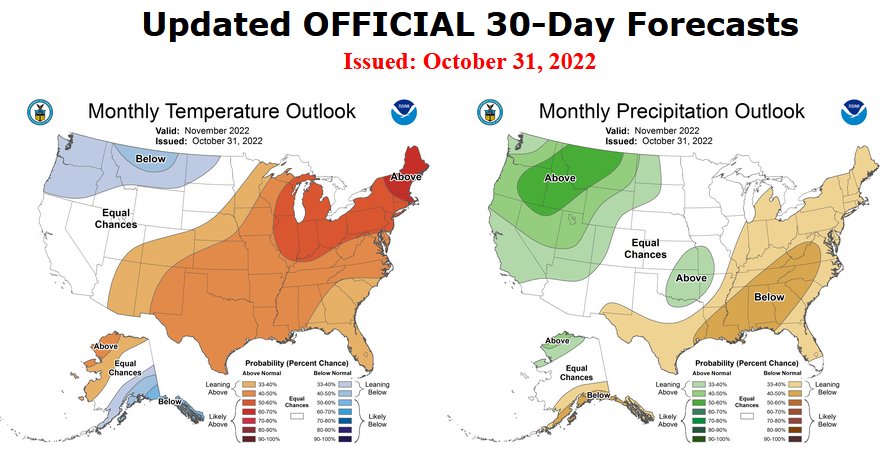
There have been some significant changes in the Outlook for November and these are addressed in the NOAA Discussion so it is well worth reading. We highlighted some of the important changes within the NOAA Discussion.
Of significant interest is the Drought Outlook for November. There will be some improvement in the Great Plains but it will be dry to the east inducing drought conditions.
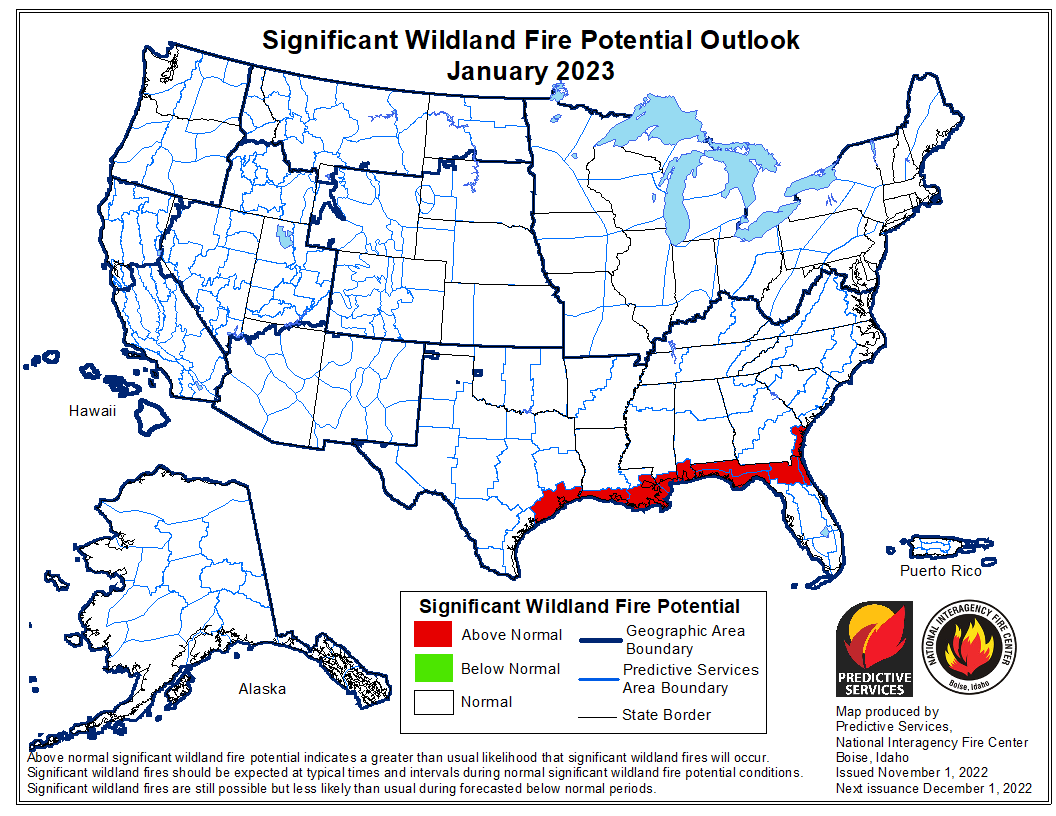
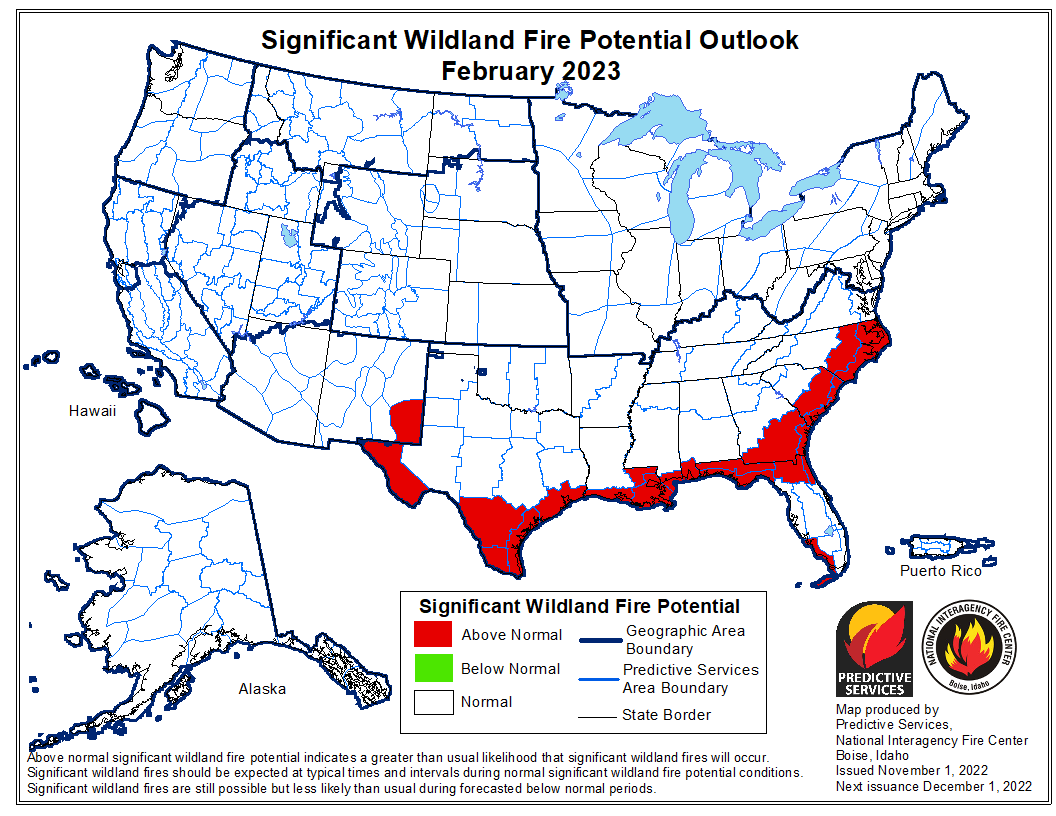
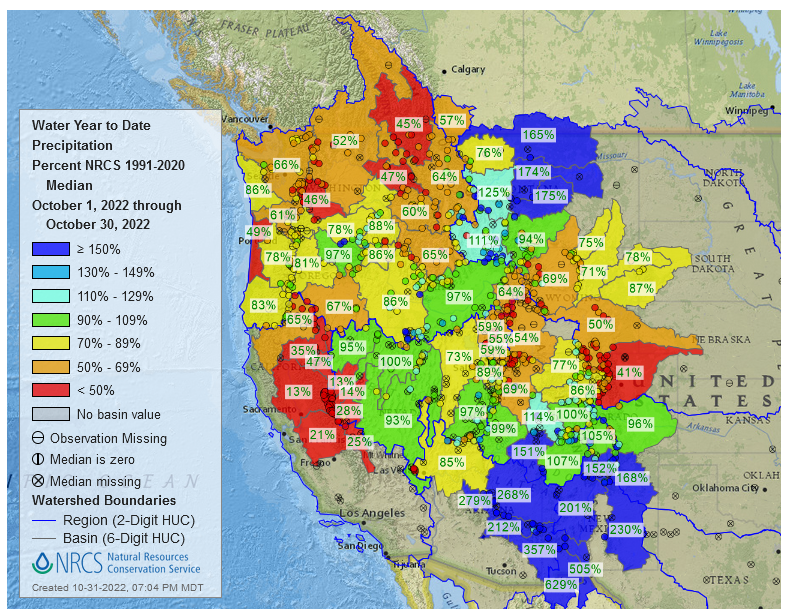
We have also included four months of Wildland Fire Potential Outlooks and also a map showing the year-to-date precipitation in the West. We also provide the Week 2/3 Tropical Outlook for the World.
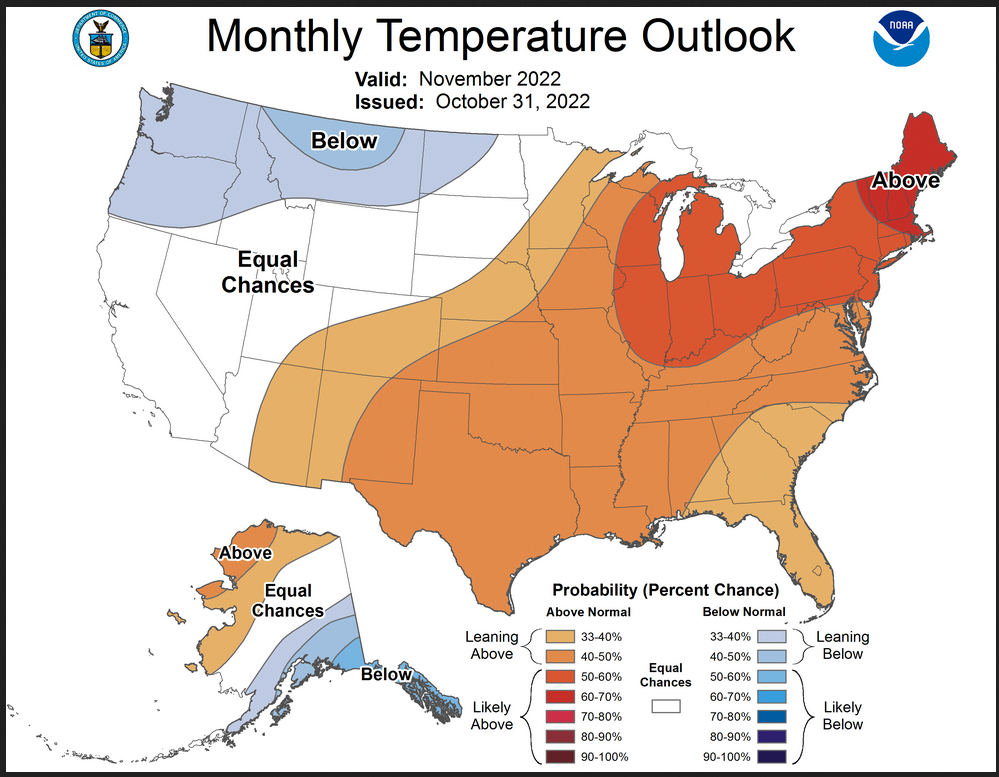
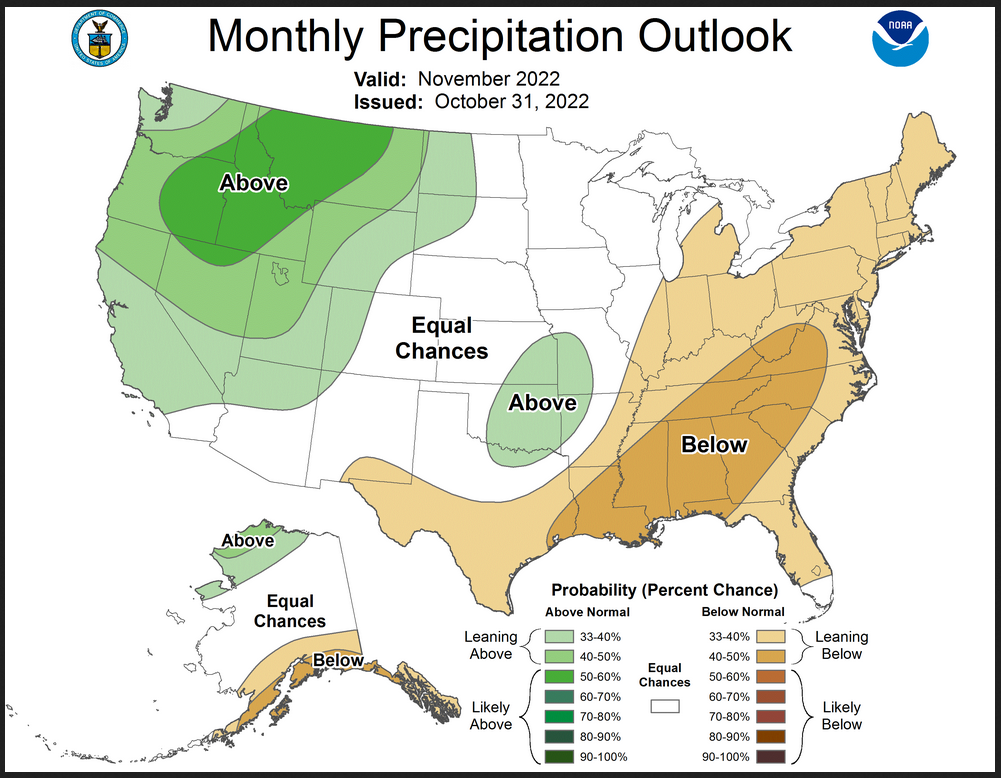
Here is the updated Outlook for November
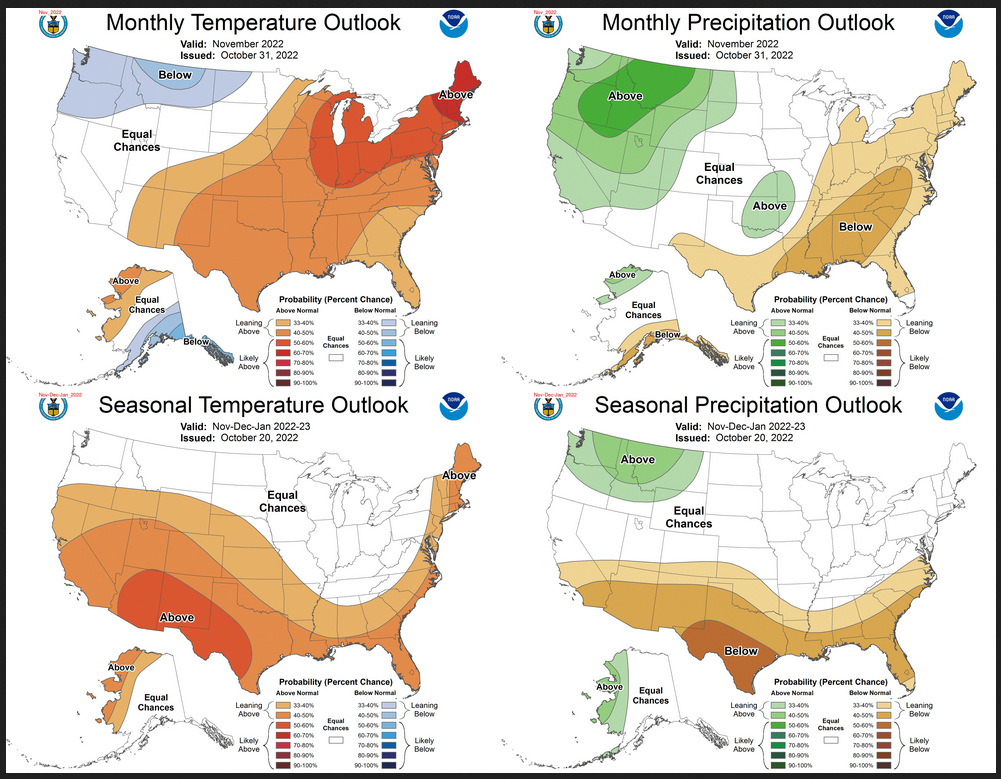
Combination of the Updated Outlook for November and Three-Month Outlook
| The differences are mainly due to increased confidence in the troughing over the western U.S., and ridging over the eastern U.S. pattern. |
There are some reversals in the new forecast for November relative to the three-month forecast. By a reversal we mean a change from wet to dry or warm to cool. Most of the changes are from Wet/dry/warm/cool to neutral or the reverse. But there are some significant reversals.
| For both temperature and precipitation, if you assume the colors in the maps are assigned correctly, it is a simple algebra equation to solve the month two/three anomaly probability for a given location = (3XThree-Month Probability – Month One Probability)/2*. So you can derive the month two/three outlook this way. You can do that calculation easily for where you live or for the entire map. |
It is important to remember that the November Outlook was updated on September 30 and the three-month Outlook was issued on October 20. So we always wonder if a change in the one-month outlook suggests that the three-month outlook would need to also be adjusted. I think that in this case, the answer is possibly YES
Here are larger versions of the Temperature and Precipitation Outlook maps
NOAA Discussion (I have shown certain important points in bold type)
30-DAY OUTLOOK DISCUSSION FOR NOVEMBER 2022
The November 2022 Temperature and Precipitation Outlooks are updated considering current active La Niña conditions, Weather Prediction Center (WPC) Outlooks for week 1, Climate Prediction Center (CPC) Extended Range and Week 3-4 Outlooks, dynamical model guidance for week 2, weeks 3-4, and the month of November, and statistical model guidance for the Week 3-4 period based on multiple linear regression (MLR) of the forecasted individual and combined influences of the Madden Julian Oscillation (MJO), El Niño Southern Oscillation (ENSO), and trend. La Niña remains the dominant diver for the updated November 2022 Temperature and Precipitation Outlooks. Though forecasts of the Realtime Multivariate MJO (RMM) index indicate a stagnating MJO signal into November, enhanced convection in the Northwest Pacific basin may teleconnect to the mid-latitudes.
A highly transient atmospheric pattern was observed and forecast throughout much of October, which led to some uncertainty in the earlier November 2022 Outlooks as well as differences in the updated November 2022 Outlooks. However, model solutions for the 6-10 and 8-14 day periods now generally agree on 500-hPa ridging over western Alaska, troughing over the western U.S., and ridging over the eastern U.S., and this height pattern is expected to persist throughout the month. While models agree on the overall pattern, there is some inconsistency in the location and extent of western U.S. troughing, with some models placing the trough more northward and others bringing the troughing over the west coast of the U.S. Similarly, there is some disagreement about the location and extent of eastern U.S. ridging, particularly the western and southern edges. Despite the model differences, the overall pattern is forecasted to remain consistent throughout the month.
Given favored troughing, forecasted cooler-than-normal temperatures in Week 2, and expected persistence into the latter half of November, an area of below normal temperature probabilities is indicated in the updated November 2022 monthly outlook for the Pacific Northwest extending into North Dakota. This is at odds with the most recent CFSv2 monthly forecast which favors warming in the Pacific Northwest, but given the early month cooler outlook a tilt toward below normal probabilities is indicated. While the half month lead Outlook indicated probability of above normal temperatures over the Southwest under possible ridging, equal chances of above, near, and below normal (EC) temperatures are favored over southern California and parts of Nevada and Arizona in the updated Outlook given the now expected western U.S. troughing. A weak tilt toward above normal temperatures is maintained over the Four Corners region where late November forecasts tilt toward probabilities of above normal temperatures. Beneath favored eastern U.S. ridging, above normal temperatures are indicated for the eastern half of the contiguous U.S. (CONUS). Though there may be a cooler start to November, probability of above normal temperatures are maintained over Texas given consistency among dynamical model forecasts in Week 3-4, earlier forecasts from the North American Multi-Model Ensemble (NMME) and Copernicus model suite (C3S), and enhanced warm probabilities in CFSv2 monthly forecasts. Strong ridging over New England in Week 2 and the expectation that ridging will persist throughout November led to enhanced confidence in above normal temperatures over parts of the Great Lakes, Ohio River Valley, and New England. Warm decadal trends over New England and anomalously warm recent sea surface temperatures (SST) off the New England coast further support higher confidence in above normal temperatures over New England.
Over Alaska, ridging is expected to persist though much of November over northwestern parts of the state, with troughing over southern Alaska and the Gulf of Alaska. Week 2 temperature forecasts indicate enhanced probabilities of above normal temperatures over Northwestern Alaska and confident below normal probabilities over parts of the Aleutians, south coast, and Alaska Panhandle. There is more disagreement in the Week 3-4 period about the location of the ridge and trough pattern and thus expected temperatures, but the general pattern is maintained through the end of the month. Recent monthly CFSv2 forecasts also indicate enhanced probability of above normal temperatures over northwestern Alaska and below normal temperatures over southern Alaska and the panhandle. Given the consistent forecast from Week 2 through Week 3-4 with the monthly CFSv2 forecasts, enhanced probabilities of above normal temperatures are indicated for northwestern Alaska and below normal temperatures for southern Alaska, with strongest probabilities over the Alaska panhandle corresponding to strong troughing in early November.
The updated November 2022 precipitation Outlook favors a broad region of above normal precipitation over the western U.S. extending into parts of the southwest and northern Plains, expanded from the mid-month Outlook. There is strong model agreement across Week 2, Week 3-4, and monthly dynamical model forecasts on above normal precipitation in this region. In contrast to the mid-month Outlook, the region of below normal precipitation probabilities is shifted eastward. Heavy precipitation forecast over parts of the central to southern Great Plains and Ozarks in early November based on Weather Prediction Center (WPC) 1-7 day Quantitative Precipitation Forecasts (QPF) led to a slight tilt toward above normal precipitation probabilities over the region. Dynamical model forecasts of Week 3-4 and monthly precipitation are confident on probabilities of below normal precipitation over the Gulf States, however, potential teleconnection from the convection in the Northwest Pacific could lead to above-normal precipitation over the region. As such, confidence is slightly lower than indicated by dynamical models over the Gulf States. Potential for early November rainfall along the coastal southeast as well as for weak troughing off the southeastern coast by the end of November led to still dry, but weaker probabilities along the coast. Over Alaska, the area of above normal precipitation is maintained from the mid-month Outlook given expected impacts from La Niña and decadal trends . Below normal precipitation is indicated for the southern coast of Alaska under forecasted troughing.
Drought Outlook
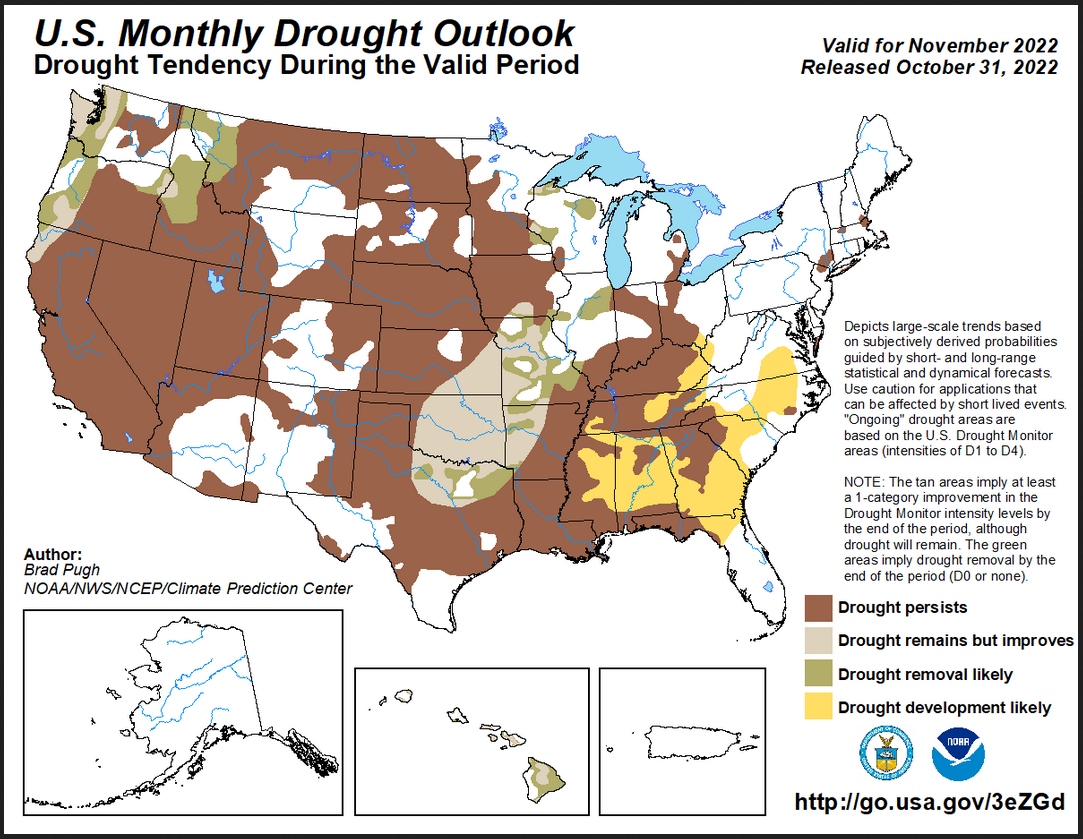
Here is the newly issued Drought Outlook for November 2022
–
| You can see where drought development is likely. It has shifted way to the east at least for November. The summary and detailed discussions that accompany this graphic can be accessed here https://www.cpc.ncep.noaa.gov/products/expert_assessment/mdo_summary.php |
Actually here is the short summary
Latest Monthly Assessment – According to the U.S. Drought Monitor, valid on October 25, 84.46 percent of the contiguous United States (CONUS) is designated with D0 (abnormal dryness) or D1+ (drought), which is the largest coverage since 2000. However, due to a major pattern change over the West during late October, this drought coverage may have peaked with the onset of beneficial precipitation for the Pacific Northwest and parts of the central U.S. The updated monthly outlook calls for increased chances of above-normal precipitation throughout the northwest quarter of the CONUS, supporting drought removal or improvement for the Pacific Northwest, parts of northern California, and the northern Rockies through the end of November. For the remainder of the West, long-term drought is most likely to persist on a monthly time scale. Heavy precipitation (1 to 3 inches, locally more) during late October coupled with another round of heavy precipitation during the first week of November supports improving drought conditions across the middle Mississippi Valley, Ozarks, and parts of the central to southern Great Plains. Drought improvement or removal also extends northeast to include parts of northern Illinois and the upper Mississippi Valley, due in part to recent heavy precipitation. Drought persistence or development are forecast for most of the Southeast, while the small lingering areas of drought across the Northeast are forecast to persist through the end of November. Continued drought improvement is expected throughout Hawaii with Alaska and Puerto Rico likely remaining drought-free.
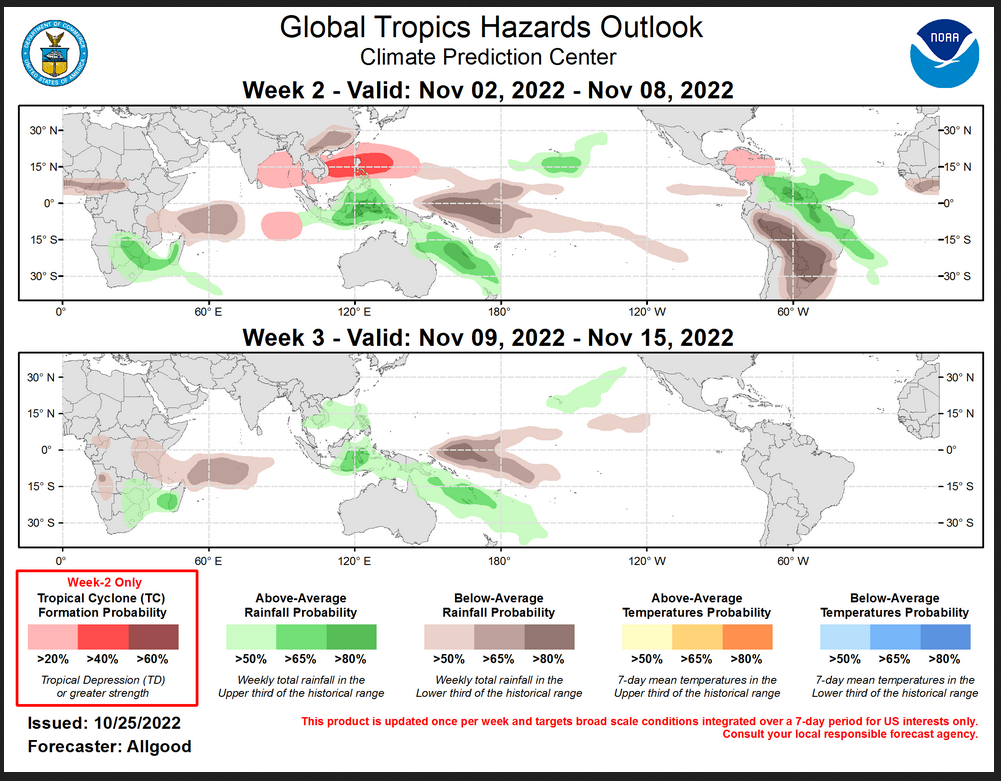
Worldwide Tropical Forecast
–
| Notice the below-normal precipitation predicted for Mexico intruding into the Southern Great Plains of the U.S.. Southern Asia looks pretty wet. The cyclone risks are only shown for Week 2. To update this forecast (which updates on Tuesdays) click HERE |
Tracking Temperature and Precipitation as the month proceeds
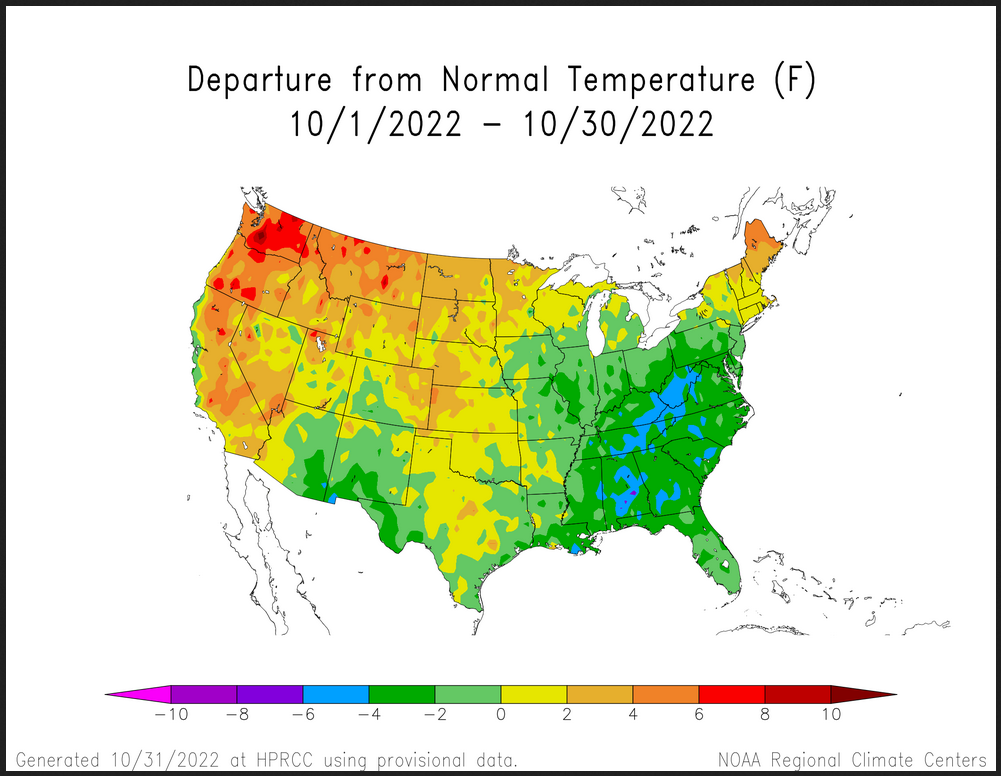
Looking back at October this is what we have observed.
Month-to-date Temperature as the current month evolves can be found at https://hprcc.unl.edu/products/maps/acis/MonthTD eptUS.png
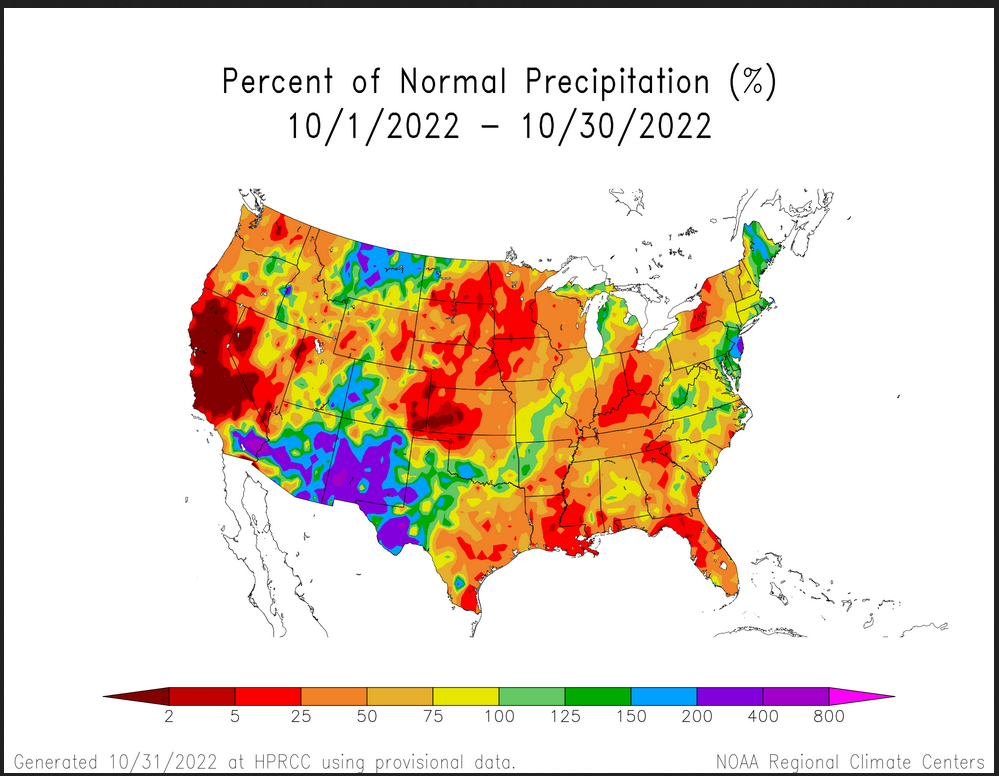
Looking back at October this is what we observed.
Month-to-date Precipitation as the current month evolves can be found at https://hprcc.unl.edu/pro ducts/maps/acis/MonthPNormUS.png
No Podcast this month: sorry.
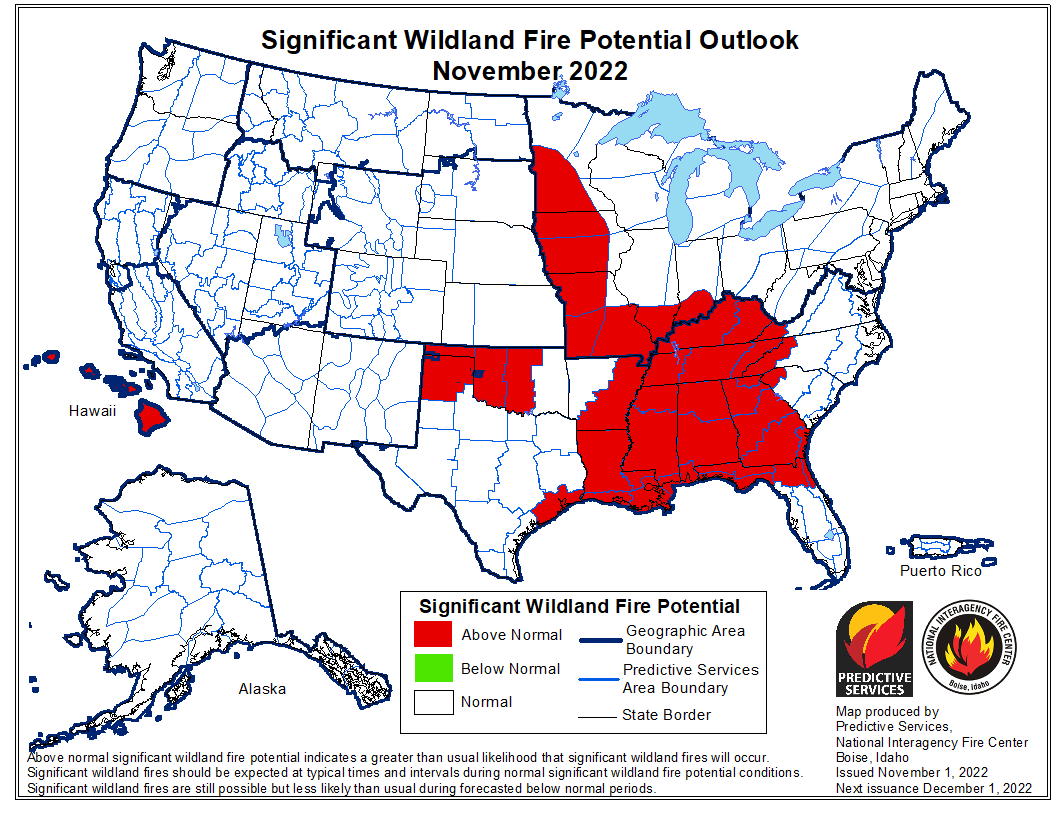
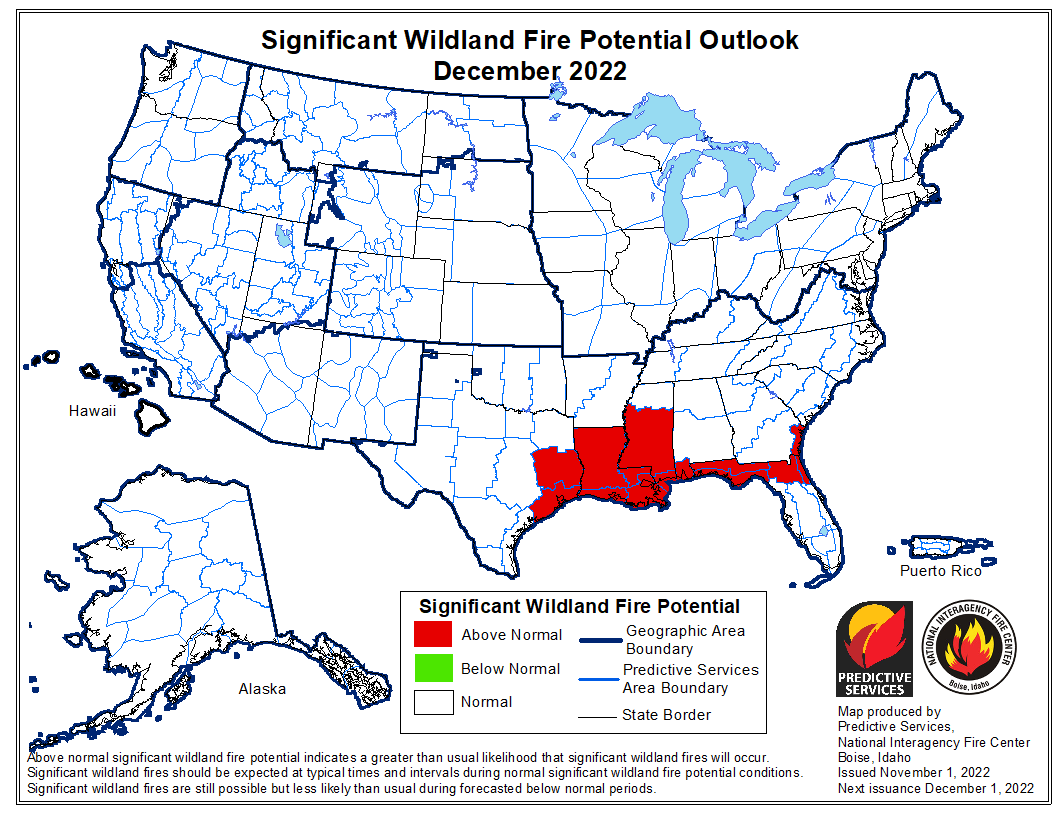
Fire Outlook: Current and Forecast
Updates to the major fire situation can be found by clicking here https://fsapps.nwcggov/afm/index.php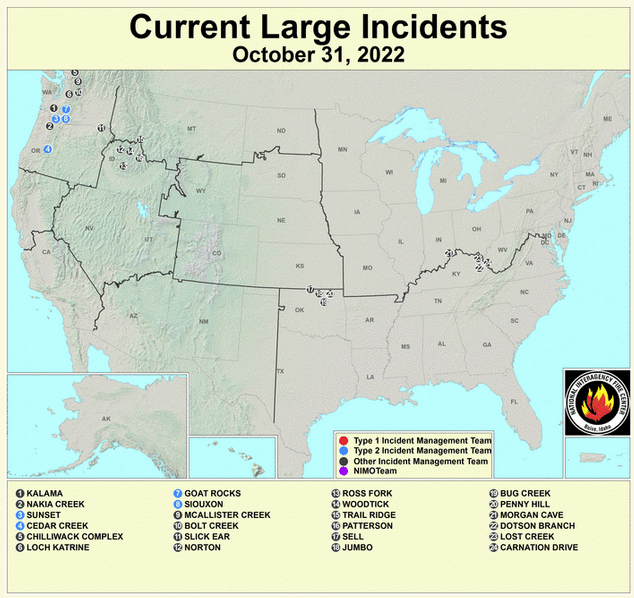
Now looking at the wildland fire potential outlooks
I have updated the above maps. If you read this article a month from now, you can update these graphics by clicking here https://www .nifc.gov
Water-Year to Date Precipitation
Water year-to-date precipitation can be found by clicking here https://www.nrcs.usda.gov/wps/portal/wcc/home/ I provided a map current as of October 30, 2022
–
| It is just one month but pretty interesting and shows the change in pattern at least temporarily. |
| I hope you found this article interesting and useful |
Hi Sig.
Thanks so much, I find this so interesting and you make it very understandable
I wonder if you look back at the sort of longer term time frame to find out how accurate or inaccurate these NOAA predictions have been.
Also wondering if the European weather predictions are the same?
Thanks
Jay
Thanks for the comments Jay. I could write a whole article on this. But here are a few quick thoughts.
A. NOAA uses the European Model. It is very good. They use a number of different models.
B. In the short term, NOAA (actually their CPC Division) looks at how the various models have performed recently and basically uses a weighted average of the model results based on recent performance.
C. Earlier this year I was showing the IRI ENSO Probabilities Distributions which are issued twice a month to show how these estimates have varied. But when I got up to ten to fifteen of them in an article, I decided to stop doing it lest I turn off a lot of readers. I found it very interesting.
D. If you go to https://www.cpc.ncep.noaa.gov/products/predictions/610day/fxus06.html and scroll down to “analogs” that is one way of looking at this in the short-term. What is shown there is pre-forecast analogs which shows how current conditions most closely compare to a previous point in time. Elsewhere you will find post-forecast correlation ratios which show how the forecast agrees with the historical actual. I used to include this sort of information in my articles but it was a lot of work and I was not sure how many found it of interest.
E. It is difficult to even define what is meant by accurate. Think about how you would measure accuracy for a weather forecast that covered a large area rather than a specific point. You could become famous if you come up with a good approach. Remember that forecasts are 3D not 2D.
F.. Keep posting comments as it helps me understand what people are interested in. And feel free to send my articles to your friends.
Thanks for the response, clarification and all your hard work trying to keep us updated.
I look forward to the next ones.
Jay