Here comes El Nino – is that possible?
The Japan Agency for Marine-Earth Science and Technology, or JAMSTEC, is a Japanese national research institute for marine-earth science and technology
JAMSTEC is predicting a more rapid demise of La Nina and a possible onset of El Nino conditions. Thus we should expect their forecast to differ dramatically from the NOAA forecast. Is it reasonable to predict a rapid change to El Nino? It is certainly possible. But it is not the majority opinion. Certainly, three La Ninas in a row build up the warm water in the IndoPacific Warm Pool. So I am presenting the JAMSTEC forecast as an alternative perspective.
I should have presented this information when I received it two weeks ago. The JAMSTEC forecasts are based on their model runs of October 1, 2022.
Although it is a World forecast, it includes a forecast for North America since North America is part of the World.

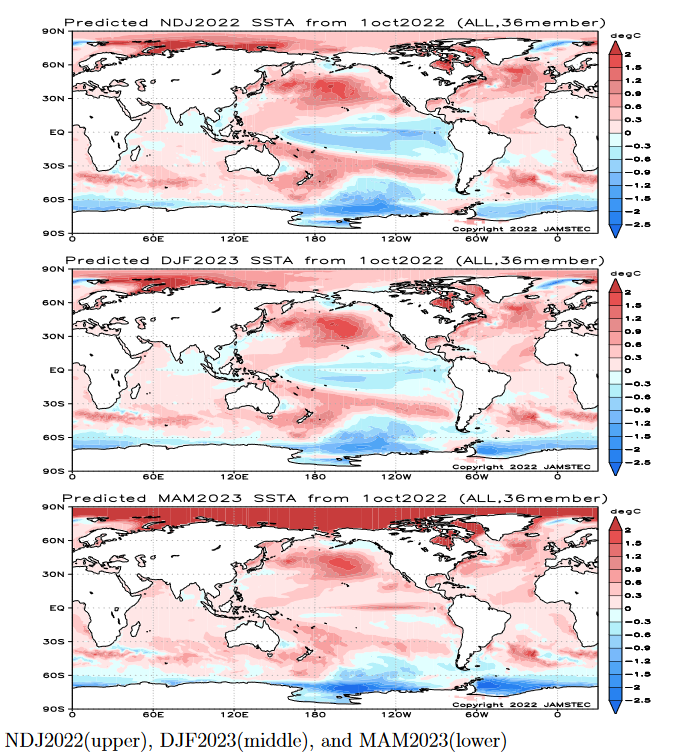
| This shows their forecast of sea surface temperatures at three points in time with the first two separated by one month. They do this because they prefer to work with meteorological seasons and November December January is not one of them but December January February is (Winter) and March April May is Spring. Notice the water along the Equator in the Pacific. Blue is cool (as an anomaly) and is associated with La Nina. Red is warm. It is not clear from the bottom graphic if they are projecting El Nino in that period but it is on the way to it. |
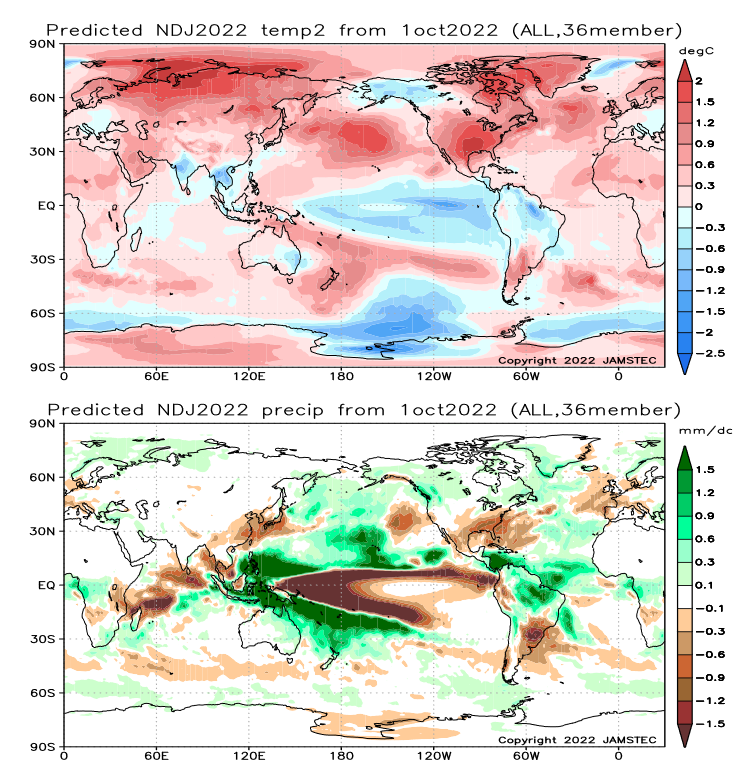
| The top map is the temperature forecast for NDJ 2022/2023. The bottom map is the corresponding precipitation forecast. |
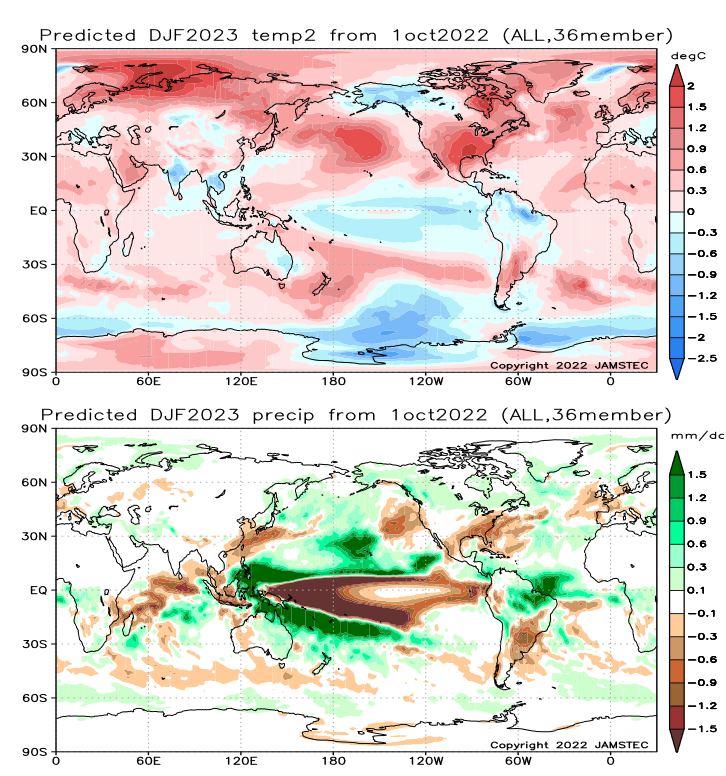
| Again the above is just one month later and covers DJF 2022/2023 which is meteorological Winter.
Here is the interpretation for both NDJ and DJF from the JAMSTEC Discussion shown below.:
|
–
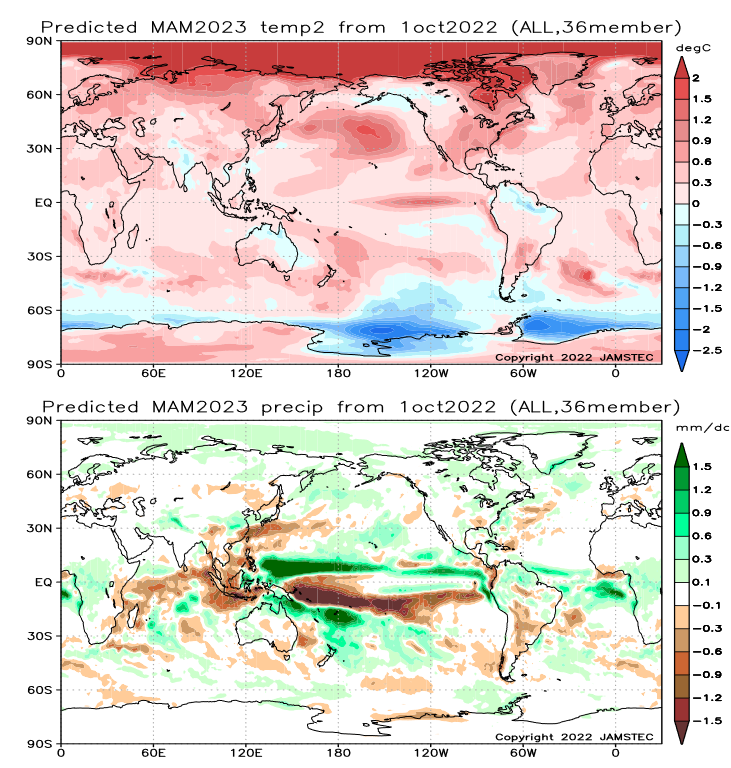
| And above, here is Spring March April May 2023 |
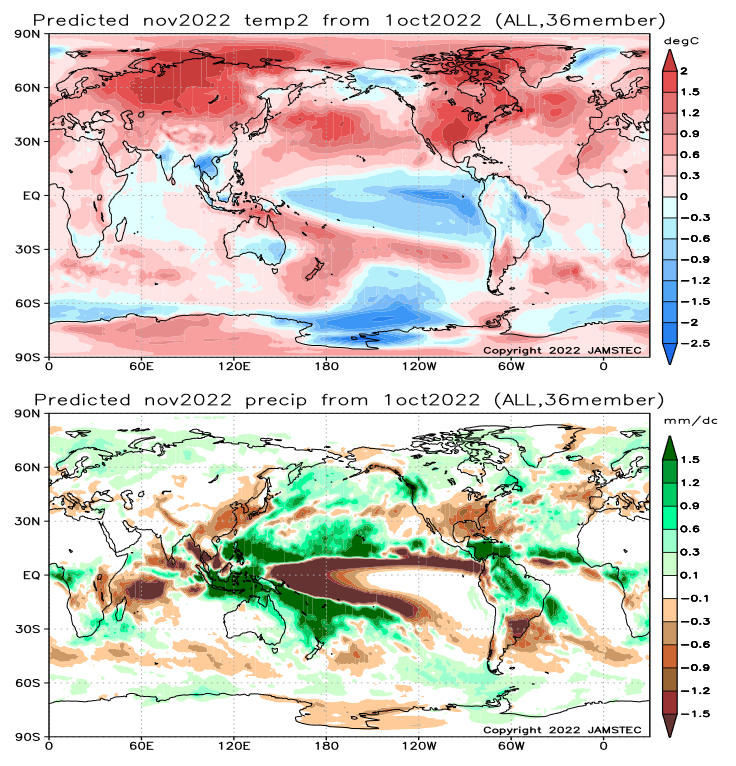
| And this is the single month of November 2022 |
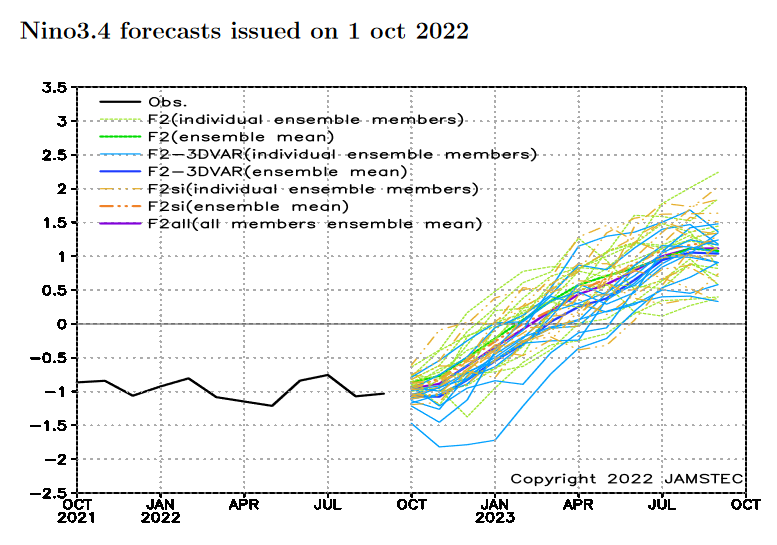
| We have previously presented the NINO 3.4 Index predictions by NOAA and BOM. Above is the one by JAMSTEC. It seems to go Neutral in January which is earlier than NOAA and many other Meteorological Agencies. And it goes above =0.5C in April which means El Nino at least from the perspective of Sea Surface Anomalies. |
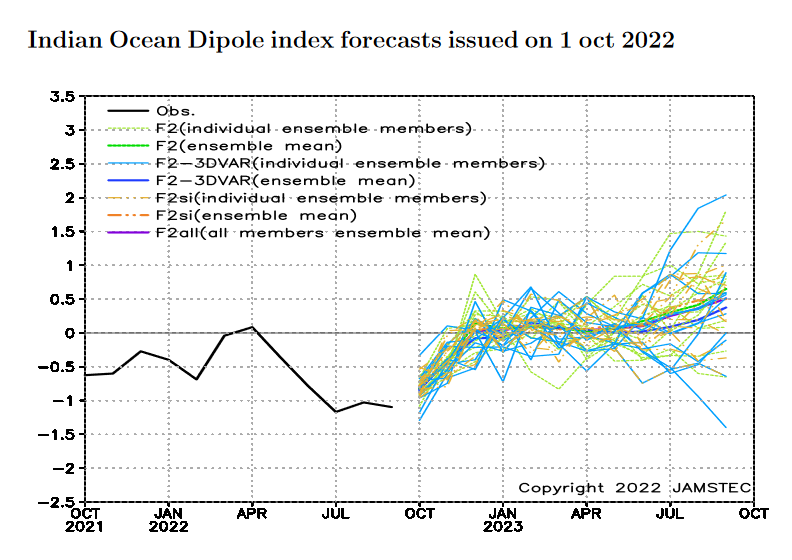
| The IOD is returning to normal so we will not discuss it further. |
And here is the short JAMSTEC Discussion
ENSO forecast:
Observation shows that the La Niña-like state continues. The SINTEX-F ensemble mean predicts that the La Niña-like state will persist in boreal autumn, and then the tropical Pacific will return to a neutral state in mid-winter. However, we note that the SINTEX-F2-3DVAR version predicts that the La Niña-like state will persist in mid-winter. The model predicts possibility of an El Niño occurrence in the boreal late spring of 2023.
Indian Ocean forecast:
The negative Indian Ocean Dipole continues. The SINTEX-F predicts that the negative Indian Ocean Dipole will persist in autumn, and then decay in winter.Regional forecast:
On a seasonal scale, the SINTEX-F predicts that most parts of the globe will experience a warmer-than-normal condition in November-January average, except for Alaska, the northern part of the South American Continent, southeastern Australia, India, Indochina, and some parts of Indonesia. In boreal winter (austral summer), the model also predicts persistence of a similar condition.As regards to the seasonally averaged rainfall in November-January average, a drier-than-normal condition is predicted for the southern part of the U. S. A., Mexico, La Plata, Sri Lanka, East Africa, some parts of Europe, most of East Asia, some parts of Eurasia, and some parts of Indochina. In contrast, southern Alaska, most of Canada, Central America, the northern half of the South American Continent, eastern Australia, Central Africa, Northern Europe, some parts of Eurasia, the Philippine, and Indonesia will experience a wetter-than-normal condition. In particular, we notice that Indonesia and Australia (East Africa) may experience wetter (drier) than normal conditions, owing to the negative Indian Ocean Dipole. In boreal winter (austral summer), a wetter-than-normal condition is predicted for Alaska, Canada, the northern half of the South American Continent, eastern Australia, some parts of southern Africa, Central Africa, some parts of Eurasia, and the Philippine. In contrast, the southern/eastern parts of the U.S.A., Mexico, La Plata, Western Australia, East Africa, some parts of southern Africa, southern Indochina, Indonesia, some parts of Eurasia, and some parts of East Asia will experience a drier-than-normal condition.
As regards to the seasonally averaged climate, the model predicts that most of Japan will experience a warmer and drier-than-normal condition in November-January average. In winter, the model still predicts that most of Japan will experience a warmer -than-normal condition. The mode l also predicts the northern (southern) part of Japan will experience a wetter (drier) -than-normal condition.
Now switching over to Part II of this article which is our regular 48-Hr Forecast which also includes links for tropical updates and in some cases the NHC maps for storms that are near-term threats.
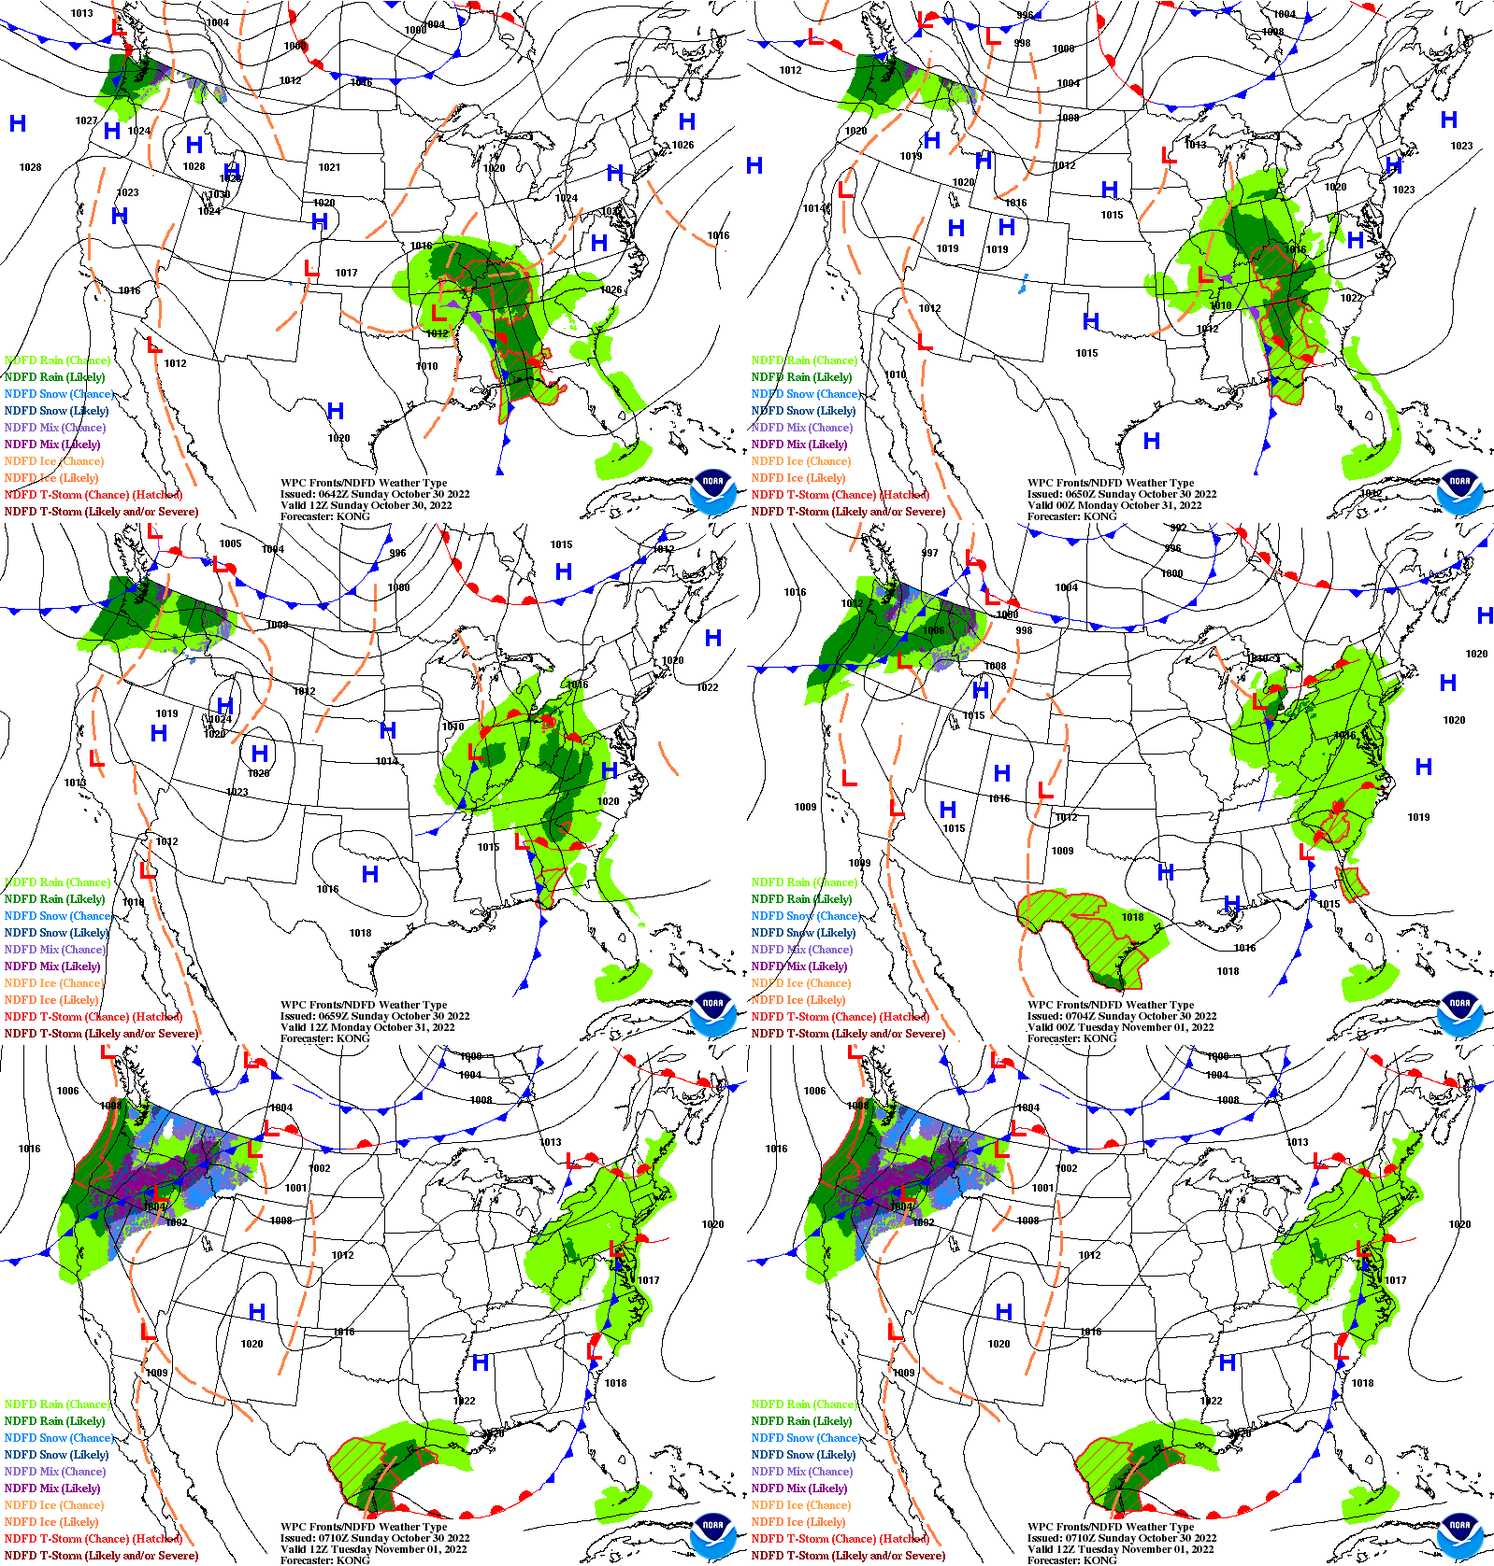
Here is what we are paying attention to today and the next 48 hours from this morning’s NWS Forecast. (updated on Sunday Afternoon)
...Unsettled weather will spread across the Eastern U.S. through Tuesday...

...Widespread rain and high elevation snow expected across the Pacific
Northwest and Northern/Central Rockies through mid-week...

...Cooler temperatures will arrive in the West by mid-week while the
Central U.S. warms...

The low pressure system that brought severe weather to the central Gulf
Coast yesterday is slowly moving northeast. The system is forecast to
split into two weaker low pressure systems on Monday as it approaches the
East Coast. Unsettled weather will gradually spread eastwards across the
eastern U.S. as the system progresses, but severe weather is not
anticipated. Trick-or-Treaters in the Ohio Valley, central and southern
Appalachians, Mid-Atlantic, and portions of the Southeast may have to
dodge showers and isolated thunderstorms. This system is expected to push
offshore into the Atlantic on Tuesday and the eastern U.S. will become
mostly dry by Wednesday. A separate low pressure system just south of the
U.S. will also bring scattered showers and thunderstorms to South Texas
and portions of west and central Texas Monday through Tuesday.
Precipitation chances will diminish in Texas on Wednesday.

Trick-or-Treaters in the Pacific Northwest will likely have a soggy
Halloween on Monday as a cold front moves southeast across the region.
Widespread rain at low elevations and mixed precipitation and snow at high
elevation will develop behind the front, engulfing the region and
spreading into the northern and central Rocky mountains by Tuesday. Rain
and high elevation snow will remain in the forecast for these areas
through mid-week with isolated heavy mountain snow possible at times.
Precipitation will start to push into the central U.S. later this week
when the front moves past the mountains.

Colder air will filter in behind the front, and below normal temperatures
are forecast to spread across most of the western U.S. by mid-week. High
temperatures in the 40s and 50s will be common, and high elevations will
be colder. While the west cools, southerly flow ahead of the system will
bring warmer air into the central U.S. Temperatures will be above average
through mid-week for most of the Central U.S. with highs in the 60s and
70s.
ated twice a day and these updates can be found here.
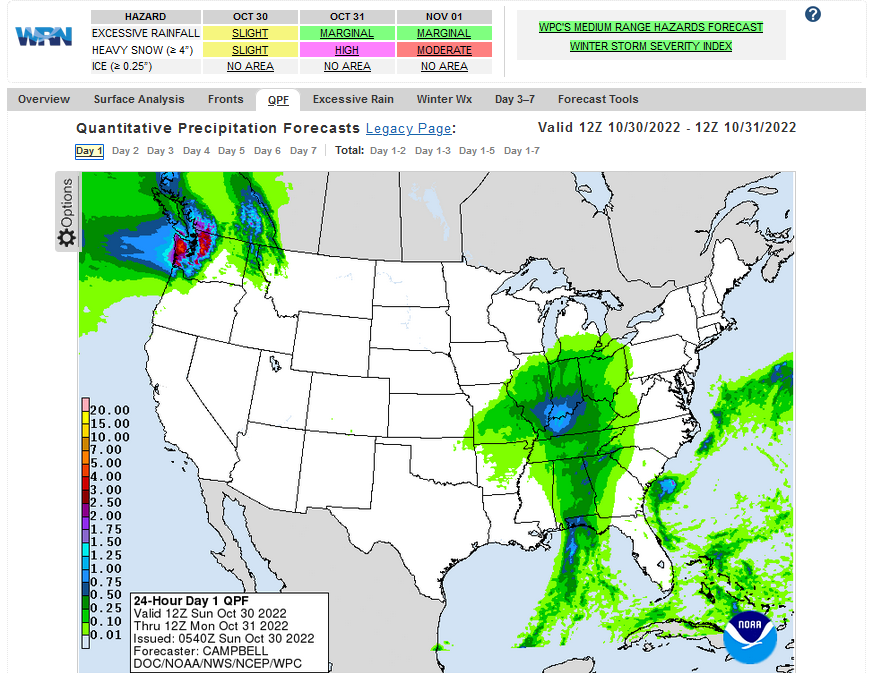
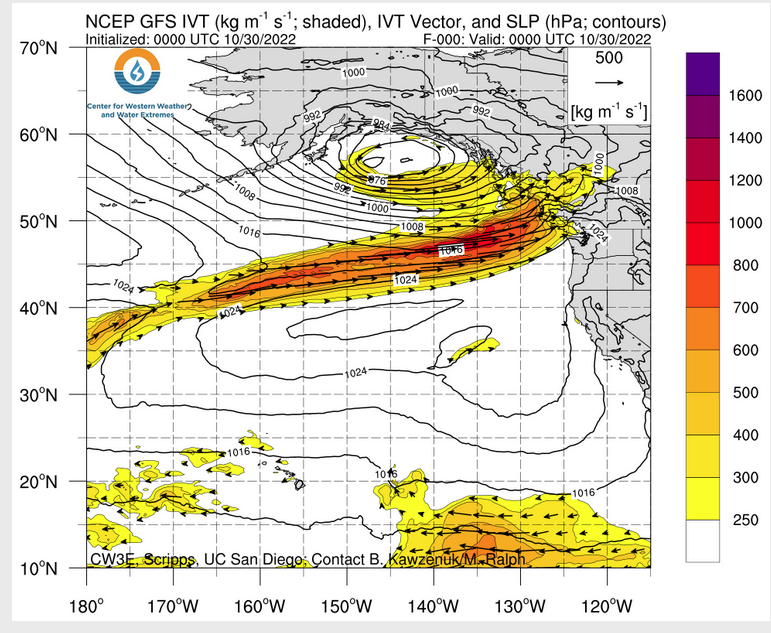
Current forecast of heavy precipitation (Updates can be found HERE)
Click HERE to update. HERE is some useful information about Atmospheric Rivers.
Maps that relate the forecast to geography can be found by clicking Here for Day 1 and Here for Day 2.
Here is a 60-hour animated forecast map that shows how the short-term forecast is expected to play out.
If it needs to be updated click here.
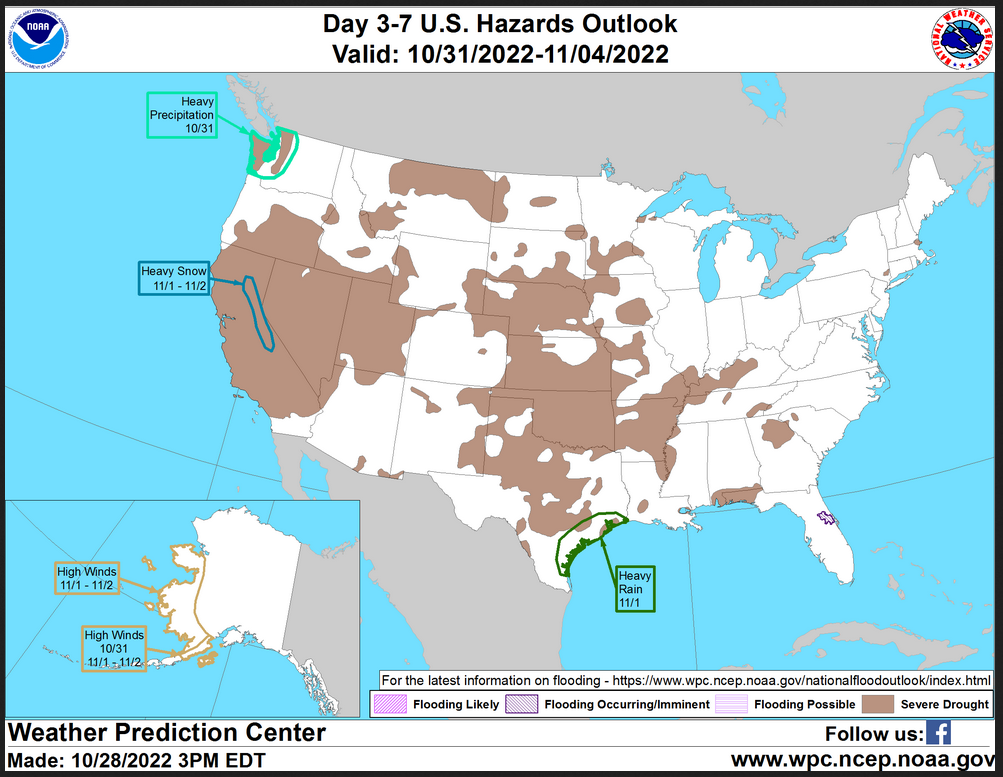
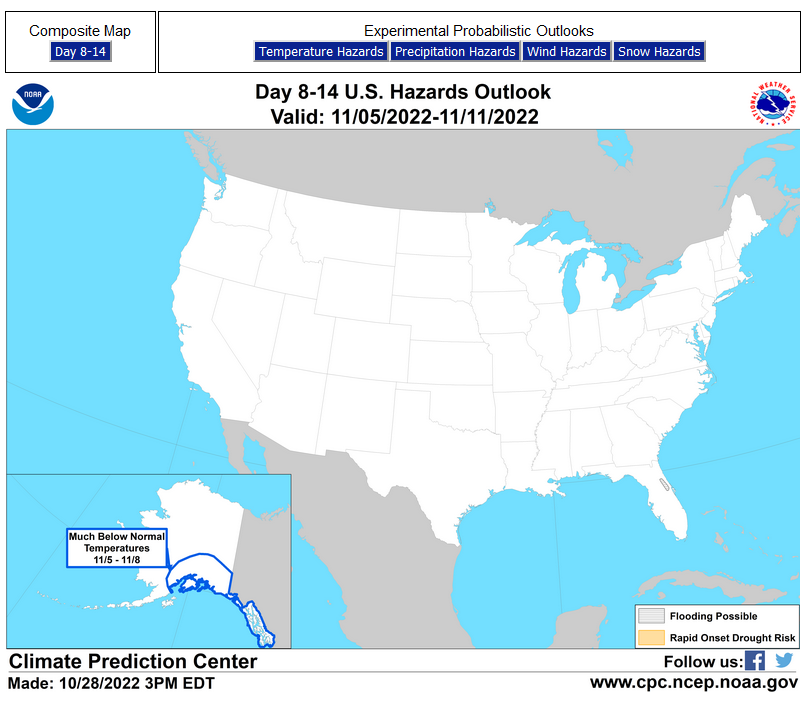
HAZARDS OUTLOOKS
Click here for the latest complete Day 3 -7 Hazards forecast which updates only on weekdays. Once a week probably Monday or Tuesday I will update the images. I provided the link for readers to get daily updates on weekdays. Use your own judgment to decide if you need to update these images.
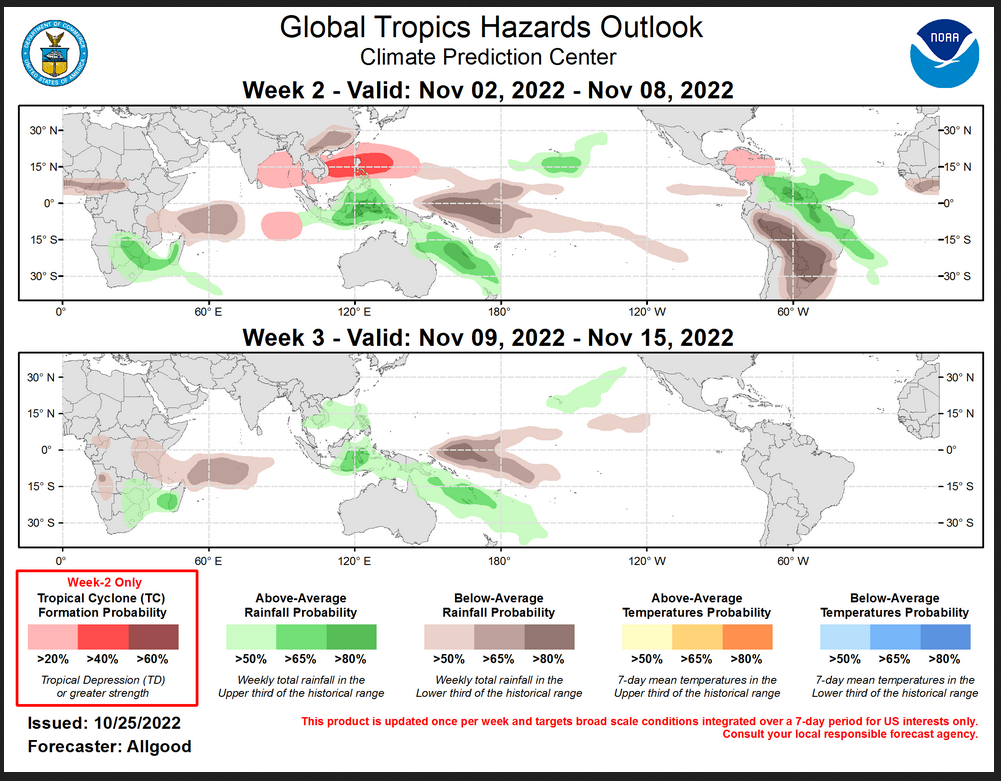
Worldwide Tropical Forecast
(This graphic updates on Tuesdays) If it has not been updated, you can get the update by clicking here
Detailed Maps and Reports.
Below are four maps that summarize the situation for the Atlantic, Eastern, Central Pacific and Western Pacific. Additional information can be accessed by clicking HERE
First the Atlantic
Click to view the forecast map and have access to additional information https://www.nhc.noaa.gov/gtwo.php ?basin=atlc&fdays=5
Then Eastern Pacific
Click to view the forecast map and have access to additional information https://www.nhc.noaa .gov/gtwo.ph p?basin=epac&fdays=5
Then Central Pacific
Click to view the forecast map and have access to additional information https://www.nhc.noaa.gov/gtwo.php?basin=cpac&fdays=5
And the Western Pacific
Click to view the forecast map and have access to additional information https://www.metoc.navy.mil/jtwc/jtwc.html
Updates and additional information can be accessed by clicking HERE
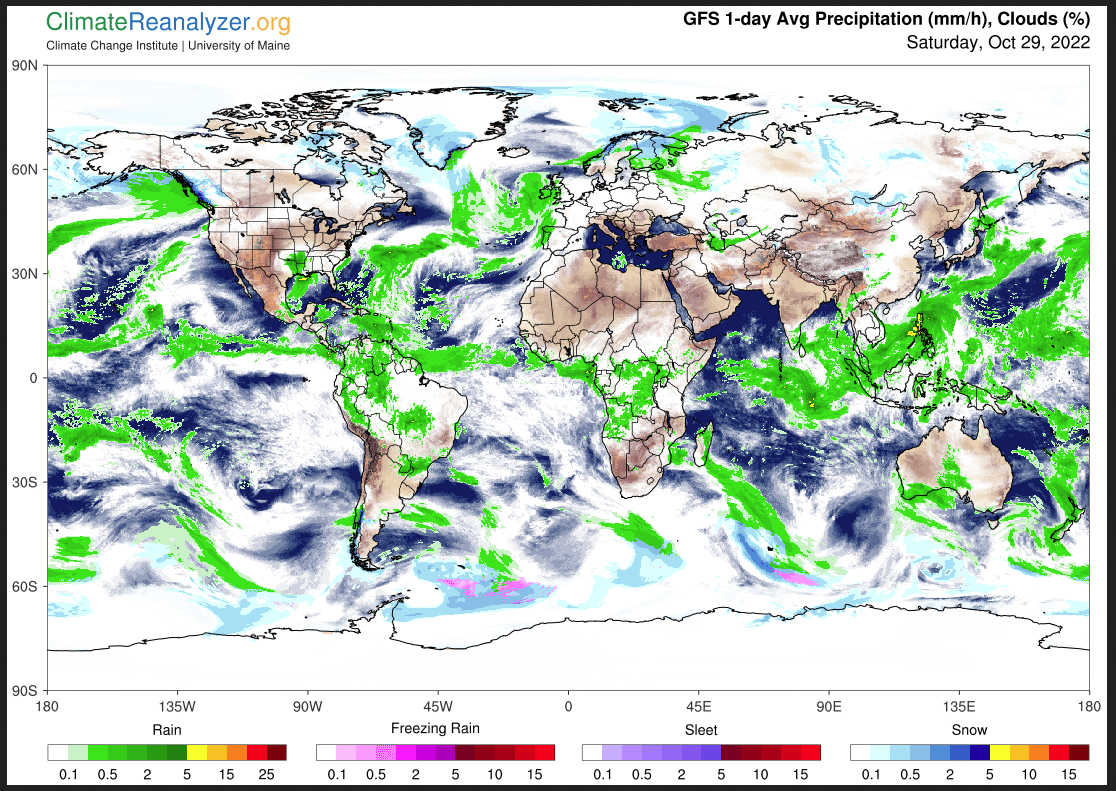
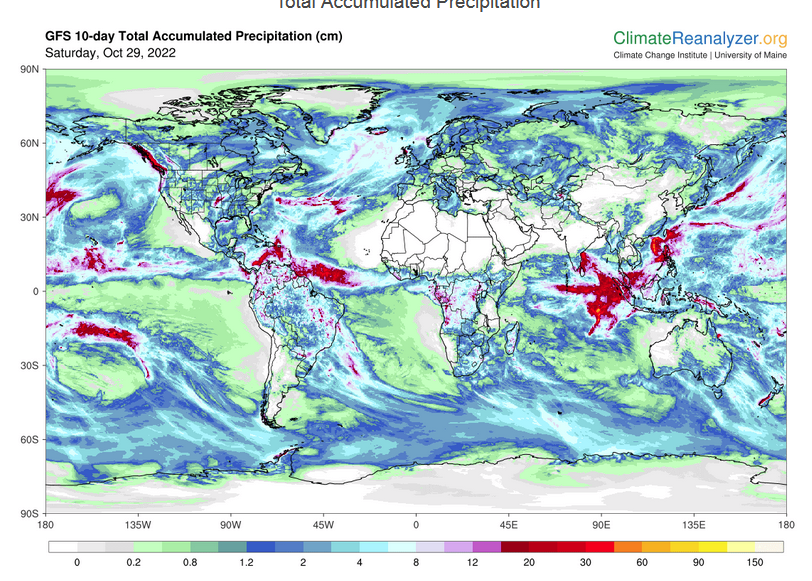
World Forecast
Below is the current or short-term precipitation forecast which can be updated by clicking HERE Additional maps for different time frames and other aspects of weather in addition to precipitation can be obtained HERE.
Month to Date Information
Temperature month to date can be found at https://hprcc.unl.edu/products/maps/acis/MonthTDeptUS.png
Precipitation month to date can be found at https://hprcc.unl.edu/products/maps/acis/MonthPNormUS.png
