NOAA updates many of its weather outlooks daily or even more frequently and in many cases issues a discussion with those outlooks. We provide a daily report which focuses on the shorter-term predictions but also has links to all the partial-month outlooks. Because WordPress does not provide the ability to have these maps automatically updated, our daily report shows some of the maps which we update each evening plus the links to the other important weather forecast Maps.
Once a week we show many of the actual forecast maps not just provide the links to these maps. This makes it easier for the reader. Our report provides a separate forecast for Days1-5, Days 6 -10, Days 8 – 14, and weeks 3 and 4. This provides information that is useful to readers in terms of planning their activities for the next 28 days.
The week 3-4 outlook is only updated by NOAA’s Climate Prediction Service once a week on Friday. Thus, when we publish on Friday night, it provides a 28-day view of the future. What is important is that this is a longer-term view than one that is typically available in the media and online.
We also include In Part II of the article the other information from the daily 48-hour forecast article. Importantly, this time of the year, it includes updates on tropical events. In both Parts I and II we also include some worldwide forecasts.
It is important to recognize that the forecasts do not always work out as predicted. But in the article, there are links to obtain updated forecasts If you read this article a few days or more after it is published. And there will be a totally updated version next Friday.

What NOAA is predicting for the next 28 days.
We will start with the short-term – It is up to date as of today. If you look at this article after today you can click the links to update (plus you will end up with a lot of additional information)
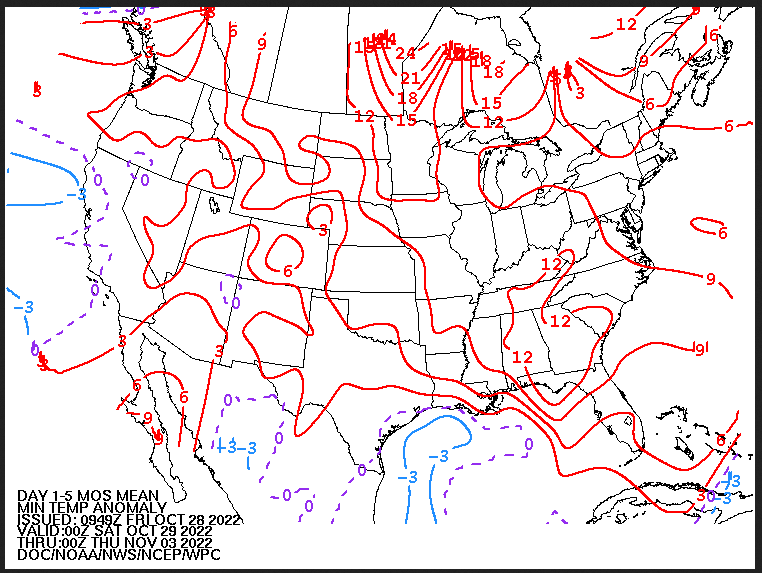
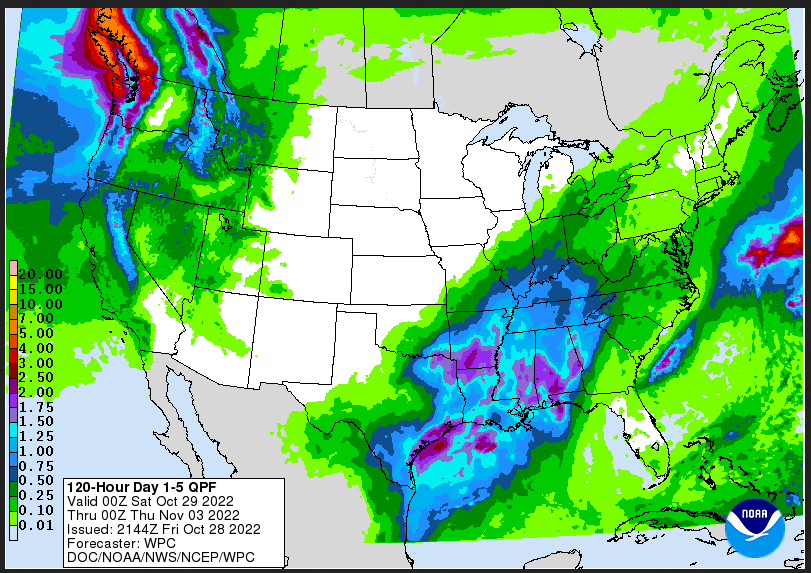
| Temperature (Maximum or Minimum Anomaly) for the next five days | Precipitation (Five days of cumulative precipitation) |
| https://www.wpc.ncep.noaa.gov/medr/me dr_mean.shtml | https://www.wpc.ncep.noaa.gov/qpf/day1-7.shtml |
| The lows are above normal almost everywhere and there are two bands of precipitation one on the West Coast and one centered on the Gulf States. |
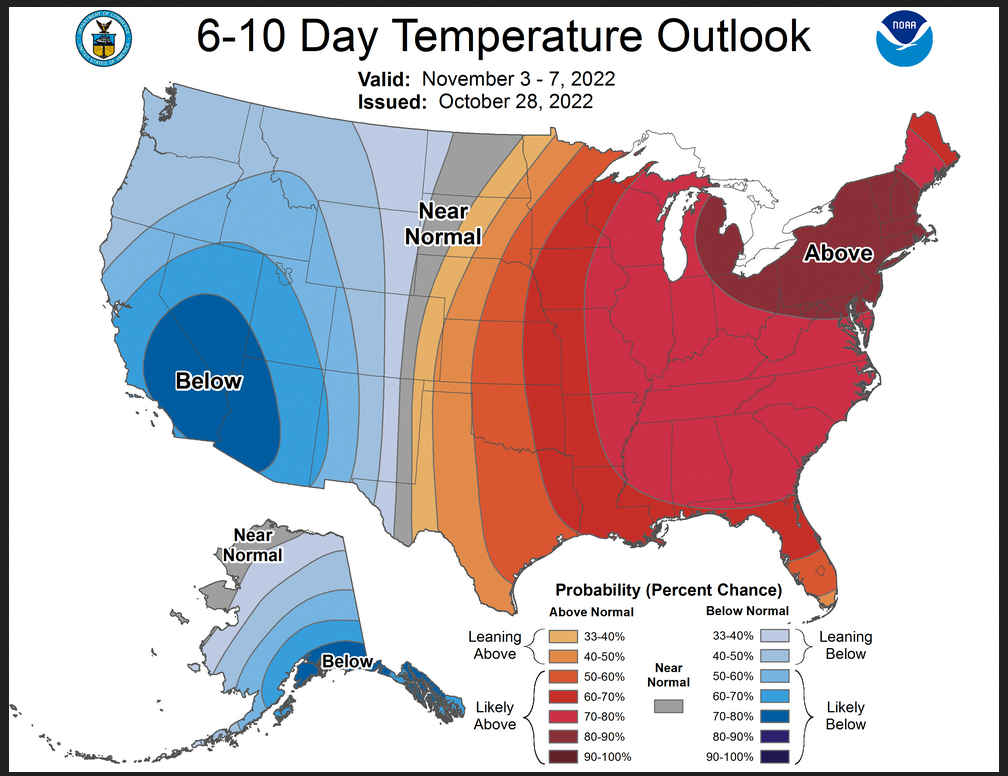
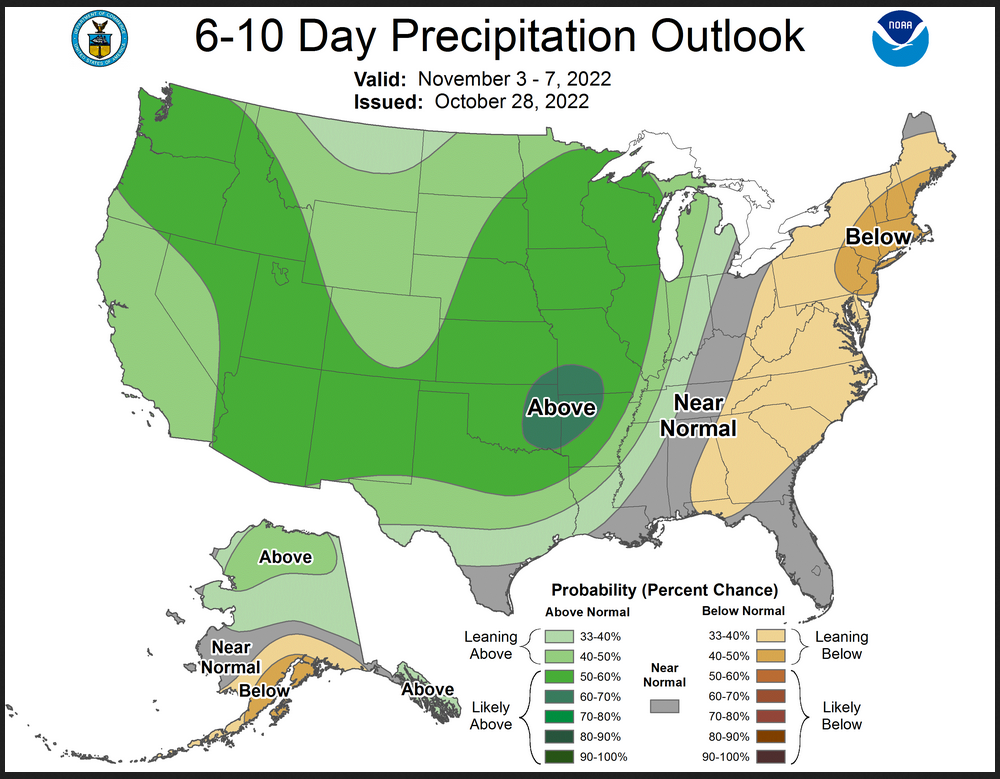
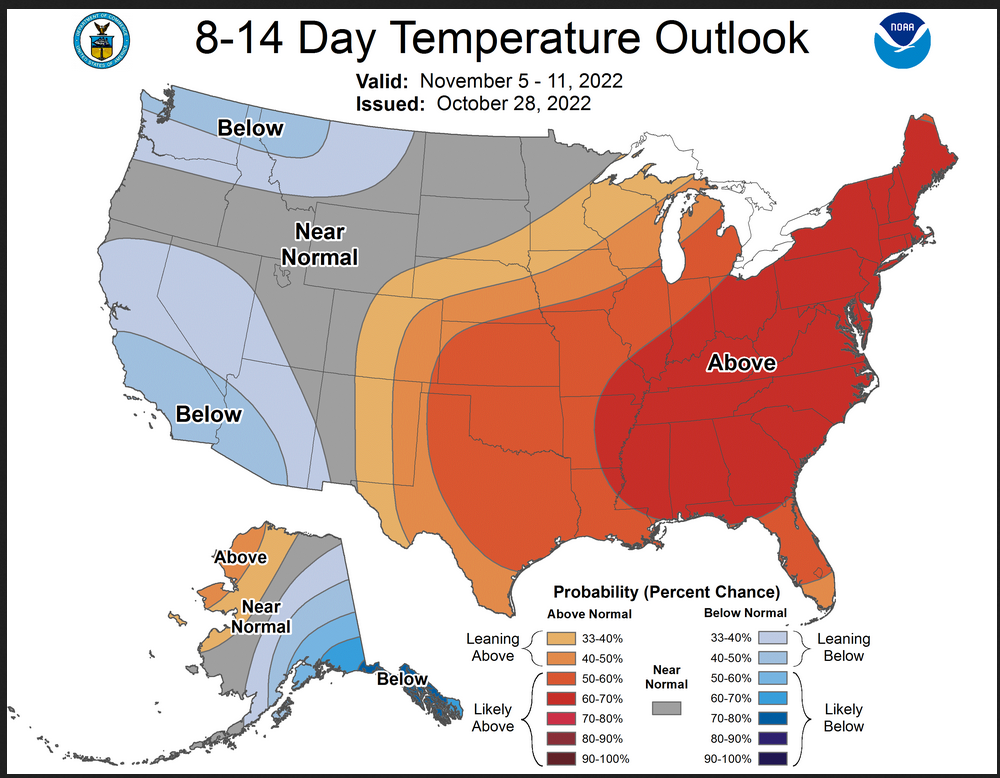
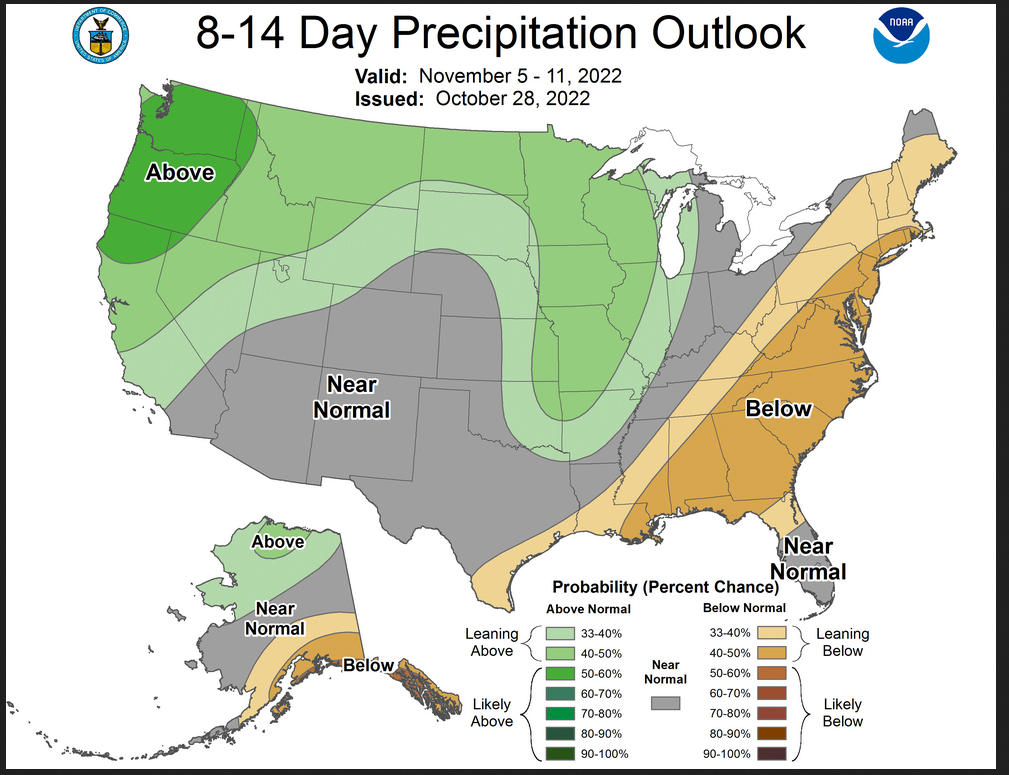
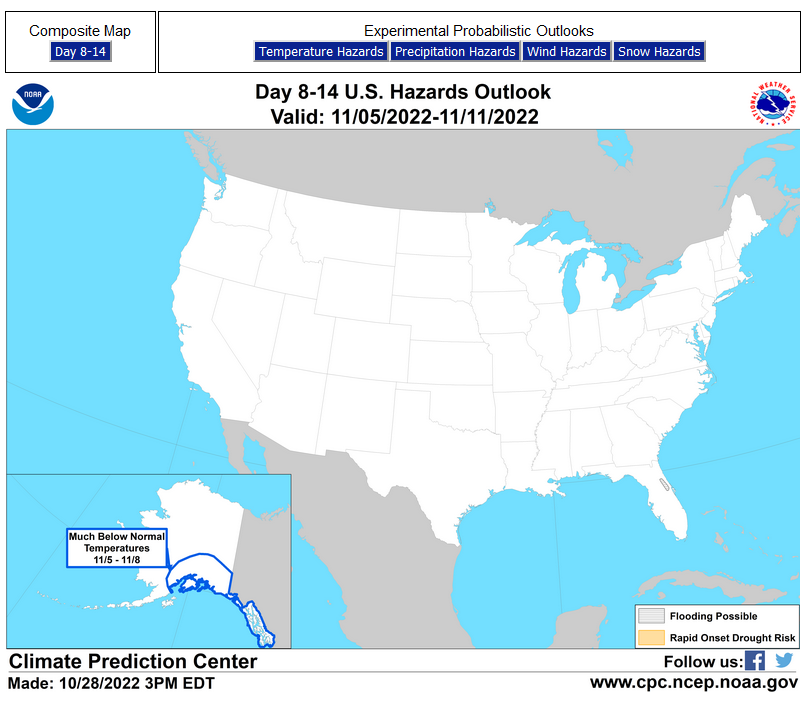
Now we look at “Outlook” maps for three time periods. Days 6 – 10, Days 8 – 14, and Weeks 3 and 4. An outlook differs from a forecast based on how NOAA uses these terms in that an “outlook” presents information as deviation from normal and the likelihood of these deviations.
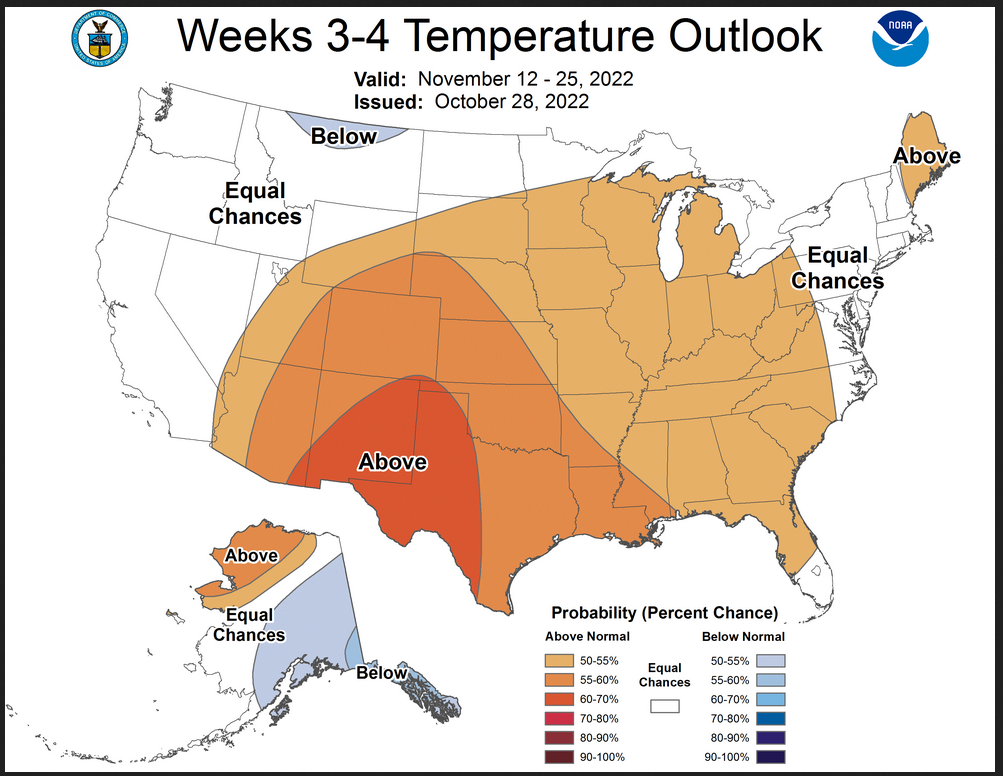
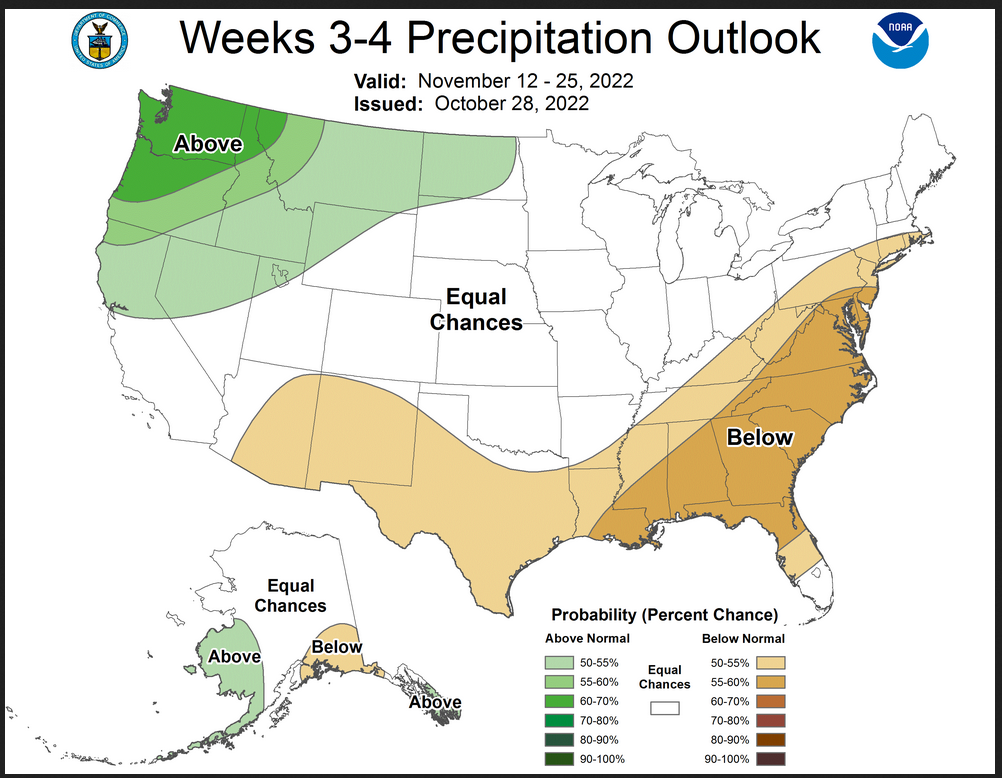
I have provided the maps so you do not need to click to get them. But they do not update daily. But you can get the current images simply by clicking on the links provided. Then hit the return arrow at the upper left of your screen to return to the article. There is no need to do that right away since what is published today is up to date. The Week 3 – 4 Outlook only updates on Fridays.
Below are the links to obtain updates and additional information.
| West/ East divide for both temperature and Precipitation. |
| Somewhat similar to Days 6 – 10 but the wet area is now along the Northern Tier from the Great Lakes west. |
Prognostic Discussion for Week 3-4 Temperature and Experimental Precipitation Outlooks
NWS Climate Prediction Center College Park MD
300PM EDT Fri Oct 28 2022Week 3-4 Forecast Discussion Valid Sat Nov 12 2022-Fri Nov 25 2022
La Niña conditions continue to dominate the global tropical convective pattern, with enhanced trade winds and upper-level westerly anomalies extending across much of the tropical Pacific. Similar to previous events that occurred during the Boreal summer months, an active Madden Julian Oscillation (MJO) pattern evolved over the Indian Ocean by early October and propagated eastward to the Maritime Continent, where it constructively interfered with the La Niña base state. This signal weakened substantially as the enhanced convective envelope moved over the West Pacific; however, the MJO did contribute to off-Equator enhanced convection over the Northwest Pacific basin. This activity is resulting in a fairly strong projection onto the Realtime Multivariate MJO (RMM)-based index. Although unlikely to substantially affect the ongoing ENSO-cold conditions, the enhanced Northwest Pacific convection may begin teleconnecting to the downstream midlatitude pattern, affecting its evolution into the Weeks 3-4 period. Therefore, statistical model guidance that utilizes MJO, El Niño Southern Oscillation (ENSO), and trend were considered carefully for this outlook.
Dynamical model forecasts of the 500-hPa height anomaly pattern during Weeks 3-4 are fairly consistent with each other, and reflect a coherent retrograding transition from the anticipated Week-2 pattern. A manual blend of the operational dynamical model suites and the multivariate linear regression (MLR) statistical model using equal weighting depicts strong ridging south of the Aleutians, with weak troughing just offshore of the Pacific Northwest. Ridging is favored over the central CONUS, with weakness near the East Coast. Over the North Atlantic, a pattern resembling the positive phase of the North Atlantic Oscillation (NAO) appears to limit the potential for persistent blocking patterns across the eastern contiguous United States (CONUS).
Consistent with favored ridging over the central CONUS, above-average temperatures are favored for the Four Corners region, central and southern Plains, much of the Southeast, and portions of the Midwest. Equal chances of above and below normal temperatures are maintained across the West and Northern Tier of the CONUS, due to increased model uncertainty. Many model solutions depict a robust cold airmass in place over western and central Canada, which is consistent with evolutions based on MJO activity. There is a potential for cold air outbreaks into the West or central CONUS; however, uncertainty is high and most models do not show widespread cold conditions. Therefore, only a small area favoring below was included in the outlook over northern Montana. Equal chances were maintained for South Florida due to the potential for troughing along the adjacent Atlantic basin. Across Alaska, southwesterly flow favors above-average temperatures for parts of western Alaska and the North Slope, while troughing favored elsewhere indicates increased chances for below-normal temperatures.
Dynamical model precipitation forecasts for the Weeks 3-4 period were unusually consistent, with each model system depicting enhanced precipitation across the Northwest and suppressed rainfall for the Southeast. Uncertainty increased across the Northern Plains and Corn Belt, with some of the guidance showing wetness, while the GEFS solution was notably drier. Based on the model consistency, there is more than a 60-percent chance of above-median precipitation across the Pacific Northwest, with a slight chance of above-median precipitation extending to the northern Plains. Although the MJO component of the MLR strongly favors above-median precipitation for the Southeast and lower Mississippi Valley, the associated height anomaly pattern is quite different from the dynamical model solutions. Therefore, below median precipitation is favored for this Weeks 3-4 outlook across the Southeast and Mid-Atlantic regions. Across Alaska, potential enhanced onshore flow favors increased odds for above-median precipitation for the southeastern quadrant of the state, while below median precipitation is favored for the southeastern portion of mainland Alaska. Enhanced moisture flow into the Pacific Northwest may extend northward to the southern Alaska Panhandle region.
Both operational model guidance and the multi-model ensemble of the Subseasonal Experimental suite of models (SubX multi-model ensemble) depict a pronounced wet signal across Hawaii during the Weeks 3-4 period, which could bring beneficial drought relief. Above-average temperatures are favored based on dynamical model guidance and above-average SSTs.
| It is important to note that the Week 3 -4 Outlook is prepared by a different team than the 6 -10 and 8 – 14 day Outlooks as well as the update of the monthly outlook. |
Now switching over to Part II of this article which is our regular 48-Hr Forecast which also includes links for tropical updates and in some cases the NHC maps for storms that are near-term threats.
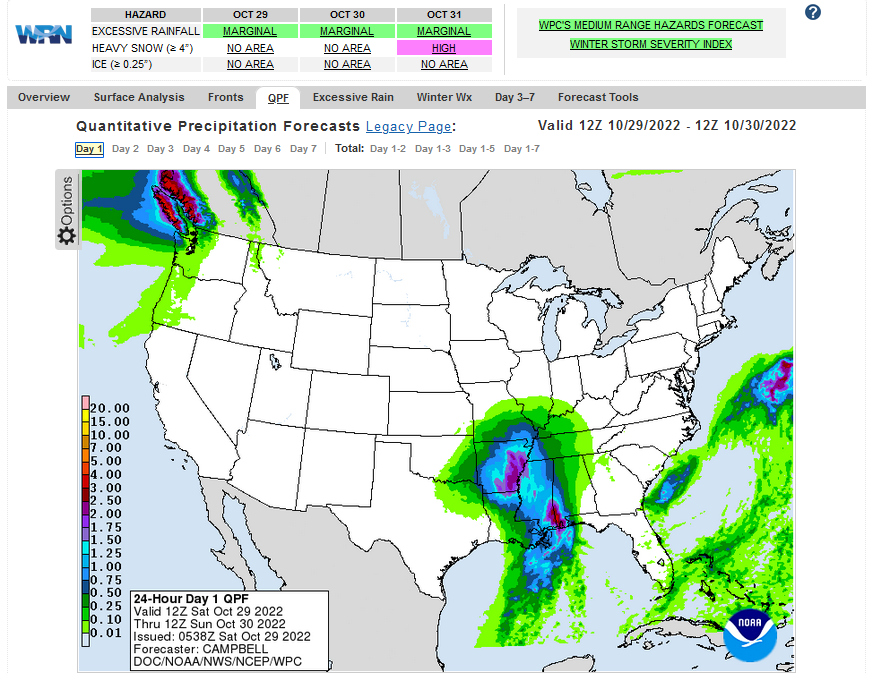
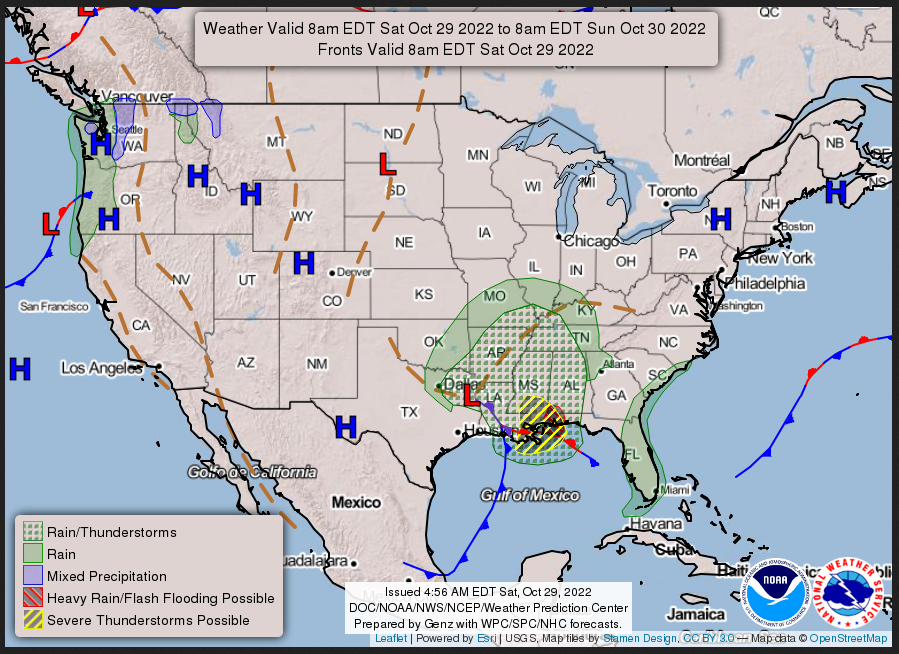
Here is what we are paying attention to today and the next 48 hours from this morning’s NWS Forecast.
...A low pressure system will bring a quick round of heavy rain and severe
thunderstorms across the lower Mississippi Valley through tonight

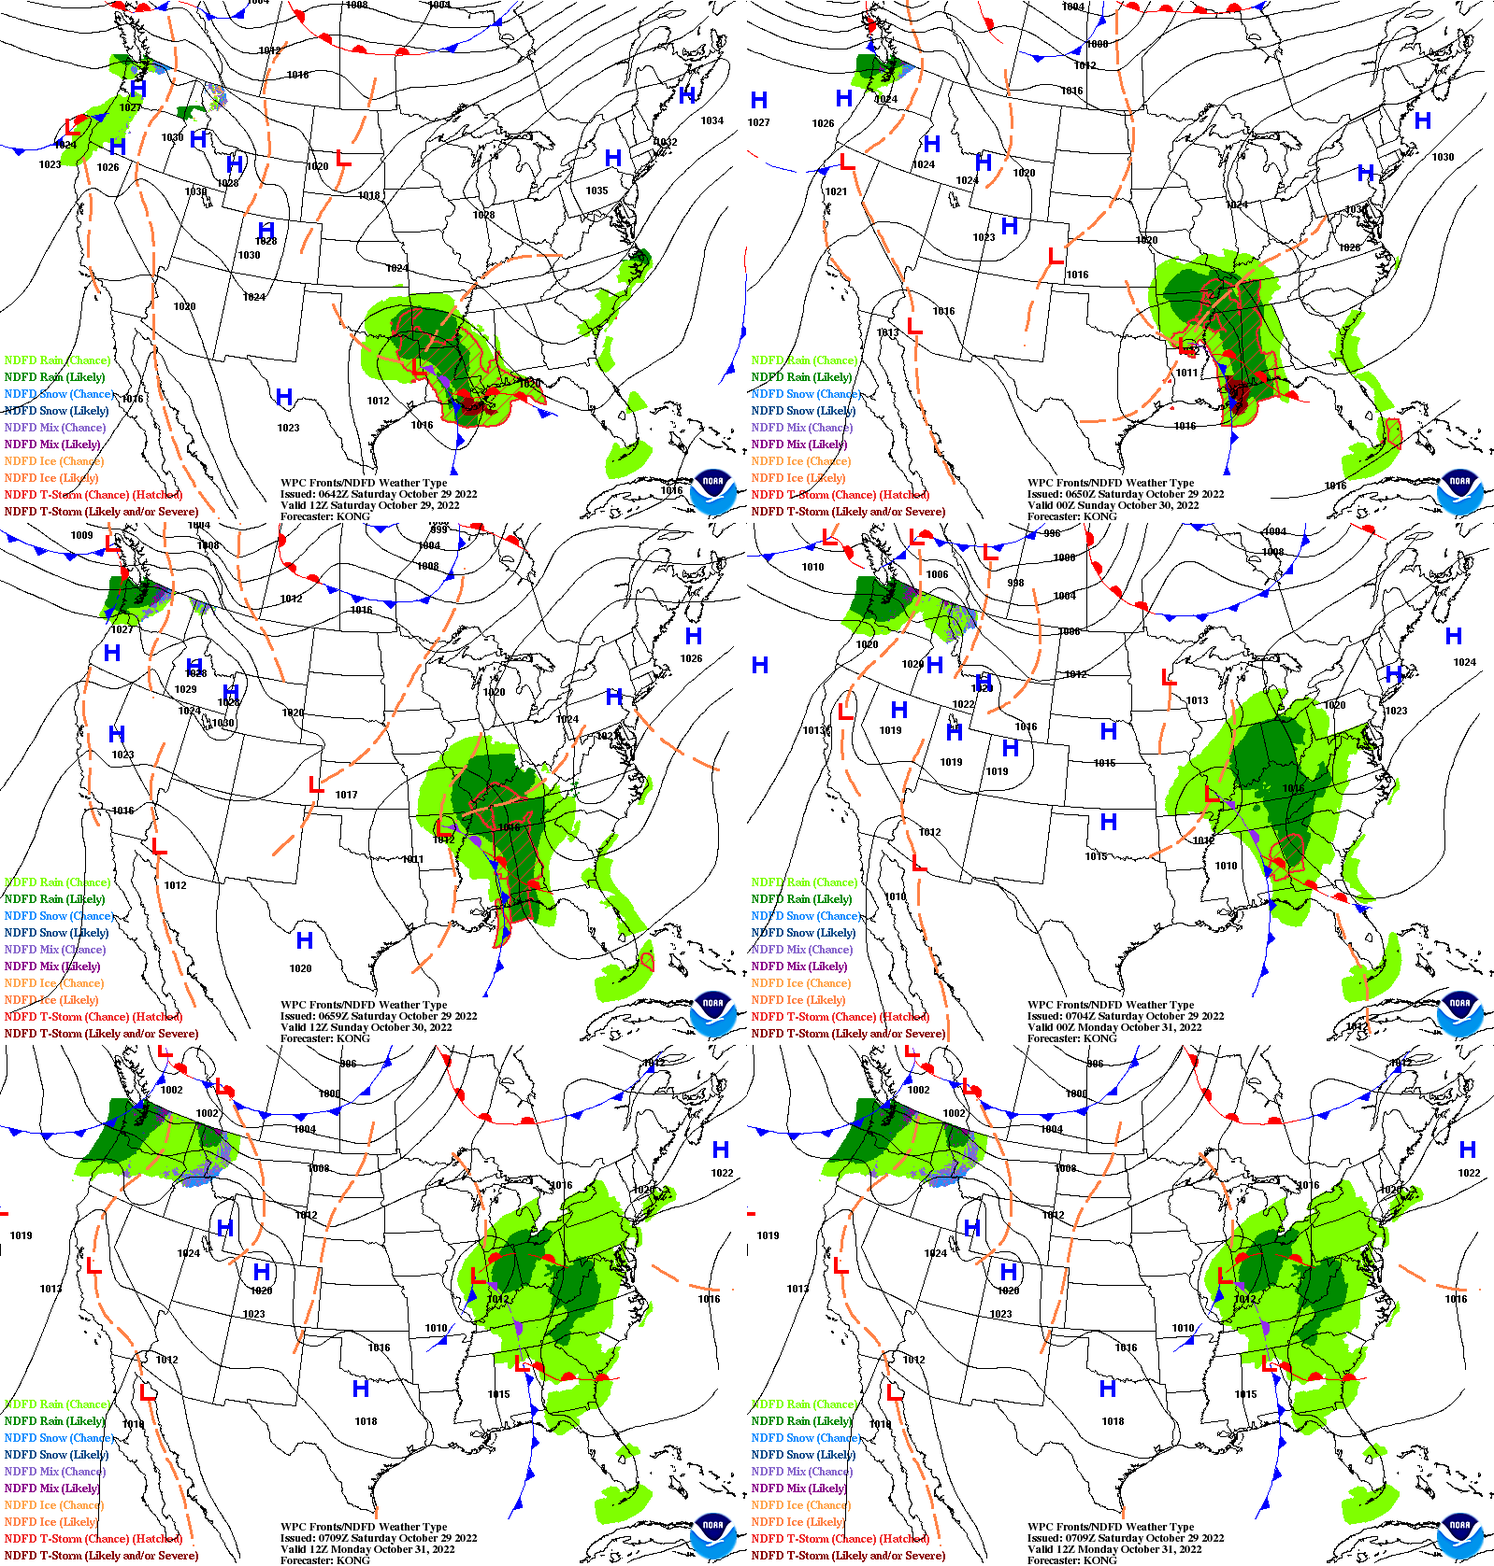
...The low pressure system will then spread unsettled weather into the
eastern U.S. Sunday and into Monday...

...Approaching frontal system will spread rain and high elevation snow
into the Pacific Northwest...

A low pressure system tracking through the southern tier of the country
will trigger additional showers and thunderstorms across the region today.
 The strongest thunderstorms with heavy downpours are forecast to be near
the central Gulf Coast region where a warm front and a cold front meet.
The threat of severe thunderstorms decreases farther to the north across
the Mississippi Valley.  However, a swath of moderate to heavy rain is
expected from eastern Arkansas into northwestern Mississippi where the low
pressure center is forecast to move through.  The rain will nonetheless
help to alleviate the ongoing moderate to severe drought across the
region.  While locally heavy rain is expected, the progressive nature of
the low pressure system will limit the threat of flash flooding.  By
Sunday, much of the active weather will shift northeastward into the
Tennessee and Ohio Valleys.  The threat of heavy rain and strong
thunderstorms are expected to gradually decrease in these areas as the low
pressure system slowly weakens.  By Monday morning, rain and a few
thunderstorms should reach into the central and southern Appalachians as
well as the lower Great Lakes.

Over the Pacific Northwest, the next round of precipitation is forecast to
reach the area on Sunday as a frontal system edges closer from offshore.
The precipitation will likely become heavy across the higher terrain of
the Olympic Mountains and the northern Cascades Sunday night where snow is
possible at the highest elevations.  Some of the precipitation could reach
into the northern Rockies by Monday morning.

The majority of the U.S. mainland should enjoy tranquil weather conditions
for this weekend into Monday as a couple of strong high-pressure systems
dominate the Intermountain West as well as the Northeast. Above-average
high temperatures are forecast to span the Northern Tier from the Plains
to New England, with highs into the 50s and 60s as we head into Halloween.
(It is updated twice a day and these updates can be found here.
Current forecast of heavy precipitation (Updates can be found HERE)
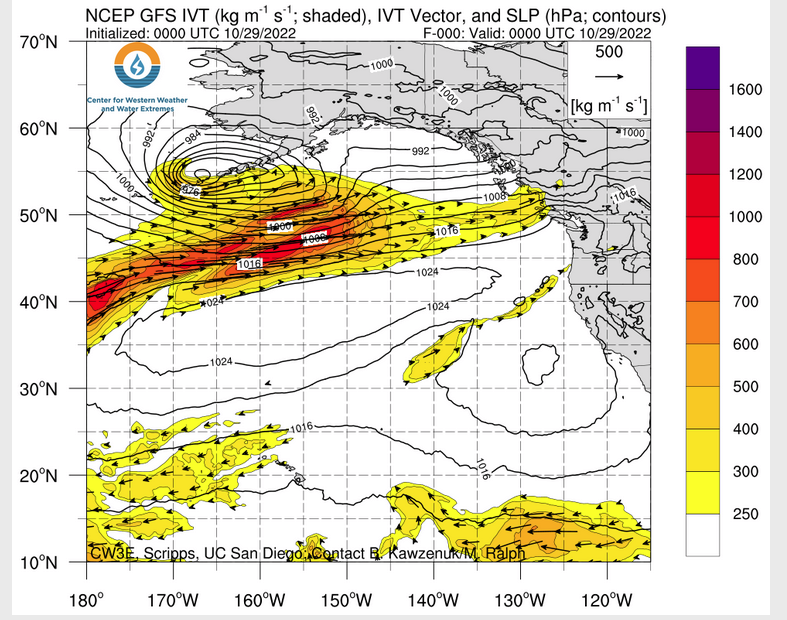
Click HERE to update. HERE is some useful information about Atmospheric Rivers.
Maps that relate the forecast to geography can be found by clicking Here for Day 1 and Here for Day 2.
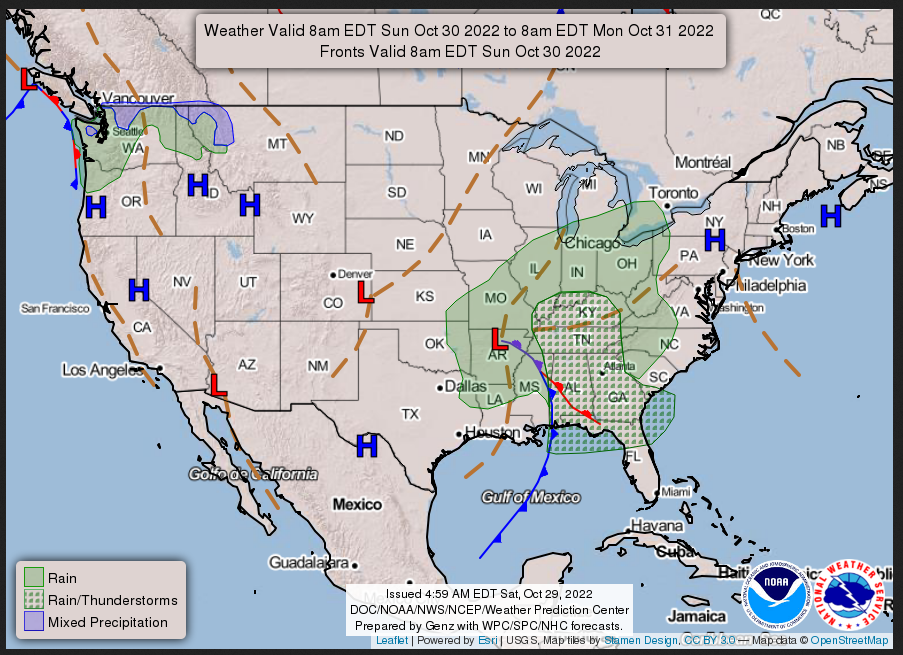
Here is a 60-hour animated forecast map that shows how the short-term forecast is expected to play out.
If it needs to be updated click here.
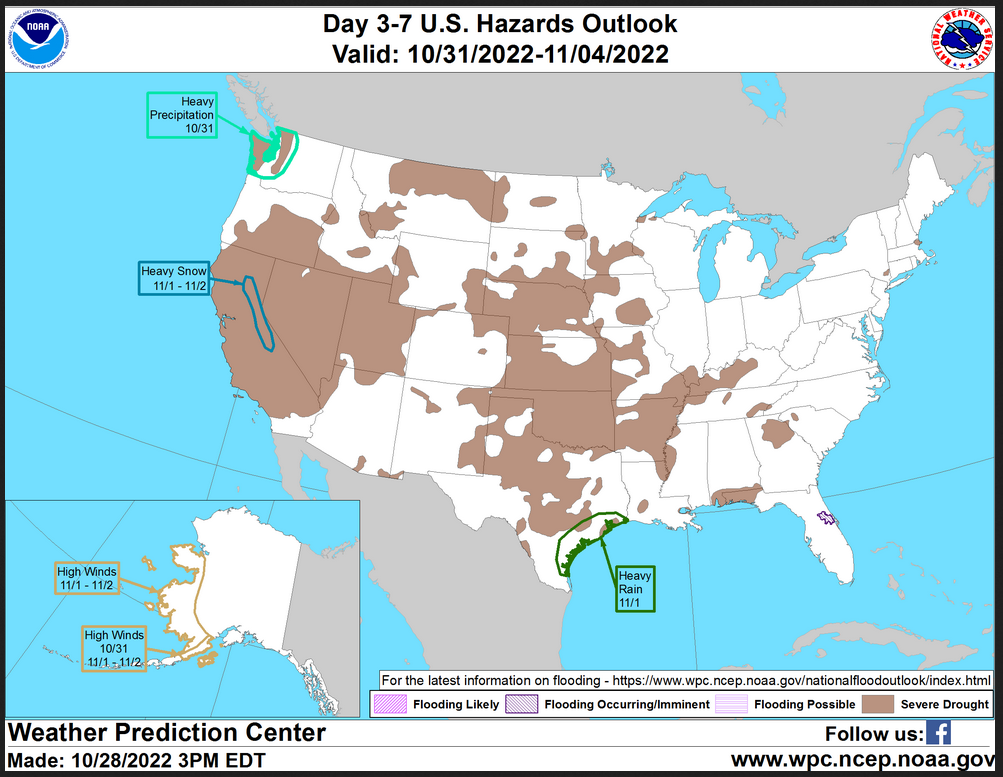
HAZARDS OUTLOOKS
Click here for the latest complete Day 3 -7 Hazards forecast which updates only on weekdays. Once a week probably Monday or Tuesday I will update the images. I provided the link for readers to get daily updates on weekdays. Use your own judgment to decide if you need to update these images.
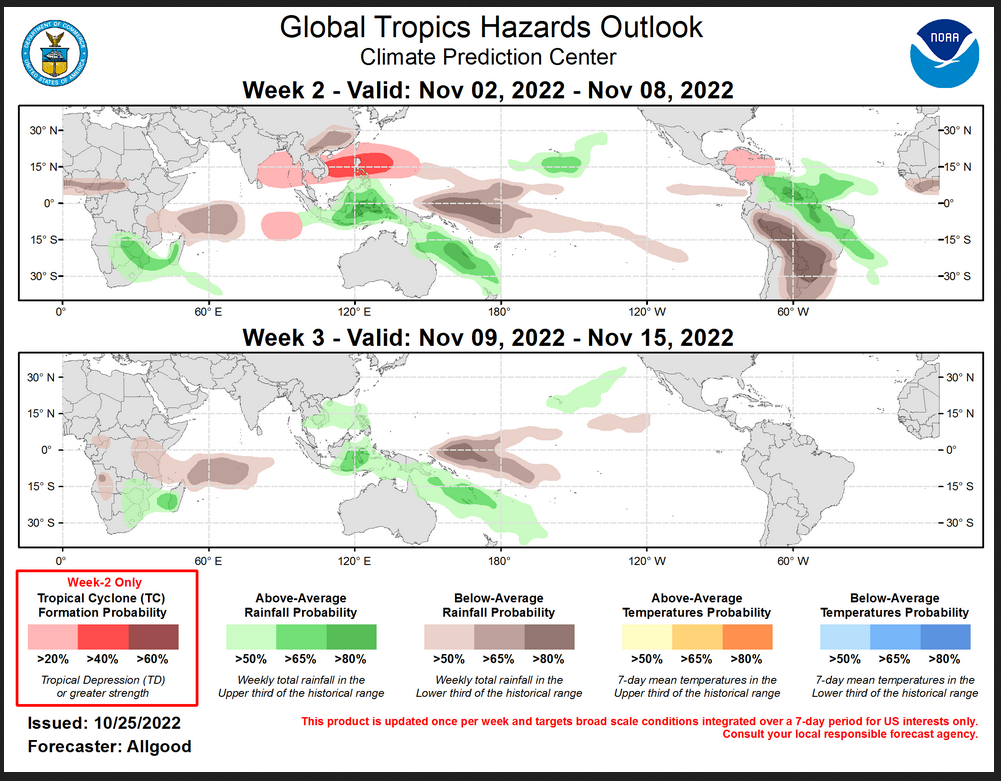
Worldwide Tropical Forecast
(This graphic updates on Tuesdays) If it has not been updated, you can get the update by clicking here
Detailed Maps and Reports.
Below are four maps that summarize the situation for the Atlantic, Eastern, Central Pacific and Western Pacific. Additional information can be accessed by clicking HERE
First the Atlantic
Click to view the forecast map and have access to additional information https://www.nhc.noaa.gov/gtwo.php ?basin=atlc&fdays=5
Then Eastern Pacific
Click to view the forecast map and have access to additional information https://www.nhc.noaa .gov/gtwo.ph p?basin=epac&fdays=5
Then Central Pacific
Click to view the forecast map and have access to additional information https://www.nhc.noaa.gov/gtwo.php?basin=cpac&fdays=5
And the Western Pacific
Click to view the forecast map and have access to additional information https://www.metoc.navy.mil/jtwc/jtwc.html
Updates and additional information can be accessed by clicking HERE
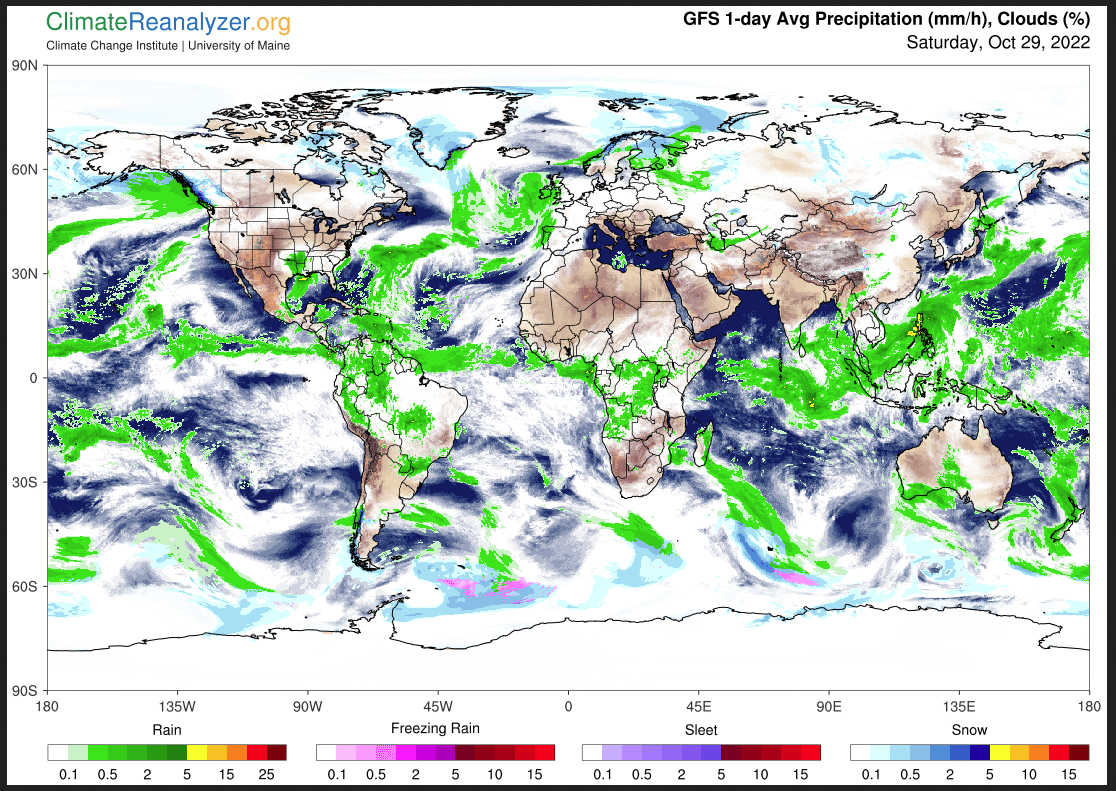
World Forecast
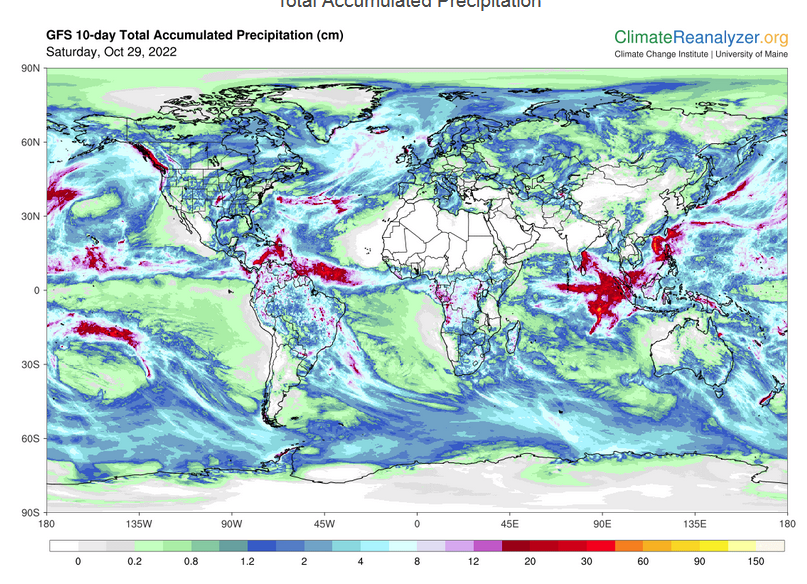
Below is the current or short-term precipitation forecast which can be updated by clicking H ERE Additional maps for different time frames and other aspects of weather in addition to precipitation can be obtained HERE.
Month to Date Information
Temperature month to date can be found at https://hprcc.unl.edu/products/maps/acis/MonthTDeptUS.png
Precipitation month to date can be found at https://hprcc.unl.edu/products/maps/acis/MonthPNormUS.png
