Here is what we are paying attention to this evening and the next 48 hours from this evening’s NWS Forecast.
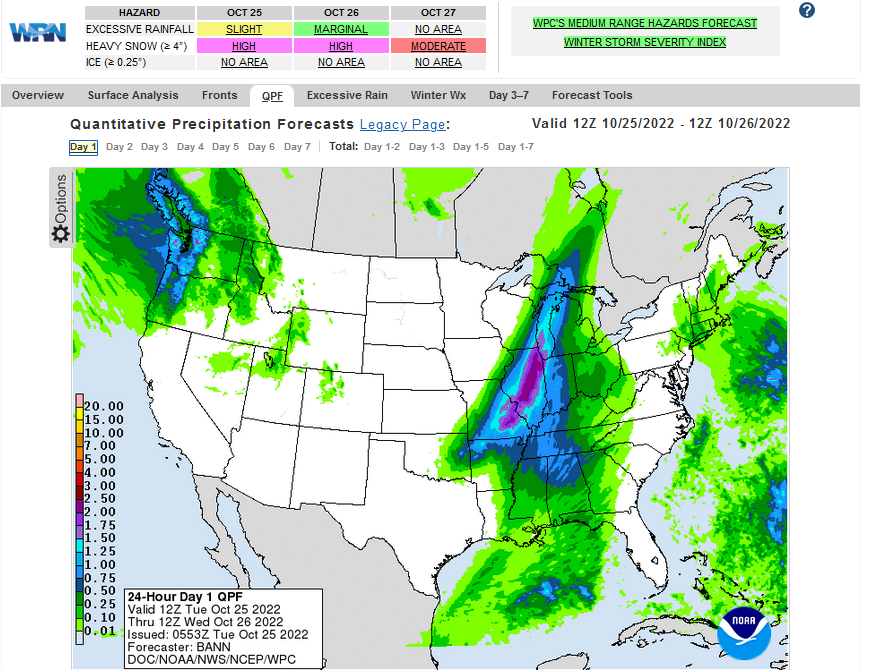
....There is a Slight Risk of severe thunderstorms over parts of the Lower
Mississippi/Tennessee Valleys and Southeast through Wednesday morning...

�There is a Marginal Risk of excessive rainfall over parts of the
Western Ohio Valley and Middle /Lower Mississippi Valley through Wednesday
morning...

...Snow for parts of the Cascades and the Northern Rockies...
Continuation of the NWS Short Range Forecast (It is updated twice a day and these updates can be found here.
On Tuesday, a front extending from the Upper Great Lakes to the Lower
Mississippi Valley will move slowly eastward off the East Coast by
Thursday morning. Showers and thunderstorms will develop along and ahead
of the boundary from the Ohio Valley to the Lower Mississippi
Valley/Southeast and rain over parts of the Great Lakes.

The system will produce showers and severe thunderstorms over the Lower
Mississippi/Tennessee Valleys and Southeast. Therefore, the SPC has issued
a Slight Risk of severe thunderstorms over parts of the Lower
Mississippi/Tennessee Valleys and Southeast through Wednesday morning. The
hazards associated with these thunderstorms are frequent lightning, severe
thunderstorm wind gusts, hail, and a few tornadoes.

In addition, rain will develop over parts of the Great Lakes/Ohio Valley.
The rain and showers/thunderstorms have the potential to produce heavy
rain over parts of the Middle Mississippi and Western Ohio Valleys.
Therefore, the WPC has issued a Marginal Risk of excessive rainfall with
these thunderstorms over parts of the Western Ohio Valley and Middle
/Lower Mississippi Valley through Wednesday morning. The associated heavy
rain will create localized areas of flash flooding, affecting areas that
experience rapid runoff with heavy rain.

The threat of severe thunderstorms and excessive rainfall ends as the
front moves eastward on Wednesday. However, rain will continue over parts
of the Great Lakes/Ohio Valley, moving into the Northeast by Wednesday
evening and will begin to taper off by Thursday. Moreover, showers and
thunderstorms will continue over parts of the Southeast on Wednesday and
move off the Southeast Coast by Thursday.

Meanwhile, weak low pressure and associated front over parts of the
Northeast will slowly dissipate on Tuesday morning. However, the rain will
gradually taper off yet linger into Wednesday.

Elsewhere, a front over the Northern Intermountain Region to Northern
California will slowly dissipate overnight Tuesday. The system produces
light rain and higher-elevation snow, with snow over the Northern Rockies.
The rain and higher elevation snow will continue over the Northwest into
the Northern Rockies on Wednesday as additional upper-level energy moves
onshore over the Northwest. Overnight Wednesday into Thursday morning,
snow will develop over parts of the Central Rockies. The snow will result
in reduced visibility and hazardous driving conditions. Therefore, the
winter weather has prompted Winter Weather Advisories over parts of the
Northern Rockies and Cascades.
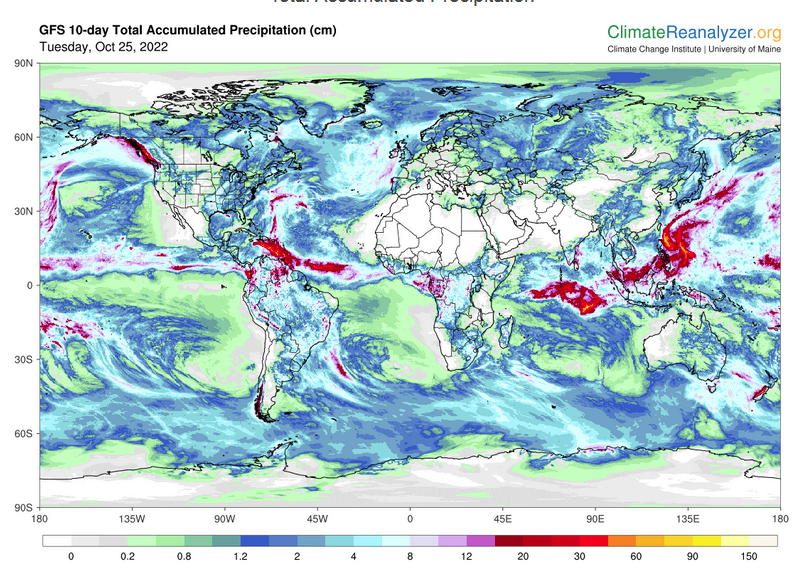
Current forecast of heavy precipitation (Updates can be found HERE)
Maps that relate the forecast to geography can be found by clicking Here for Day 1 and Here for Day 2.
Here is a 60-hour animated forecast map that shows how the short-term forecast is expected to play out
If it needs to be updated click here.
ATMOSPHERIC RIVERS
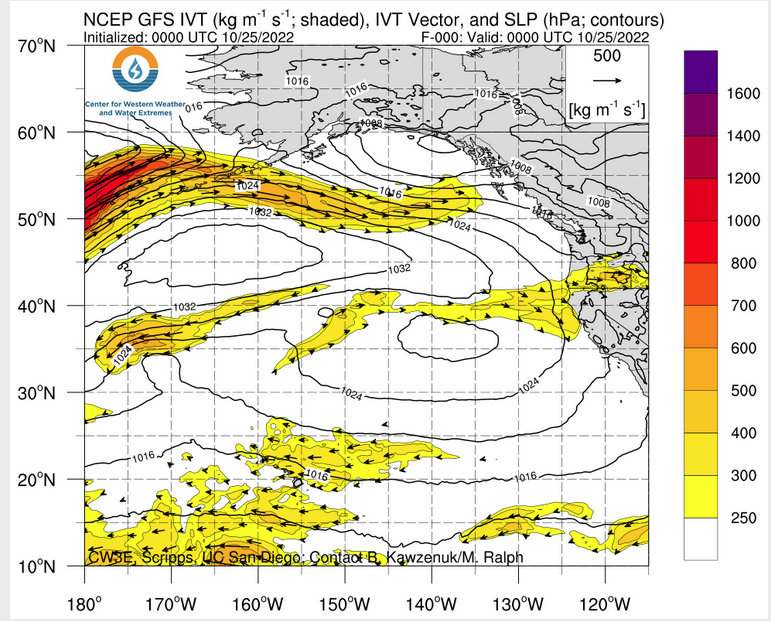
Click HERE to update. HERE is some useful information about Atmospheric Rivers.
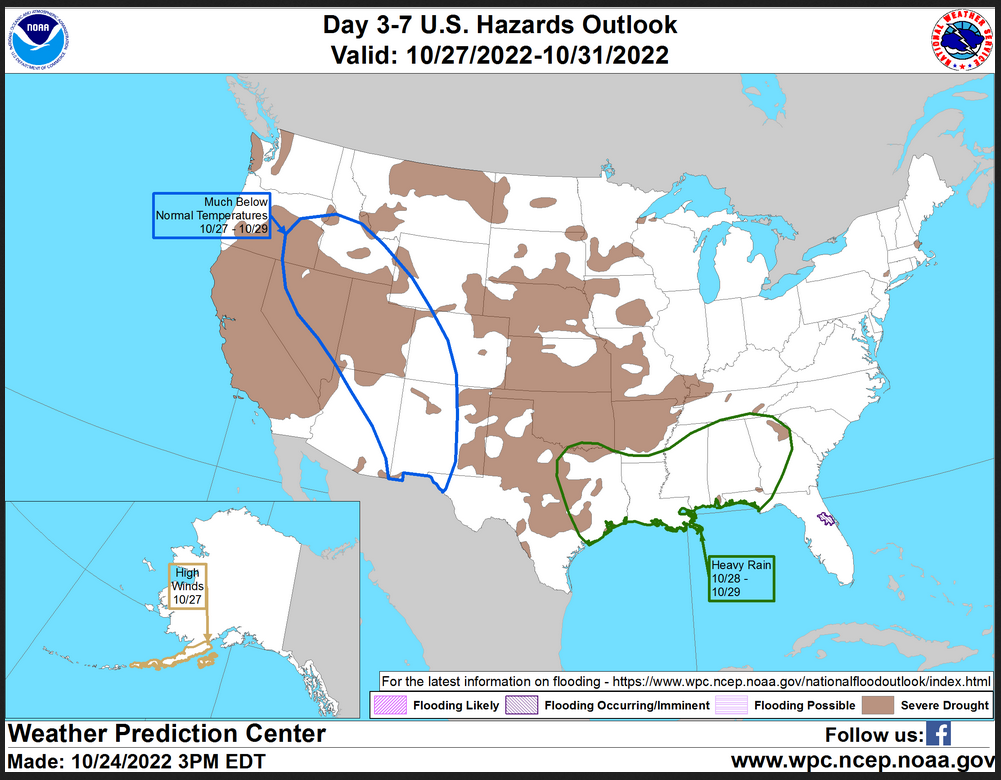
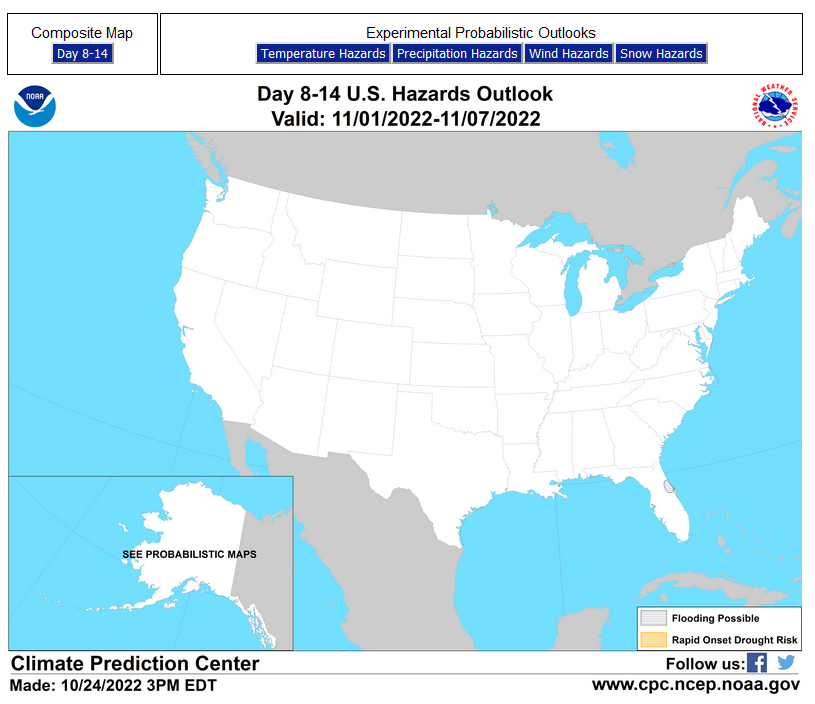
HAZARDS OUTLOOKS
Click here for the latest complete Day 3 -7 Hazards forecast which updates only on weekdays. Once a week probably Monday or Tuesday I will update the images. I provided the link for readers to get daily updates on weekdays. Use your own judgment to decide if you need to update these images.
Worldwide Tropical Forecast
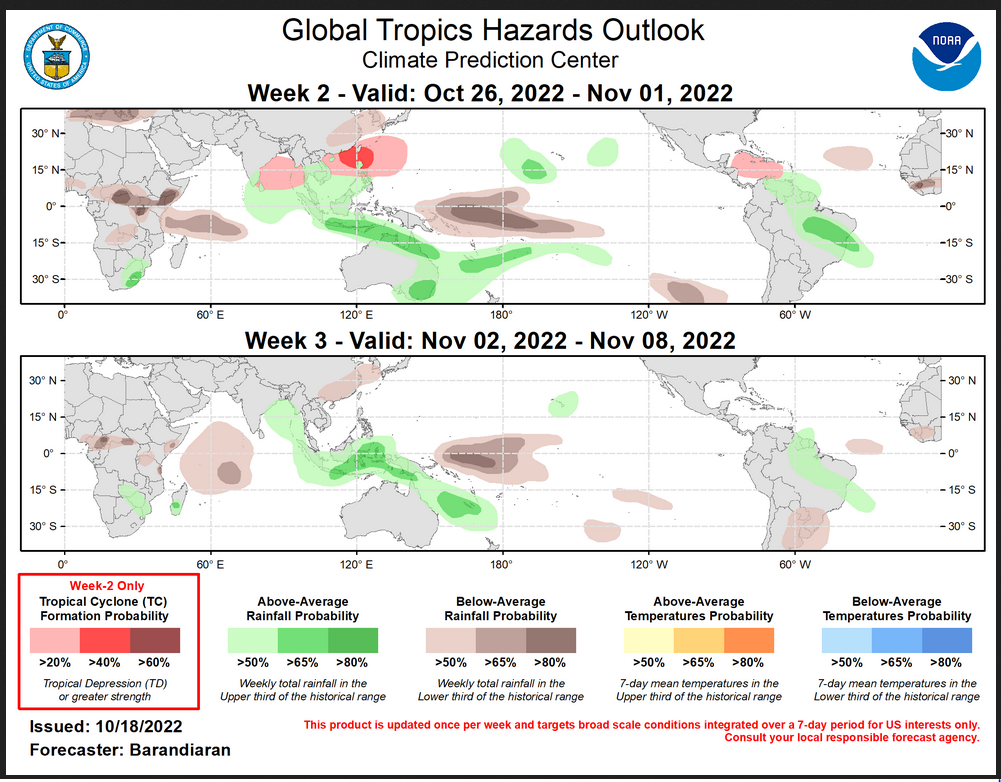
(This graphic updates on Tuesdays) If it has not been updated, you can get the update by clicking here This is a new approach and covers weeks 2 and 3 not weeks 1 and 2. It has more information but I am having trouble getting used to it. As usual, it comes with a discussion which is below
Detailed Maps and Reports for the Western Atlantic and the Pacific Oceans
Below are four maps that summarize the situation for the Atlantic, Eastern, Central Pacific, and Western Pacific. Additional information can be accessed by clicking HERE
First the Atlantic
Click to view the forecast map and have access to additional information https://www.nhc .noaa.gov/gtwo.php?basin= atlc&fdays=5
Then Eastern Pacific
Click to view the forecast map and have access to additional information https://www.nhc.noaa.gov/gtwo.php?basin=epac&fdays=5
Then Central Pacific
Click to view the forecast map and have access to additional information https://www.nhc.noaa.gov/gtwo.php?basin=cpac&fdays=5
And the Western Pacific
Click to view the forecast map and have access to additional information https://www.metoc.navy.mil/jtwc/jtwc.html
Some Intermediate-Term Outlooks
Links to “Outlook” maps and discussions for three time periods. Days 6 – 10, Days 8 – 14, and Weeks 3 and 4. An outlook differs from a forecast based on how NOAA uses these terms in that an “outlook” presents information from deviation from normal and the likelihood of these deviations.
You have to click on the links because they do not update automatically and I do not want to have stale images in the article. But it is not difficult to click on a link and you get a large image plus a discussion. On Fridays in a separate article, we will show the images and provide a link in this article that article. But remember what you will see is the images as of Friday. But here you can get the current images simply by clicking on them. Then hit the return arrow at the upper left of your screen to return to the article. You will not find this information easily anywhere else.

Right now you can find these maps here (We show them every Friday there but you can click above and find them).
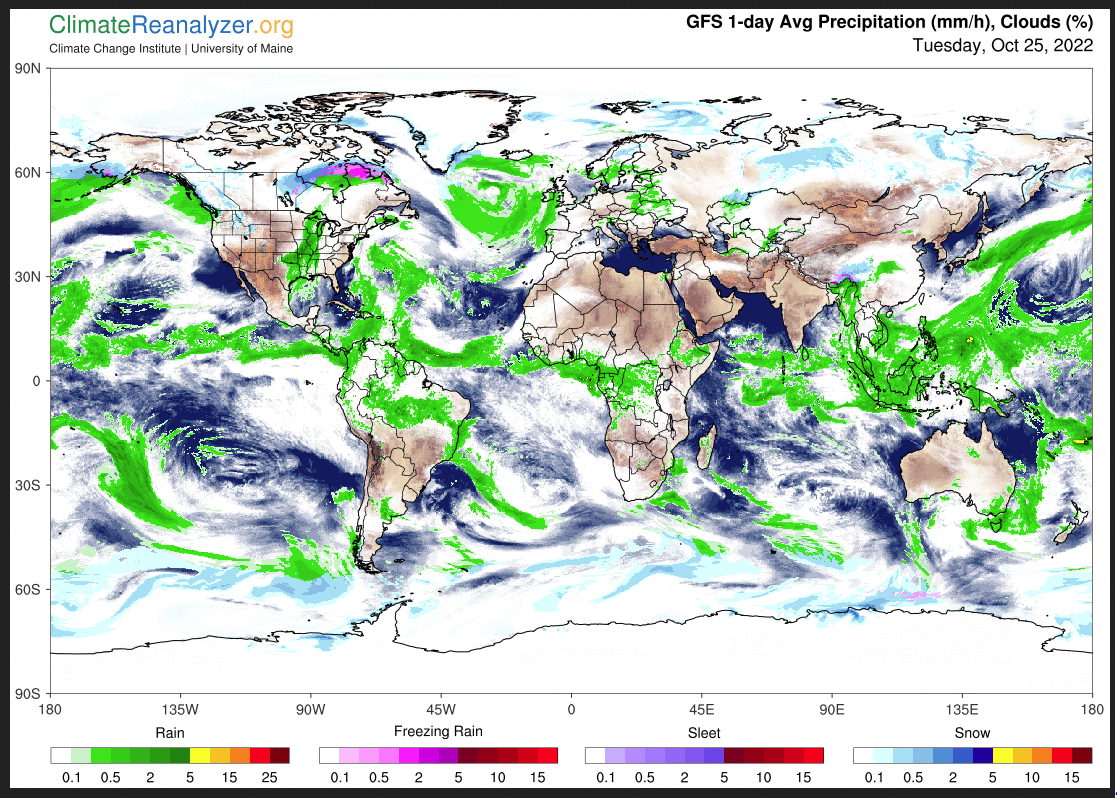
Worldwide Weather
Below is the current or short-term precipitation forecast which can be updated by clicking HERE Additional maps can be obtained HERE.
Month to Date Information
Month to date Temperature can be found at https://hprcc.unl.edu/products/maps/acis/MonthTDeptUS.png
Month to date Precipitation can be found at https://hprcc.unl.edu/products/maps/acis/MonthPNormUS.png