NOAA updates many of its weather outlooks daily or even more frequently and in many cases issues a discussion with those outlooks. We provide a daily report which focuses on the shorter-term predictions but also has links to all the partial-month outlooks. Because WordPress does not provide the ability to have these maps automatically updated, our daily report shows some of the maps which we update each evening plus the links to the other important weather forecast Maps.
Once a week we show many of the actual forecast maps not just provide the links to these maps. This makes it easier for the reader. Our report provides a separate forecast for Days1-5, Days 6 -10, Days 8 – 14, and weeks 3 and 4. This provides information that is useful to readers in terms of planning their activities for the next 28 days.
The week 3-4 outlook is only updated by NOAA’s Climate Prediction Service once a week on Friday. Thus, when we publish on Friday night, it provides a 28-day view of the future. What is important is that this is a longer-term view than one that is typically available in the media and online.
We also include In Part II of the article the other information from the daily 48-hour forecast article. Importantly, this time of the year, it includes updates on tropical events. In both Parts I and II we also include some worldwide forecasts.
It is important to recognize that the forecasts do not always work out as predicted. But in the article, there are links to obtain updated forecasts If you read this article a few days or more after it is published. And there will be a totally updated version next Friday.

What NOAA is predicting for the next 28 days.
We will start with the short-term – It is up to date as of today. If you look at this article after today you can click the links to update (plus you will end up with a lot of additional information)
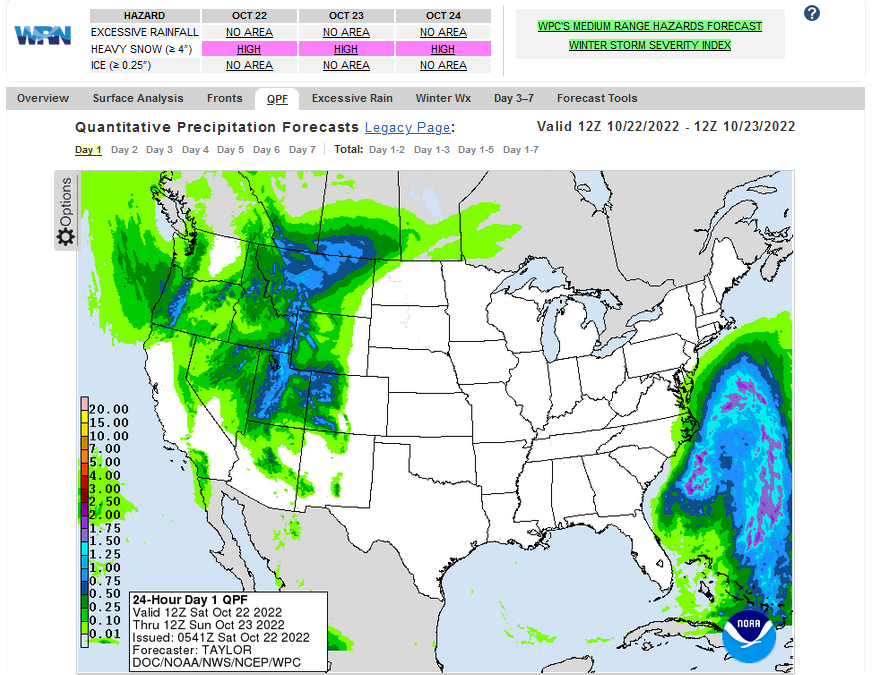
| Temperature (Maximum or Minimum Anomaly) for the next five days | Precipitation (Five days of cumulative precipitation) |
| https://www.wpc.ncep.noaa.gov/medr/me dr_mean.shtml | https://www.wpc.ncep.noaa.gov/qpf/day1-7.shtml |
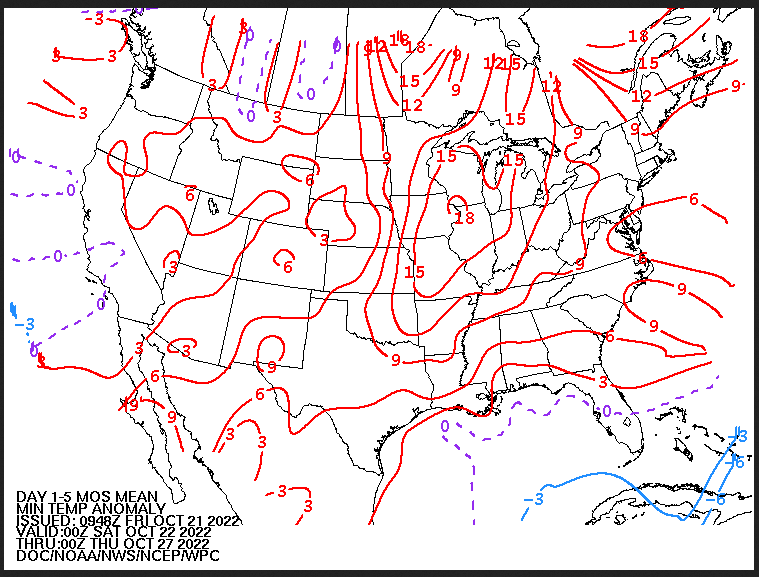
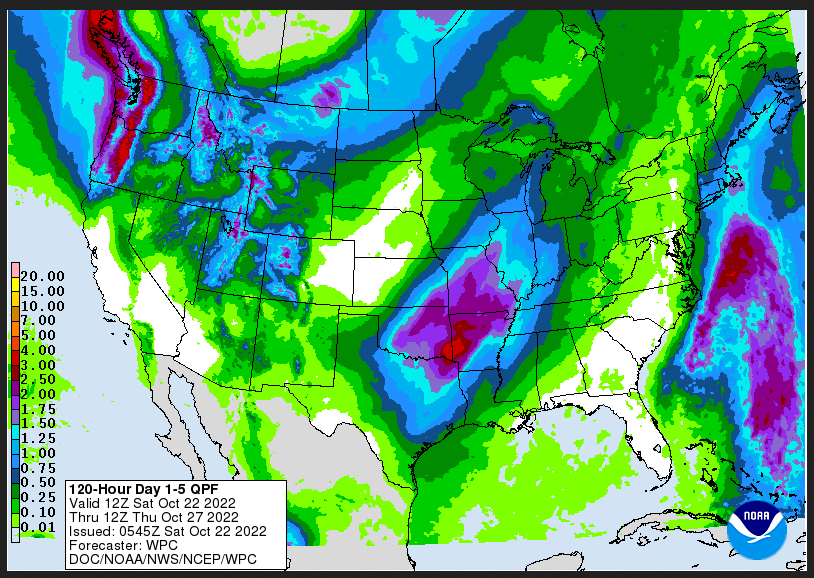
| Minimum temperatures warm everywhere but especially in Central Plains and precipitation is widespread. |
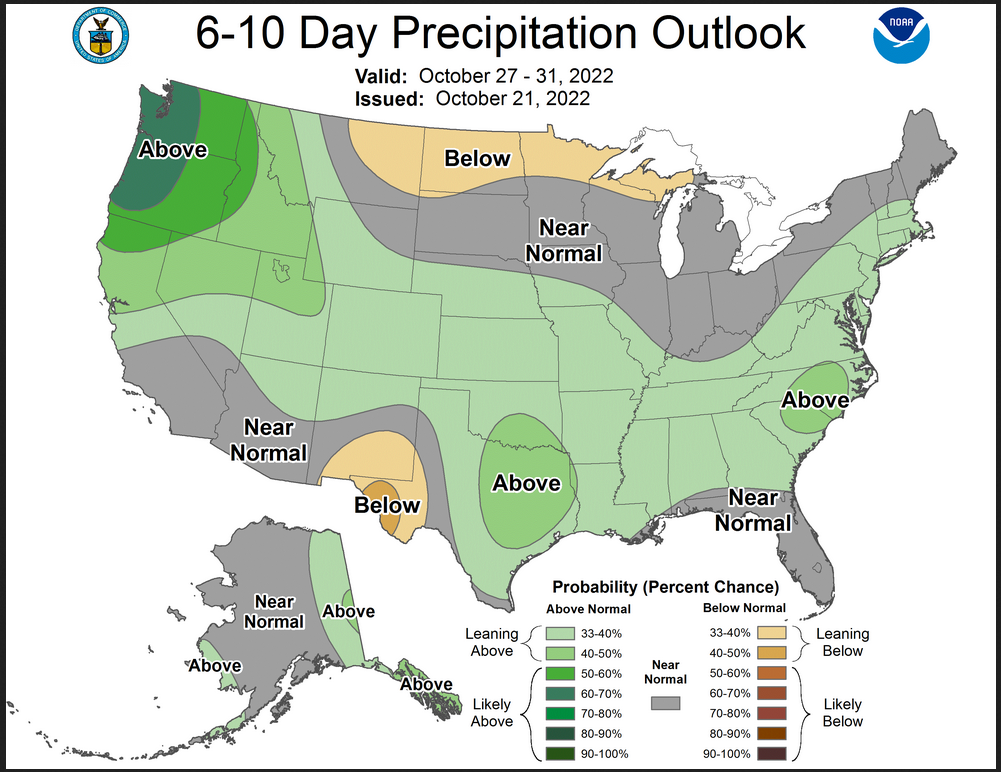
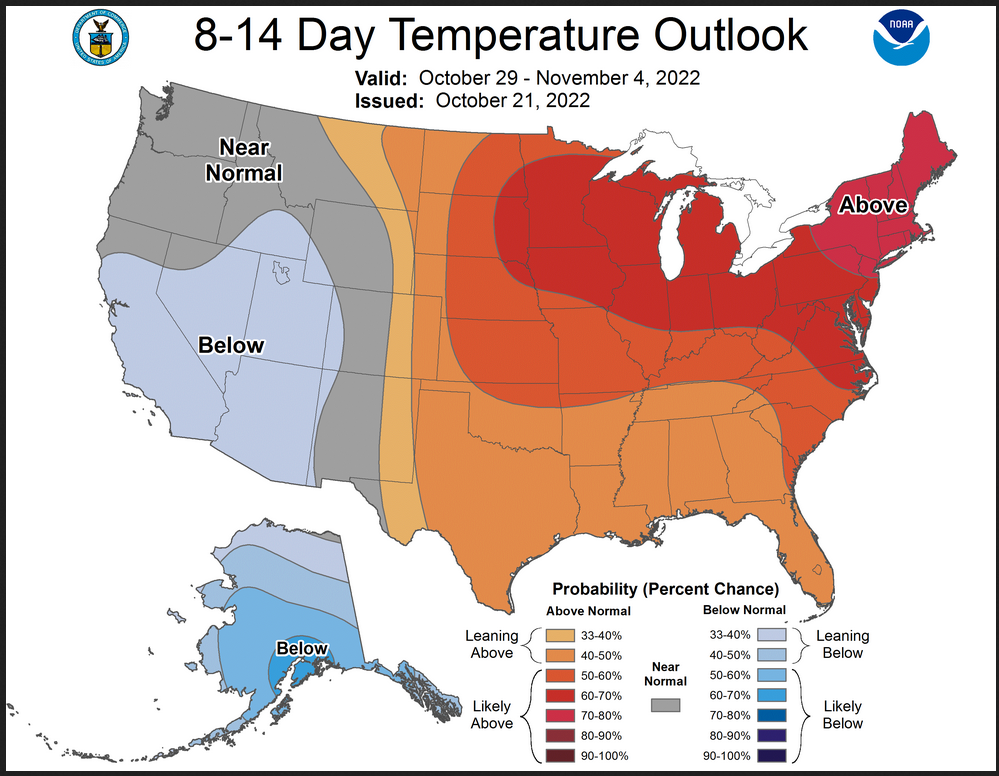
Now we look at “Outlook” maps for three time periods. Days 6 – 10, Days 8 – 14, and Weeks 3 and 4. An outlook differs from a forecast based on how NOAA uses these terms in that an “outlook” presents information as deviation from normal and the likelihood of these deviations.
I have provided the maps so you do not need to click to get them. But they do not update daily. But you can get the current images simply by clicking on the links provided. Then hit the return arrow at the upper left of your screen to return to the article. There is no need to do that right away since what is published today is up to date. The Week 3 – 4 Outlook only updates on Fridays.
Below are the links to obtain updates and additional information.
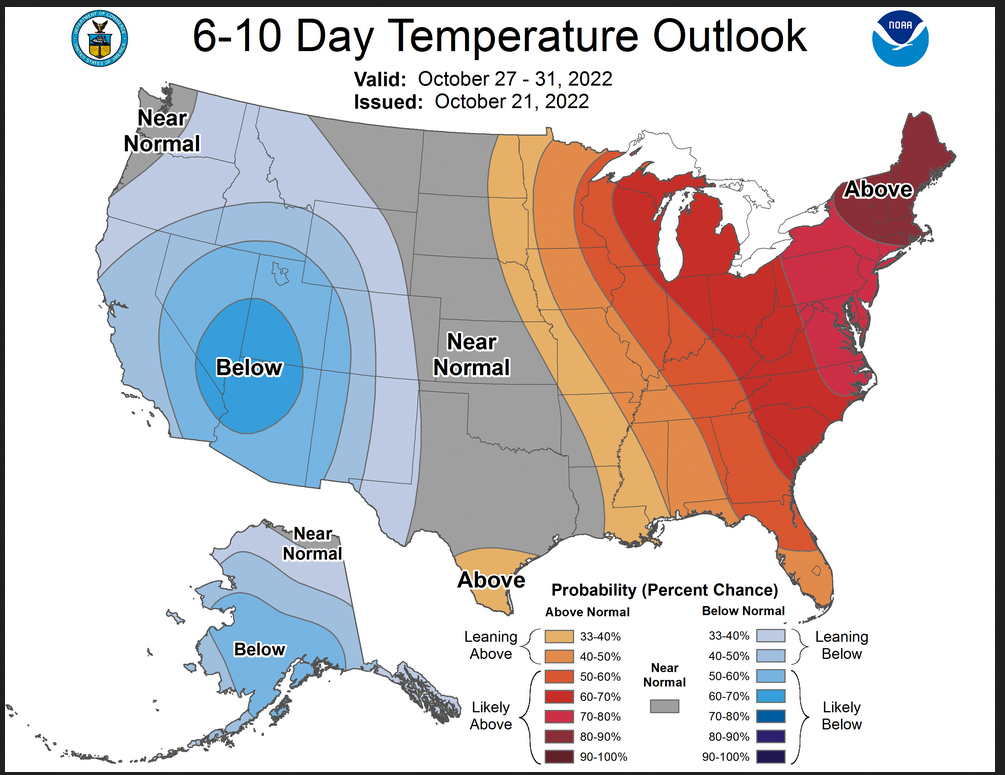
| The temperature has a west (cool) to east (warm) gradient. |
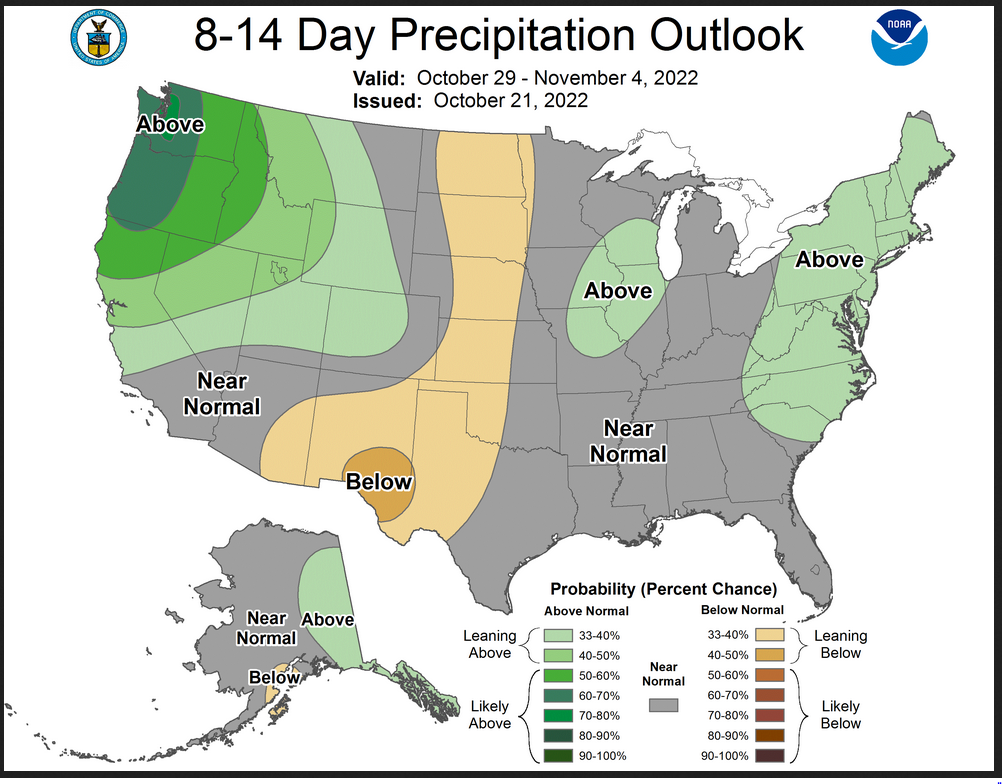
| Precipitation has declined. |
Now we address Weeks 3 and 4. This is a time frame that is very important. It is half of the 28-Day forecast period. That is why we include the discussion that accompanies the maps.
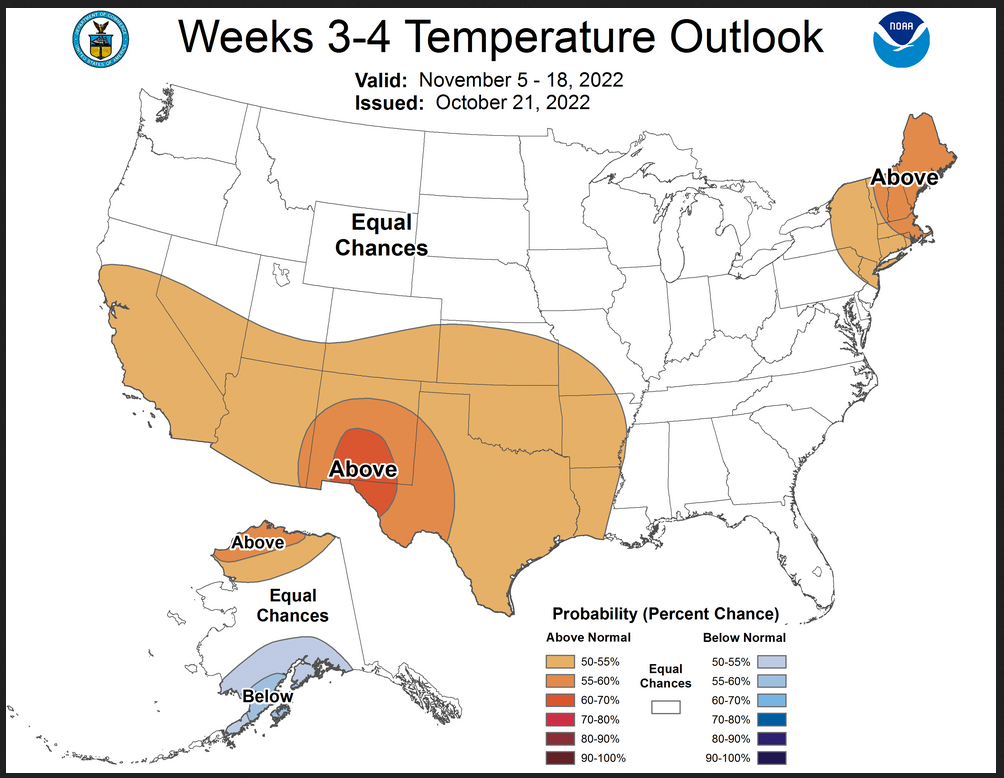
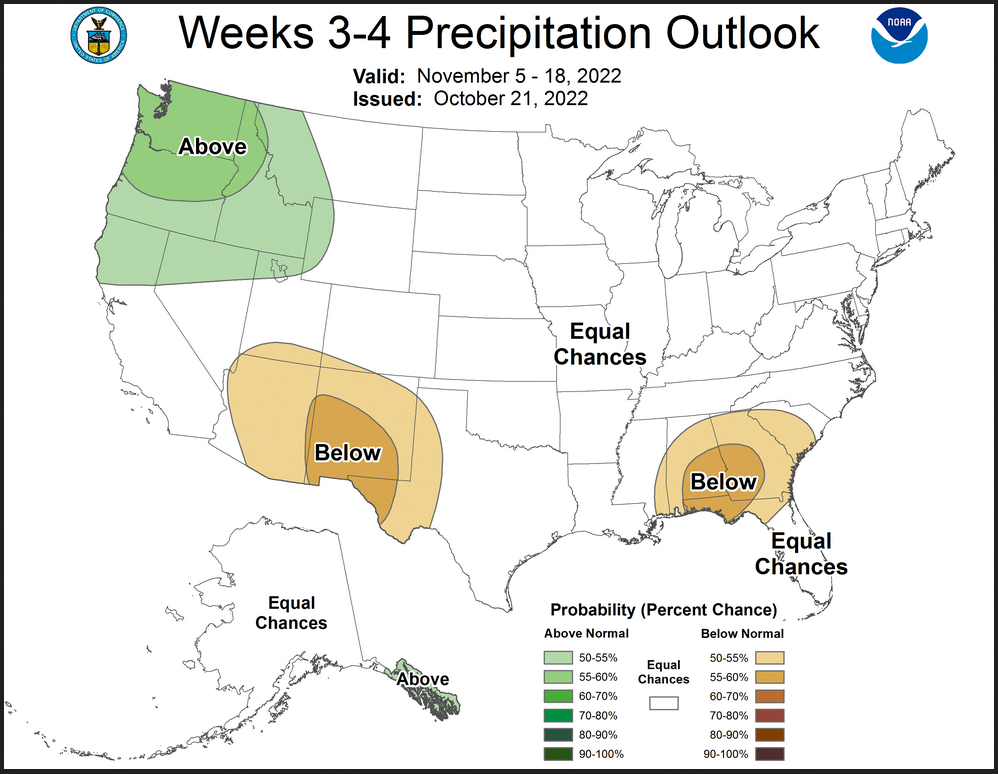
Prognostic Discussion for Week 3-4 Temperature and Experimental Precipitation Outlooks
NWS Climate Prediction Center College Park MD
300PM EDT Fri Oct 21 2022Week 3-4 Forecast Discussion Valid Sat Nov 05 2022-Fri Nov 18 2022
La Niña conditions persist across the tropical Pacific with sea surface temperature (SST) departures below average across most of the tropical Pacific Ocean and reaching -0.8 celsius in the NINO3.4 region. The tropical atmosphere remains consistent with La Niña. While there was some eastward propagation of the Madden Julian Oscillation (MJO) in recent weeks in the observed and forecasted Realtime Multivariate MJO (RMM), forecasts of the RMM from the Global Ensemble Forecast System (GEFS) and European Centre for Medium-Range Weather Forecast (ECMWF) models favor a stagnating signal. Temperature and Precipitation Outlooks this week rely primarily on dynamical model forecasts from the Climate Forecast System version 2 (CFSv2), GEFSv12, ECMWF, and Japan Meteorological Agency (JMA) models, the Subseasonal Prediction Experiment (SubX) multimodel ensemble (MME), and persistence from the Week 2 period. Expected impacts from La Niña, decadal trends, and MJO are considered via Multiple Linear Regression (MLR) guidance.
Following a likely transient height pattern in Week 2, dynamical model Week 3-4 500hPa height predictions are somewhat inconsistent. 500hPa heights forecasts from ECMWF, JMA, and GEFSv12 favor troughing over the Gulf of Alaska, though the southward extent of the trough varies, reaching into parts of Northern California in GEFSv12 but remaining more northward in the other models. In contrast, the trough is displaced westward in CFSv2 over the Aleutians, and CFSv2 indicates ridging over Alaska and much of the western contiguous United States (CONUS). 500hPa heights are also inconsistent over CONUS, with ECMWF and GEFS forecasting neutral to slightly above normal heights, and JMA forecasting troughing over the eastern CONUS. CFSv2 and ECMWF favor ridging over the southwest. A manual blend of MLR, ECMWF, GEFS, CFSv2, and JMA favors troughing over the Gulf of Alaska and into the Pacific Northwest, neutral heights over much of CONUS, and ridging over New England. Overall the 500hPa heights point to a transient pattern over the CONUS that is expected to be uncertain moving into the Week 3-4 period.
Given the transient and inconsistent height pattern over the CONUS, dynamical model forecasts are inconsistent on forecasts of Week 3-4 temperature. Nevertheless, there is agreement among calibrated ECMWF, JMA, GEFS, and the SubX MME on above normal temperatures over the southwestern CONUS. The highest probabilities of above normal temperatures are over New Mexico and parts of eastern Texas consistent with ridging in CFSv2 and ECMWF, as well as decadal trends and weak impacts from La Niña. Elevated probabilities of above normal temperatures are indicated over New England where dynamical model forecasts from ECMWF, JMA, GEFS, and the SubX MME are consistent and there is ridging favored in ECMWF and GEFS. These regions of elevated above normal probabilities are indicated in a manual blend of MLR, ECMWF, GEFS, CFSv2, and JMA. Equal chances (EC) of above and below normal temperatures are indicated in the Pacific Northwest given uncertainty of the extent of troughing as well as potential for forecasted ridging from CFSv2. EC is also indicated for a large swath of the eastern CONUS where models were inconsistent, with CFSv2 favoring a broad area of below normal temperatures, and remaining models tilting weakly warm.
Given the good agreement on troughing over the Gulf of Alaska and associated below normal temperatures in dynamical models, as well as expected impacts from La Niña, below normal temperature probabilities are favored for the Southern Coast and parts of the Southern Interior of Alaska. Above normal temperature probabilities are indicated over the North Slope of Alaska where decadal trends are strong and consistent with above normal SST anomalies.
Elevated probabilities of above median precipitation are indicated for the Alaska Panhandle and Pacific Northwest given a very consistent signal among the dynamical models and under favored troughing in ECMWF, JMA, and GEFS. Probability of below median temperatures are favored for the desert Southwest, consistent with the region of highest above normal temperature probabilities. JMA, GEFS, the SubX MME, and the MLR tool favor a tilt toward below median precipitation over parts of the Gulf States, consistent with La Niña impacts. Equal chances of above and below median precipitation is indicated where there are weak or conflicting signals among models over Alaska, the Plains, Great Lakes, and New England.
The SubX MME favors above normal temperature probabilities over Hawaii consistent with above average SST anomalies, and elevated probabilities are indicated across Hawaii. Precipitation predictions in the SubX MME are less consistent, but overall favor a slight tilt toward above median precipitation in Hilo, Kahului, and Lihue.
| It is important to note that the Week 3 -4 Outlook is prepared by a different team than the 6 -10 and 8 – 14 day Outlooks as well as the update of the monthly outlook. |
Now switching over to Part II of this article which is our regular 48-Hr Forecast which also includes links for tropical updates and in some cases the NHC maps for storms that are near-term threats.
Here is what we are paying attention to today and the next 48 hours from this morning’s NWS Forecast.
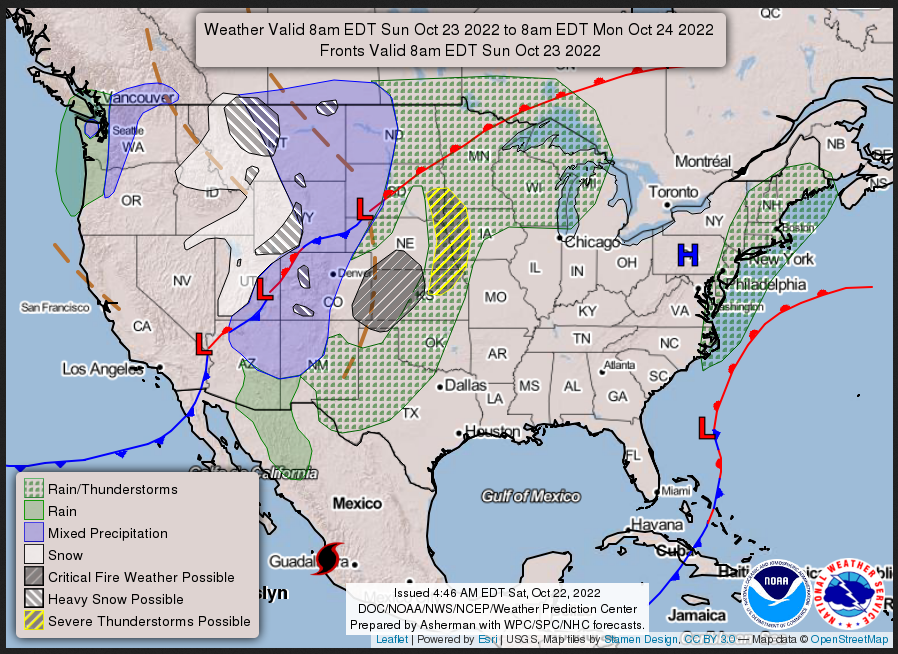
...Early season heavy wet snow event for higher elevations from parts of
the Cascades to the Northern/Central Rockies and the eastern Great Basin...

...Temperatures will be 10 to 25 degrees above average over parts of the
Plains and Upper/Middle Mississippi Valley...

...There is a Critical Risk of fire weather over parts of the Central
Plains...

On Saturday, a front extending from the Northern Rockies southwestward to
Northern California will move south and eastward to the Upper Mississippi
Valley to Southern Plains by Monday. In addition, an upper-level low will
develop over the Rockies associated with the front by Sunday into Monday.
The rain and higher-elevation wet snow will develop over the Pacific
Northwest into the Northern Rockies. On Saturday evening, the rain and
higher-elevation wet snow will expand into parts of the Great Basin and
Central Rockies and continue into Sunday. The higher-elevation snow will
result in reduced visibility and hazardous driving conditions. The winter
weather has prompted Winter Storm Warnings and Winter Storm Watches over
parts of the Northern Rockies into the Eastern Great Basin through Sunday
morning.

Ahead of the front, Temperatures will be 10 to 25 degrees above average
over parts of the Plains and Upper/Middle Mississippi Valley. Overnight
Saturday, moisture from the Western Gulf of Mexico will stream northward
into the Upper Mississippi Valley. As the front interacts with the
moisture, late Sunday showers and severe thunderstorms will develop.
Therefore, the SPC has issued a Slight Risk of severe thunderstorms over
parts of the Middle Missouri Valley from Sunday into Monday morning. The
hazards associated with these thunderstorms are frequent lightning, severe
thunderstorm wind gusts, hail, and a few tornadoes.

In addition, dry strong gusty wind and low relative humidity will create
dangerous fire weather conditions over parts of the Central High Plains on
Sunday. Therefore, the SPC has issued a Critical Risk of fire weather over
parts of Central High Plains on Sunday through Monday morning.

Overnight Sunday, showers and thunderstorms will develop over parts of the
Southern Plains and Middle/Lower Mississippi Valley producing heavy rain
on Monday. Therefore, the WPC has issued a Slight Risk of excessive
rainfall with these thunderstorms on Monday over parts of the Southern
Plains and Middle/Lower Mississippi Valley. The associated heavy rain will
create mainly localized areas of flash flooding, with urban areas, roads,
and small streams the most vulnerable.

Meanwhile, weak low pressure and associated front off the Southeast Coast
will steer moisture into the Southeast/Mid-Atlantic, producing light rain
over parts of the North Carolina Coast and parts of southeastern Virginia
by Saturday evening. On Sunday, moisture from the Western Atlantic will
stream into New England, producing rain over the region from Sunday
afternoon into Monday.
(It is updated twice a day and these updates can be found here.
Current forecast of heavy precipitation (Updates can be found HERE)
Maps that relate the forecast to geography can be found by clicking Here for Day 1 and Here for Day 2. (I will update these on Saturday morning so they will be current at that point).
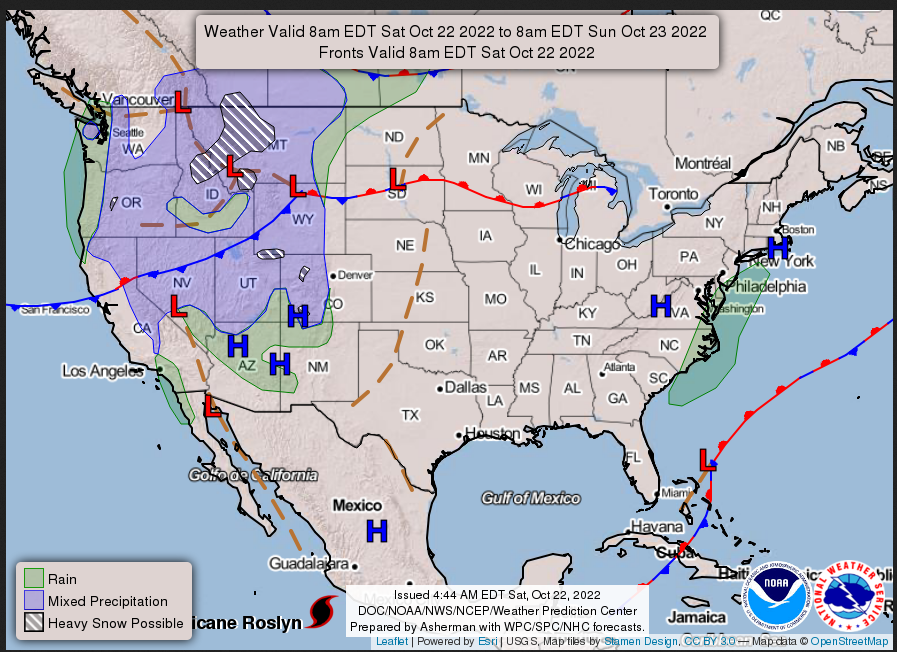
Here is a 60-hour animated forecast map that shows how the short-term forecast is expected to play out.
If it needs to be updated click here.
HAZARDS OUTLOOKS
Click here for the latest complete Day 3 -7 Hazards forecast which updates only on weekdays. Once a week probably Monday or Tuesday I will update the images. I provided the link for readers to get daily updates on weekdays. Use your own judgment to decide if you need to update these images.

Worldwide Tropical Forecast
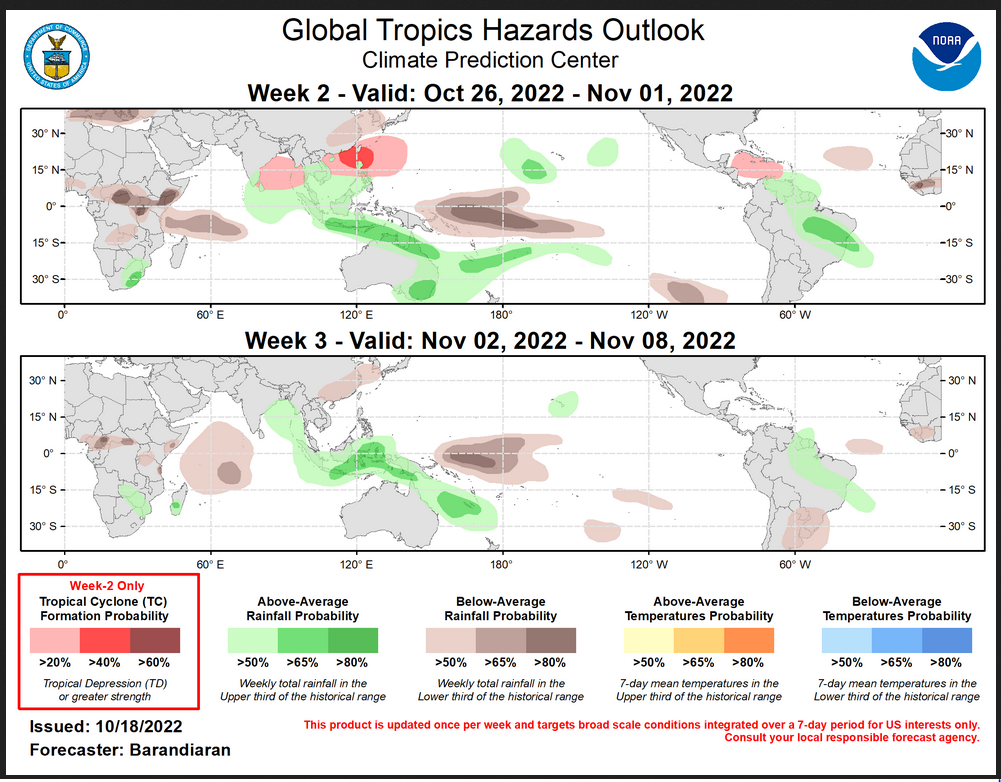
(This graphic updates on Tuesdays) If it has not been updated, you can get the update by clicking here
Detailed Maps and Reports.
Below are four maps that summarize the situation for the Atlantic, Eastern, Central Pacific and Western Pacific. Additional information can be accessed by clicking HERE
First the Atlantic
Click to view the forecast map and have access to additional information https://www.nhc.noaa.gov/gtwo.php ?basin=atlc&fdays=5
Then Eastern Pacific
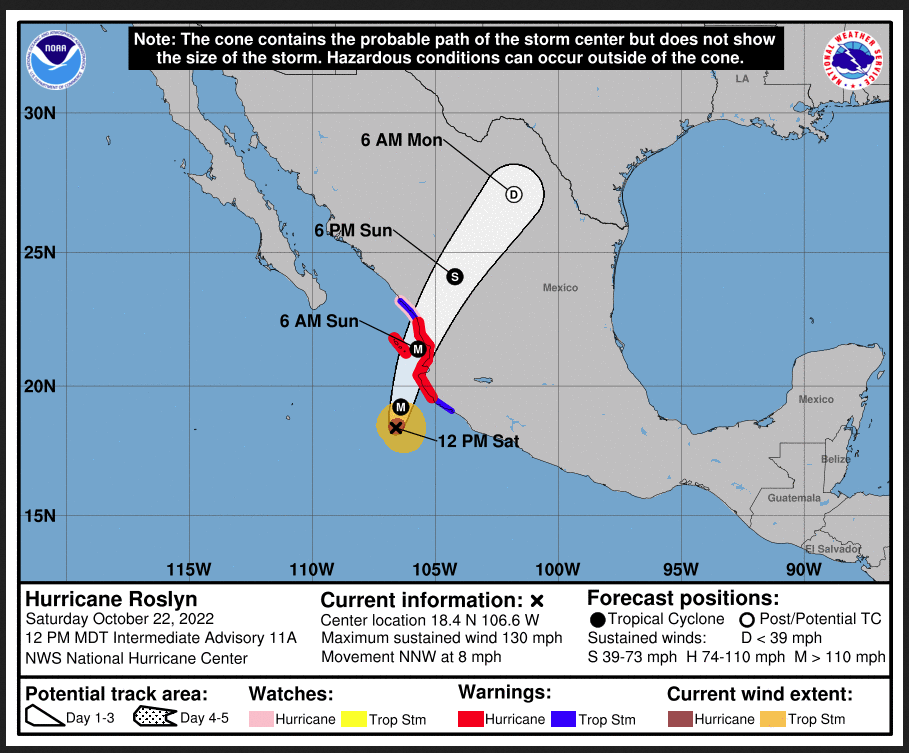
Click to view the forecast map and have access to additional information https://www.nhc.noaa .gov/gtwo.ph p?basin=epac&fdays=5
Then Central Pacific
Click to view the forecast map and have access to additional information https://www.nhc.noaa.gov/gtwo.php?basin=cpac&fdays=5
And the Western Pacific
Click to view the forecast map and have access to additional information https://www.metoc.navy.mil/jtwc/jtwc.html
Updates and additional information can be accessed by clicking HERE
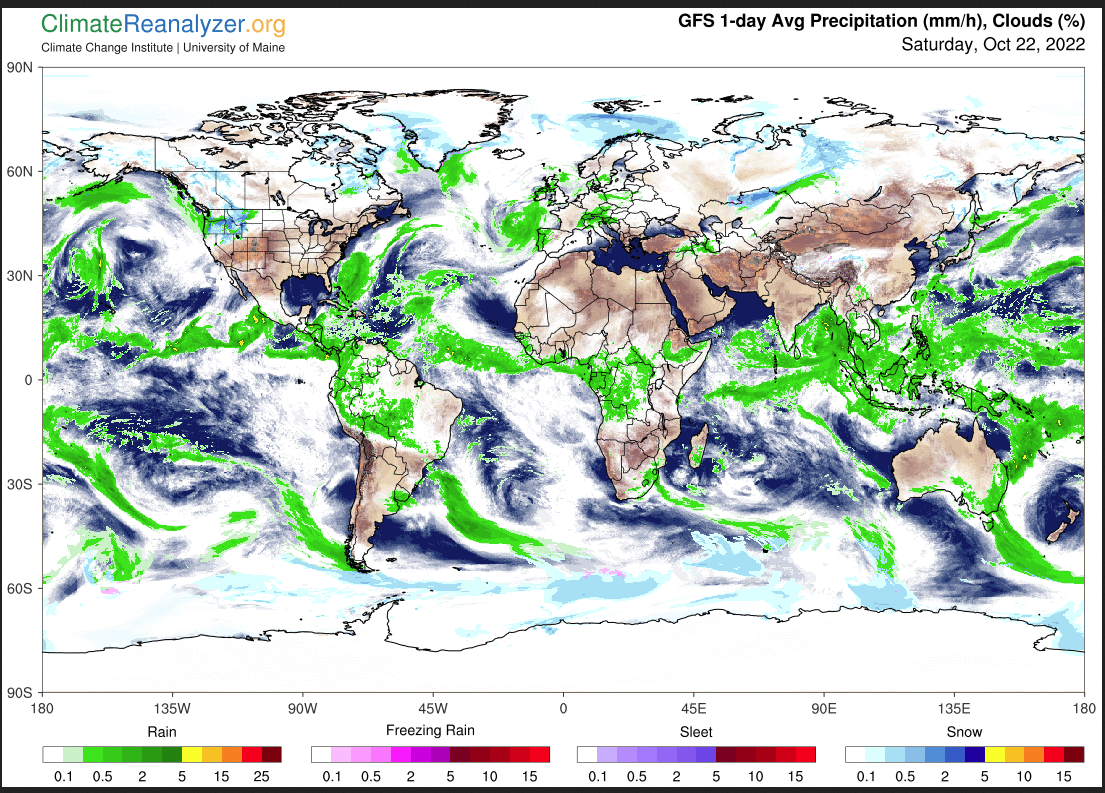
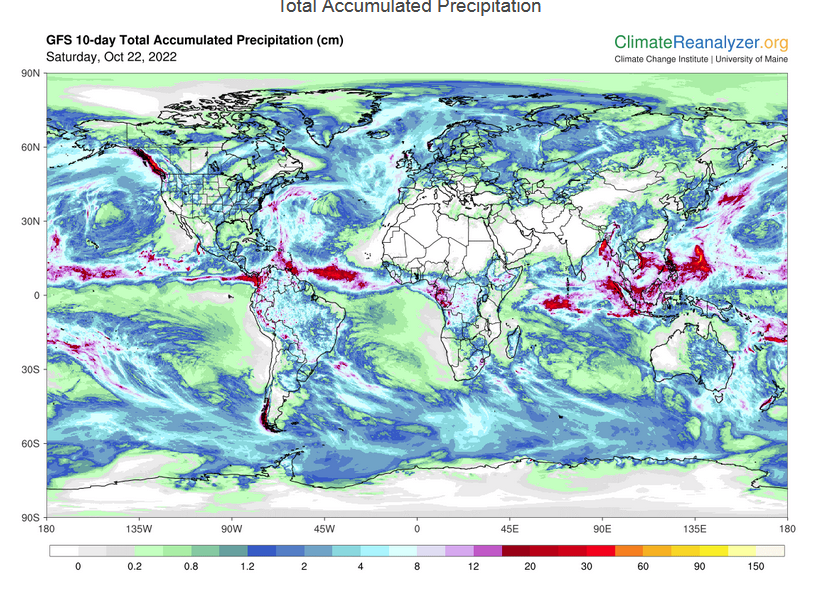
World Forecast
Below is the current or short-term precipitation forecast which can be updated by clicking HERE Additional maps for different time frames and other aspects of weather in addition to precipitation can be obtained HERE.
Month to Date Information
Temperature month to date can be found at https://hprcc.unl.edu/products/maps/acis/MonthTDeptUS.png
Precipitation month to date can be found at https://hprcc.unl.edu/products/maps/acis/MonthPNormUS.png

