Here is what we are paying attention to this morning and the next 48 hours from this morning’s NWS Forecast.
...Widespread record tying/breaking morning lows will bring first freeze
of the season to portions of the Midwest and South...

...Wintry precipitation continues for the Great Lakes Region...

...Heavy rain forecast for Maine on Tuesday, with scattered instances of
flash flooding possible...
Continuation of the NWS Short Range Forecast (It is updated twice a day and these updates can be found here.
A deep upper-level low pressure system currently sits over the Great Lakes
as a strong cold front continues to push south and east of the Gulf and
Atlantic coasts, leading to a combination of chilly, well below normal
temperatures for much of the eastern 2/3rds of the country, as well as
wintry precipitation for the Great Lakes. A cold continental airmass has
begun to settle in as high pressure builds southward over the central and
southern U.S. Widespread, well-below normal high and low temperatures are
forecast through the short-term period (Wednesday evening), with some
upwards of 25 degrees below normal and many record tying/breaking
temperatures possible. Freeze Warnings are in effect across broad portions
of the Central Plains, Middle Mississippi Valley, Ohio Valley, Tennessee
Valley, Mid-South, and Central/Southern Appalachians. Freeze Watches are
in effect further south from northern portions of the Southern Plains east
through the Lower Mississippi Valley and into the Piedmont. Lows in the
mid-20s to low 30s are currently forecast for locations in the Freeze
Warnings Tuesday morning with lows in the low to mid-30s for areas in the
Freeze Watches on Wednesday morning.

Areas to the north of the Freeze Watches and Warnings, despite already
having seen their first freeze, will still experience well below normal,
frigid temperatures Tuesday, with highs in the upper-30s to low 40s for
the Northern Plains and Upper Great Lakes and low to mid-40s for the
Middle Missouri Valley east to the Lower Great Lakes. Highs on Wednesday
should warm by about 5-10 degrees across the region. Further south, while
a widespread freeze is not currently expected, morning lows on Wednesday
will bottom out in the upper-30s to low 40s across much of the Gulf Coast.

In addition to the chilly temperatures, additional waves of low pressure
rotating around the broader upper-level low will continue strong/gusty
northwesterly winds across portions of the Great Lakes with a wintry mix
of rain and snow showers expected through Wednesday. Any snow
accumulations should generally remain on the lighter side with the
exception of the Upper Great Lakes, particularly the Upper Peninsula of
Michigan. Snow showers today will taper off through the day tomorrow, with
total accumulations upwards of 6-12 inches possible for some higher
elevation, inland locations.

Heavy rain is forecast to the east of the cold front as it pushes through
Maine during the day Tuesday. Anomalously high moisture from the Gulf
Stream will be advected northward ahead of the front and help to enhance
rain rates/rainfall totals for showers and thunderstorms along the front.
There is a Slight Risk of Excessive Rainfall in effect for eastern Maine
where 2-4 inches of rainfall is forecast, with locally higher totals
between 5-8 inches in higher terrain areas possible, leading to the risk
for scattered instances of flash flooding.

Elsewhere, warm temperatures 10-20 degrees above average will continue for
much of the West the next couple of days as an upper-level ridge remains
in place. Highs Tuesday and Wednesday will be in the mid- to upper 70s for
most of the Northern Rockies, Pacific Northwest, and Great Basin, with 80s
for the I-5 urban corridor in Oregon. A warm front will move east over the
High Plains on Wednesday, bringing some relief from the chilly
temperatures to the Northern High Plains with highs in the mid-60s to
low-70s.
Current forecast of heavy precipitation (Updates can be found HERE)
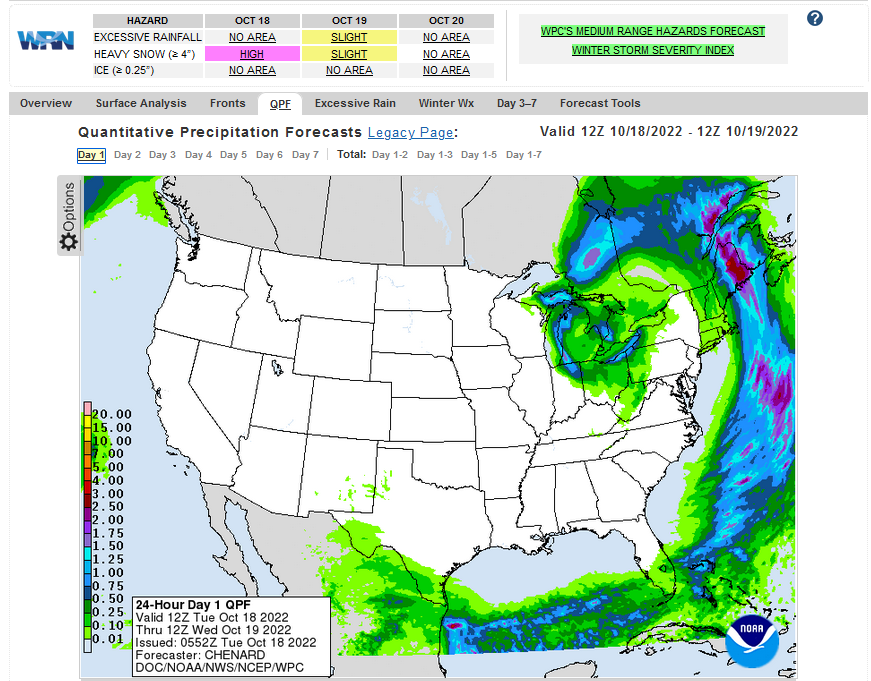
Maps that relate the forecast to geography can be found by clicking Here for Day 1 and Here for Day 2.
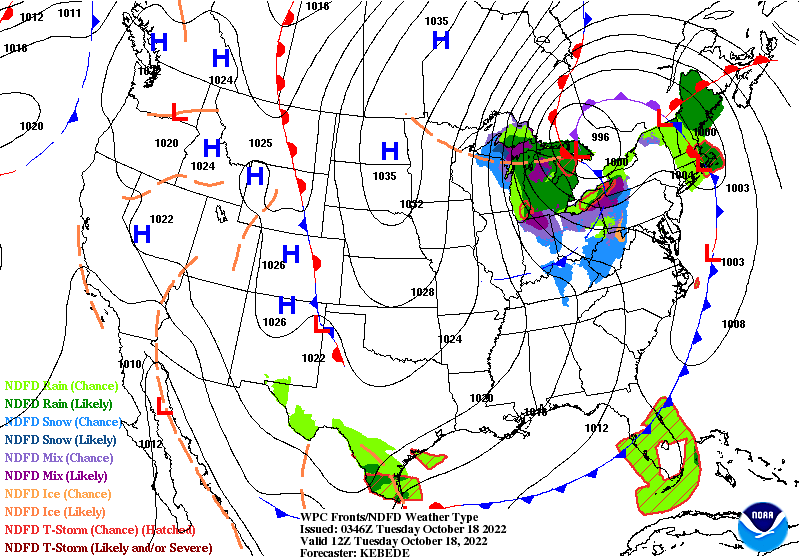
Here is a 60-hour animated forecast map that shows how the short-term forecast is expected to play out
 If it needs to be updated click here.
ATMOSPHERIC RIVERS
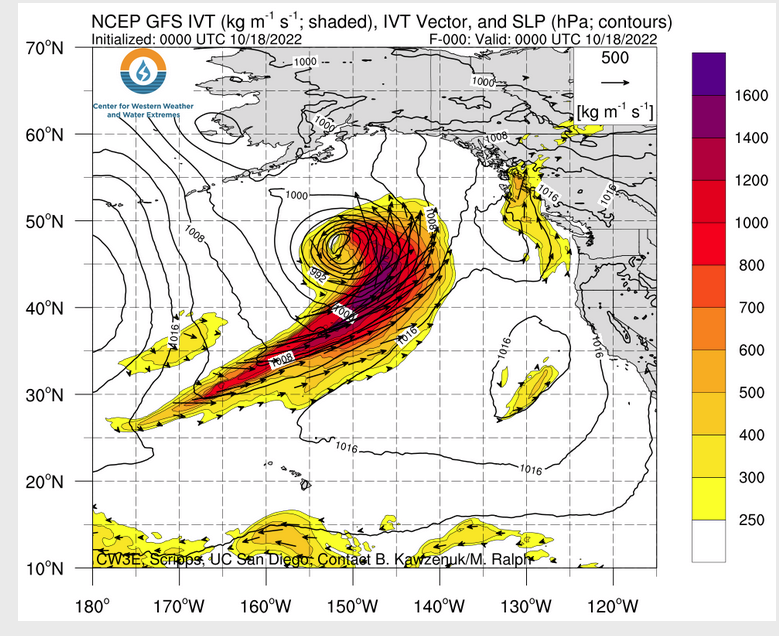 Click HERE to update. HERE is some useful information about Atmospheric Rivers.
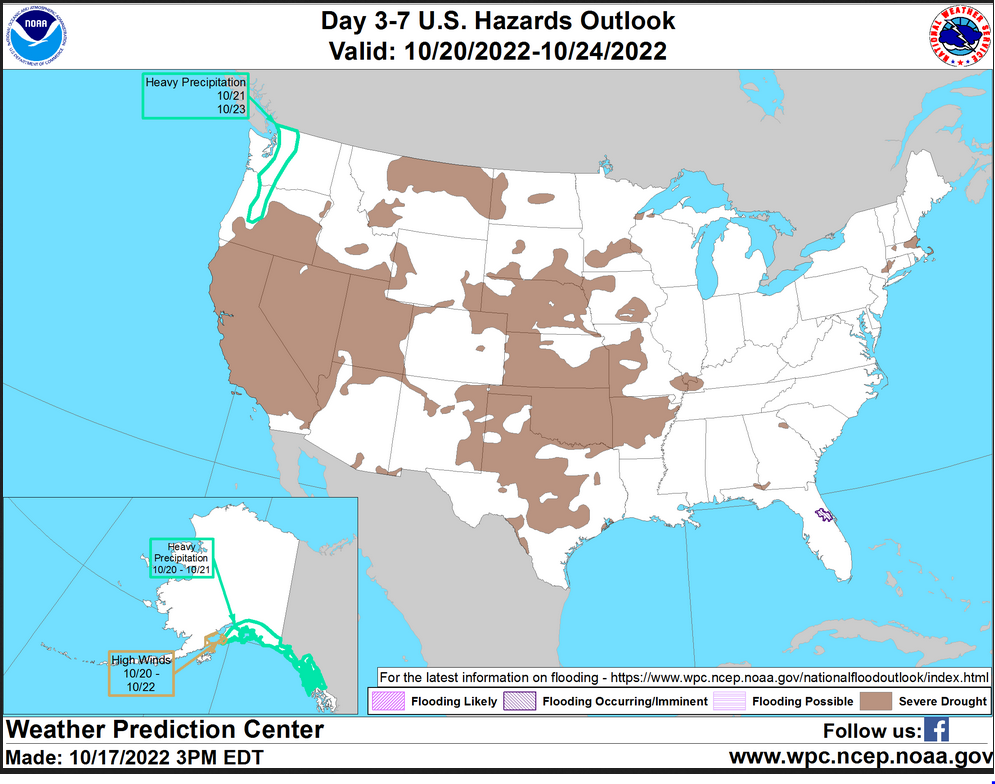
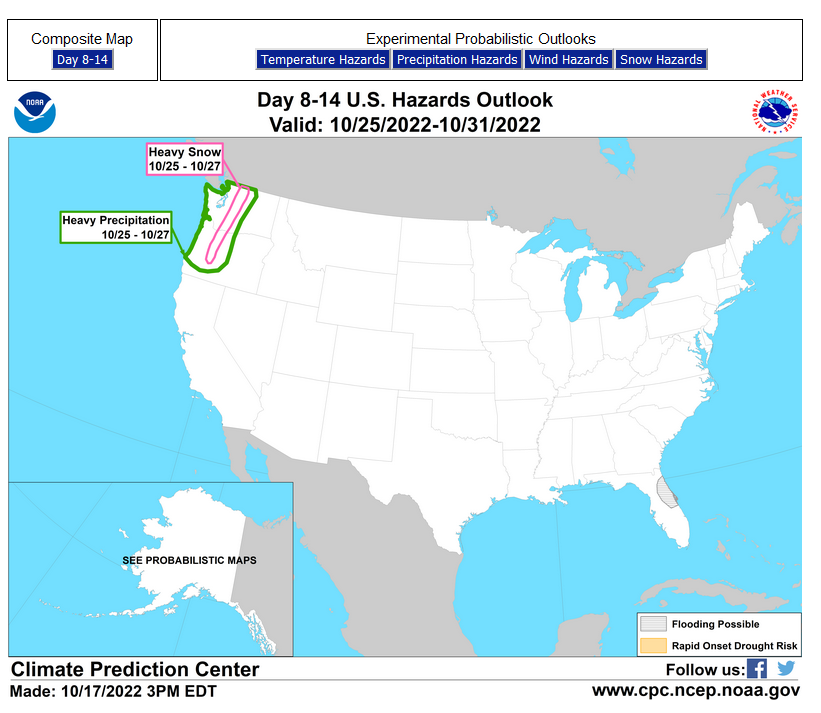
HAZARDS OUTLOOKS
Click here for the latest complete Day 3 -7 Hazards forecast which updates only on weekdays. Once a week probably Monday or Tuesday I will update the images. I provided the link for readers to get daily updates on weekdays. Use your own judgment to decide if you need to update these images.
Worldwide Tropical Forecast
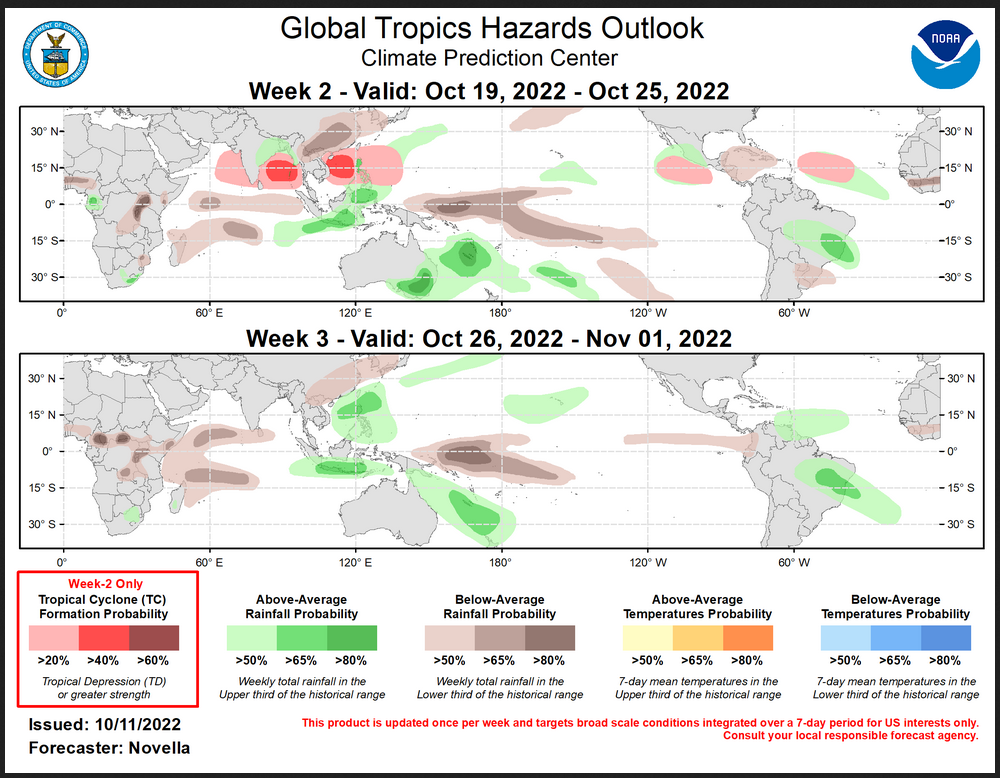
(This graphic updates on Tuesdays) If it has not been updated, you can get the update by clicking here This is a new approach and covers weeks 2 and 3 not weeks 1 and 2. It has more information but I am having trouble getting used to it. As usual, it comes with a discussion which is below
Detailed Maps and Reports for the Western Atlantic and the Pacific Oceans
Below are four maps that summarize the situation for the Atlantic, Eastern, Central Pacific, and Western Pacific. Additional information can be accessed by clicking HERE
First the Atlantic
Click to view the forecast map and have access to additional information https://www.nhc .noaa.gov/gtwo.php?basin= atlc&fdays=5
Then Eastern Pacific
Click to view the forecast map and have access to additional information https://www.nhc.noaa.gov/gtwo.php?basin=epac&fdays=5
Then Central Pacific
Click to view the forecast map and have access to additional information https://www.nhc.noaa.gov/gtwo.php?basin=cpac&fdays=5
And the Western Pacific
Click to view the forecast map and have access to additional information https://www.metoc.navy.mil/jtwc/jtwc.html
Some Intermediate-Term Outlooks
Links to “Outlook” maps and discussions for three time periods. Days 6 – 10, Days 8 – 14, and Weeks 3 and 4. An outlook differs from a forecast based on how NOAA uses these terms in that an “outlook” presents information from deviation from normal and the likelihood of these deviations.
You have to click on the links because they do not update automatically and I do not want to have stale images in the article. But it is not difficult to click on a link and you get a large image plus a discussion. On Fridays in a separate article, we will show the images and provide a link in this article that article. But remember what you will see is the images as of Friday. But here you can get the current images simply by clicking on them. Then hit the return arrow at the upper left of your screen to return to the article. You will not find this information easily anywhere else.

Right now you can find these maps here (We show them every Friday there but you can click above and find them).
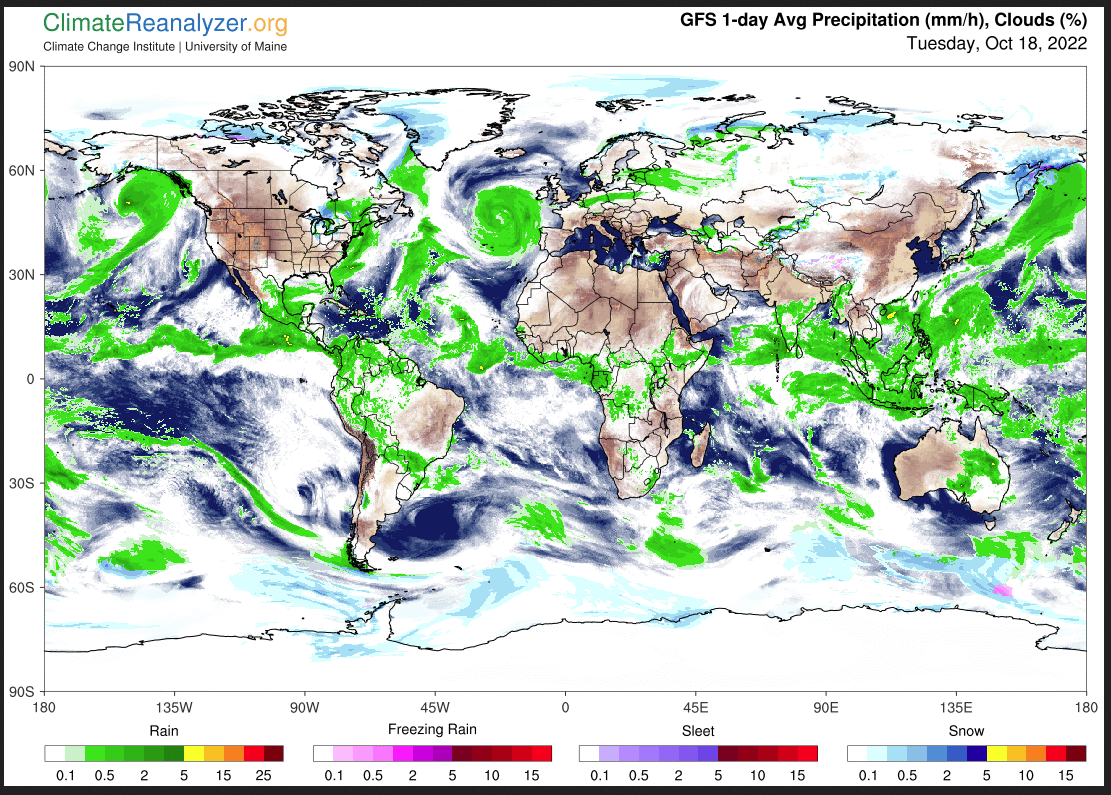
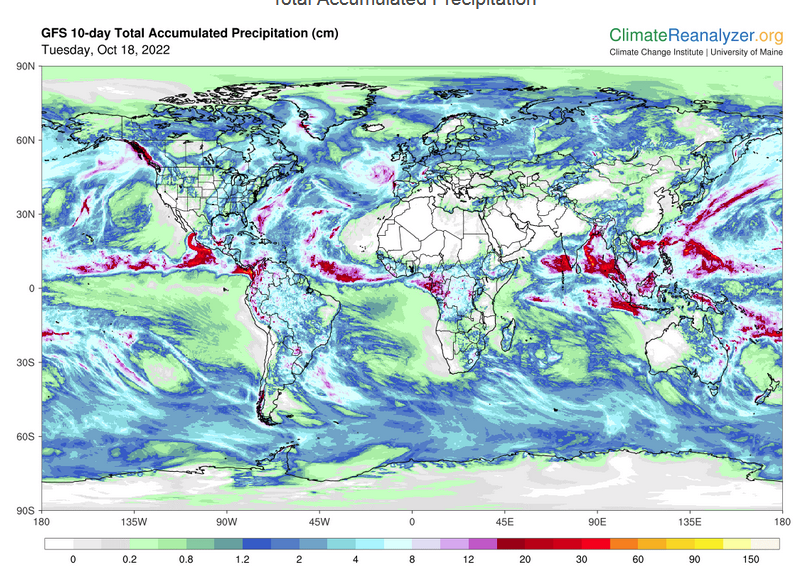
Worldwide Weather
Below is the current or short-term precipitation forecast which can be updated by clicking HERE Additional maps can be obtained H ERE.
Month to Date Information
Month to date Temperature can be found at https://hprcc.unl.edu/products/maps/acis/MonthTDeptUS.png
Month to date Precipitation can be found at https://hprcc.unl.edu/products/maps/acis/MonthPNormUS.png
