Here is what we are paying attention to this evening and the next 48 hours from this afternoon’s NWS Forecast.
...Flash flooding and severe weather risks shift southeast from the Desert
Southwest today to southern Texas by Monday...

...Severe weather possible across Oklahoma into tonight; unsettled weather
spreading from the Great Lakes into New England and parts of the
Mid-Atlantic Sunday into Monday...

...Surge of colder air overspreading the northern Plains by Monday while
record warmth gradually moderates across the Pacific Northwest...
Continuation of the NWS Short Range Forecast (It is updated twice a day and these updates can be found here.
An upper-level low moving onshore near the California-Mexico border will
bring a round of unsettled weather from the Desert Southwest to southern
Texas during the next couple of days.  Pacific moisture and instability
ahead of this low have already triggered scattered showers and
thunderstorms across the Desert Southwest where a slight to moderate risk
of excessive rainfall is expected into tonight.  As a cold front from the
central Plains settles southward into the southern Plains, interaction
with the arrival of the Pacific moisture will shift the focus of the risk
of excessive rainfall southeastward into the southern Rockies to the
southern High Plains on Sunday.  By Monday, the heavy rain threat should
lessen somewhat as the front dips farther south into southern Texas where
the heaviest rains are expected to fall.  In the meantime, thunderstorms
near the front could become severe this evening into tonight across
Oklahoma.  A low pressure wave forming along the front will spread
rain/storms toward the central Appalachians to the Mid-Atlantic on Sunday
into Sunday night.

Farther north, an increasingly cold and unsettled weather pattern is
forecast to develop across the northern Plains spreading east into New
England by Monday.  The cold air surging into the Great Lakes behind a
developing low pressure system will lead to mixed precipitation to expand
eastward toward New England on Monday.  Interior New England may see a
quick round of heavier rain as a warm front lifts toward the region on
Monday before colder air arrives from the west later in the day behind the
intensifying low exiting the Great Lakes.

Clouds and precipitation associated with the upper low in conjunction with
the arrival of cooler air from the north will cause high temperatures to
plunge from the 80s and 90s today to the 50s and 60s across portions of
the southern High Plains on Sunday.  Highs in parts of New Mexico will be
15-25 degrees below average as a result.  An upper ridge indicative of
anomalous warmth will move across the Northwest this weekend.  Highs in
the 70s and 80s in the Pacific Northwest will be 15-25 degrees above
average, and potentially record setting through this weekend, followed by
a moderating trend on Monday.
Current forecast of heavy precipitation (Updates can be found HERE)
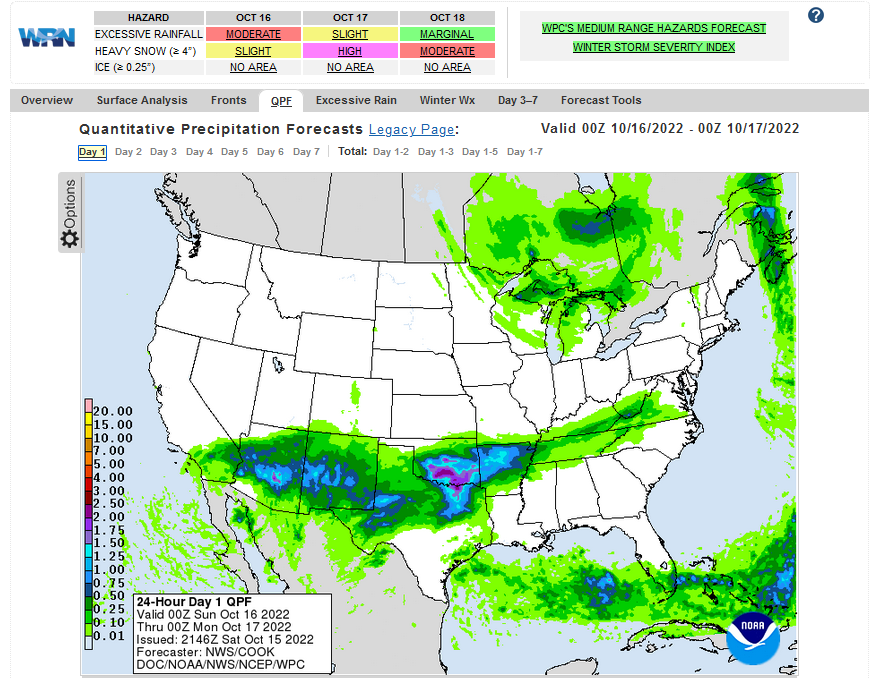 Maps that relate the forecast to geography can be found by clicking Here for Day 1 and Here for Day 2.
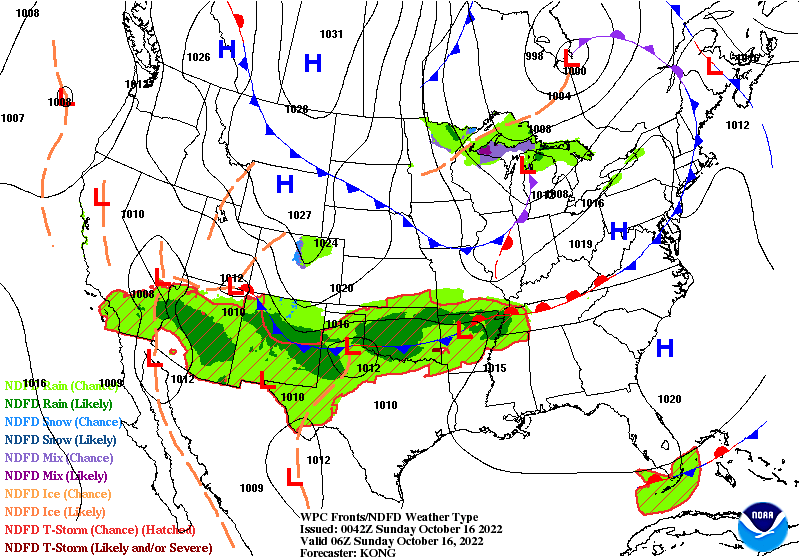
Here is a 60-hour animated forecast map that shows how the short-term forecast is expected to play out
 If it needs to be updated click here.
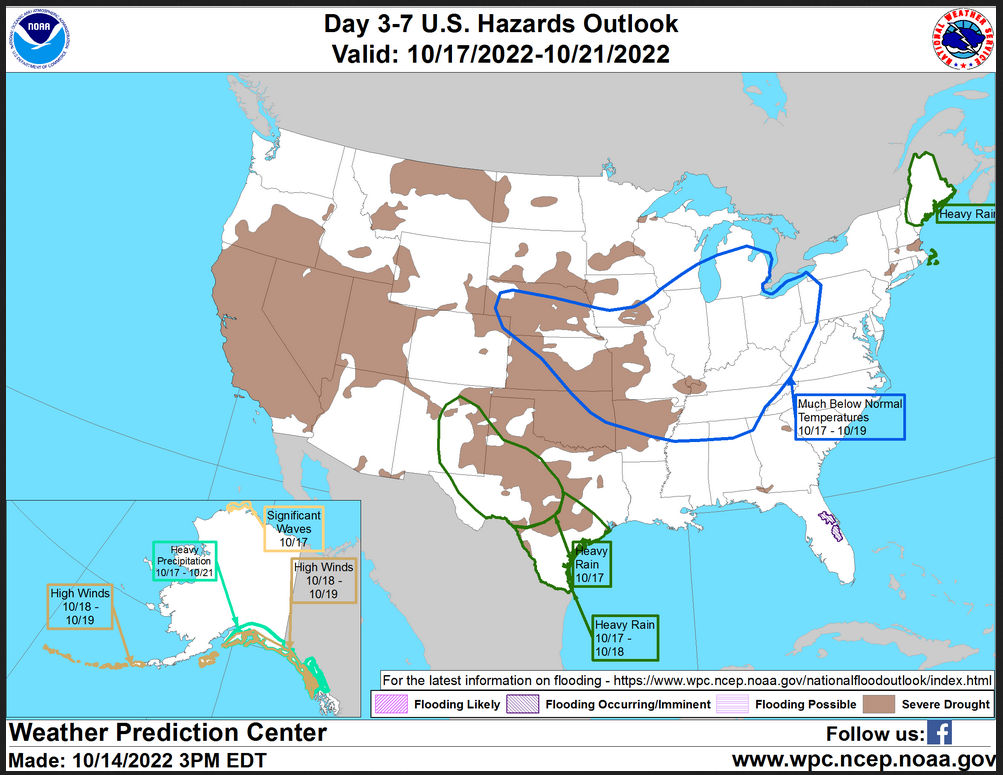
HAZARDS OUTLOOKS
Click here for the latest complete Day 3 -7 Hazards forecast which updates only on weekdays. Once a week probably Monday or Tuesday I will update the images. I provided the link for readers to get daily updates on weekdays. Use your own judgment to decide if you need to update these images.
Worldwide Tropical Forecast
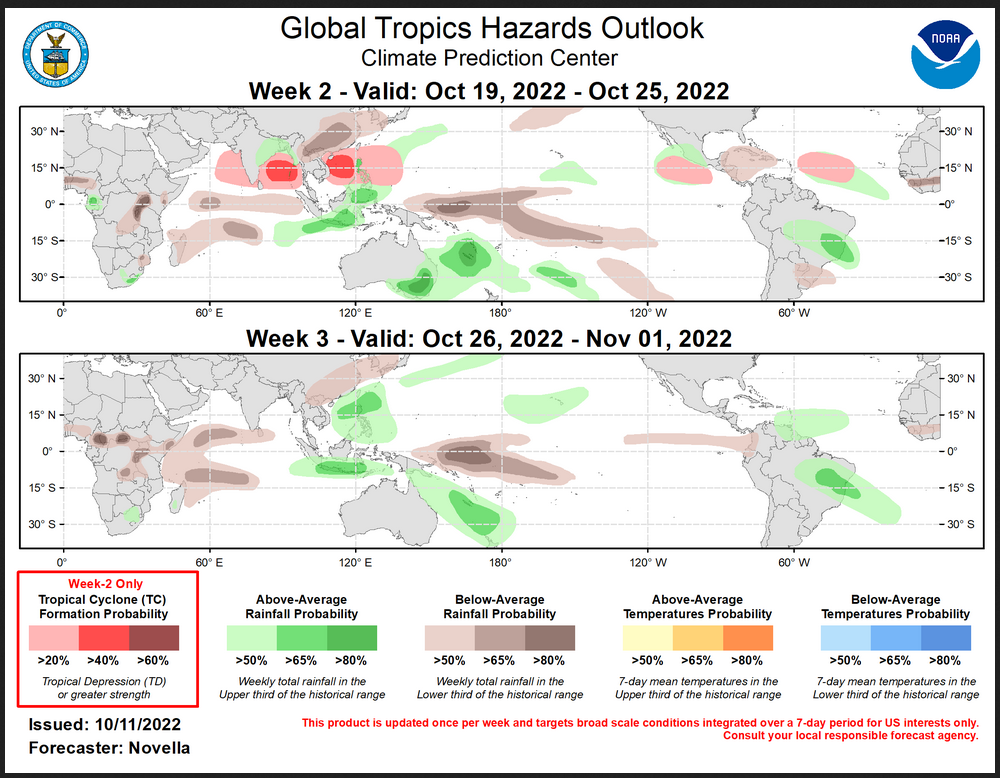
(This graphic updates on Tuesdays) If it has not been updated, you can get the update by clicking here This is a new approach and covers weeks 2 and 3 not weeks 1 and 2. It has more information but I am having trouble getting used to it. As usual, it comes with a discussion which is below
Detailed Maps and Reports for the Western Atlantic and the Pacific Oceans
Below are four maps that summarize the situation for the Atlantic, Eastern, Central Pacific, and Western Pacific. Additional information can be accessed by clicking HERE
First the Atlantic
Click to view the forecast map and have access to additional information https://www.nhc .noaa.gov/gtwo.php?basin= atlc&fdays=5
Then Eastern Pacific
Click to view the forecast map and have access to additional information https://www.nhc.noaa.gov/gtwo.php?basin=epac&fdays=5
Then Central Pacific
Click to view the forecast map and have access to additional information https://www.nhc.noaa.gov/gtwo.php?basin=cpac&fdays=5
And the Western Pacific
Click to view the forecast map and have access to additional information https://www.metoc.navy.mil/jtwc/jtwc.html
Some Intermediate-Term Outlooks
Links to “Outlook” maps and discussions for three time periods. Days 6 – 10, Days 8 – 14, and Weeks 3 and 4. An outlook differs from a forecast based on how NOAA uses these terms in that an “outlook” presents information from deviation from normal and the likelihood of these deviations.
You have to click on the links because they do not update automatically and I do not want to have stale images in the article. But it is not difficult to click on a link and you get a large image plus a discussion. On Fridays in a separate article, we will show the images and provide a link in this article that article. But remember what you will see is the images as of Friday. But here you can get the current images simply by clicking on them. Then hit the return arrow at the upper left of your screen to return to the article. You will not find this information easily anywhere else.

Right now you can find these maps here (We show them every Friday there but you can click above and find them).
Worldwide Weather
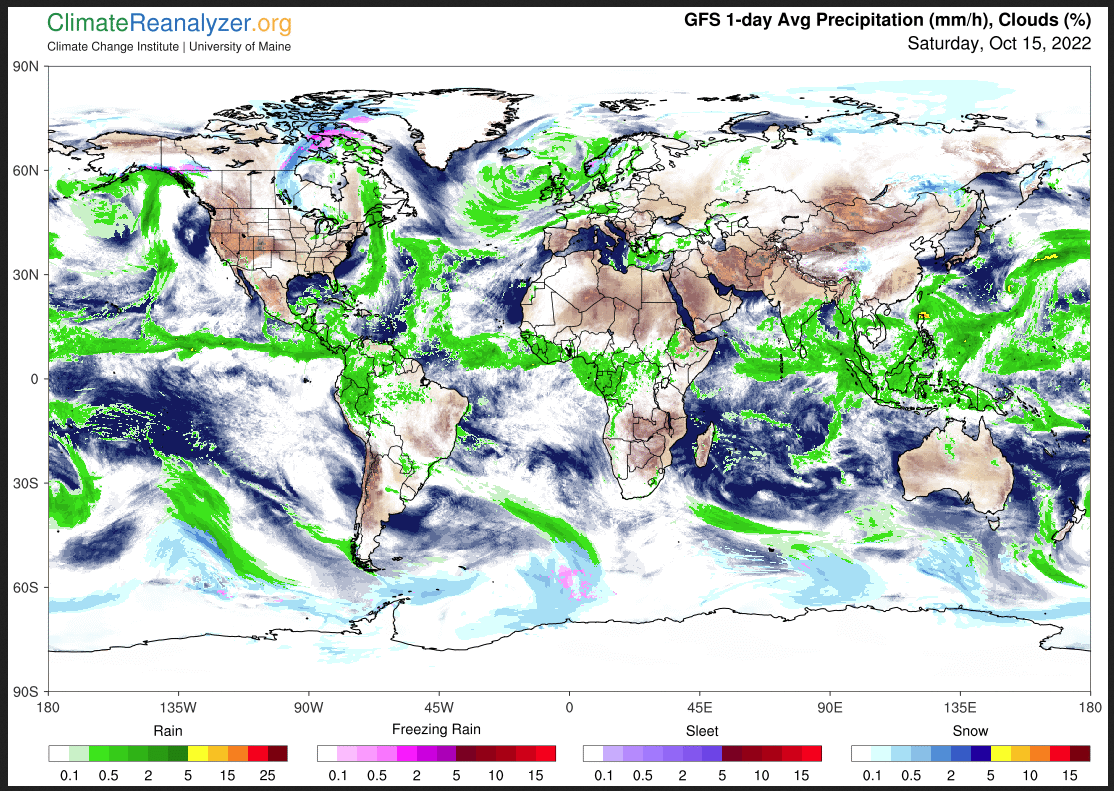
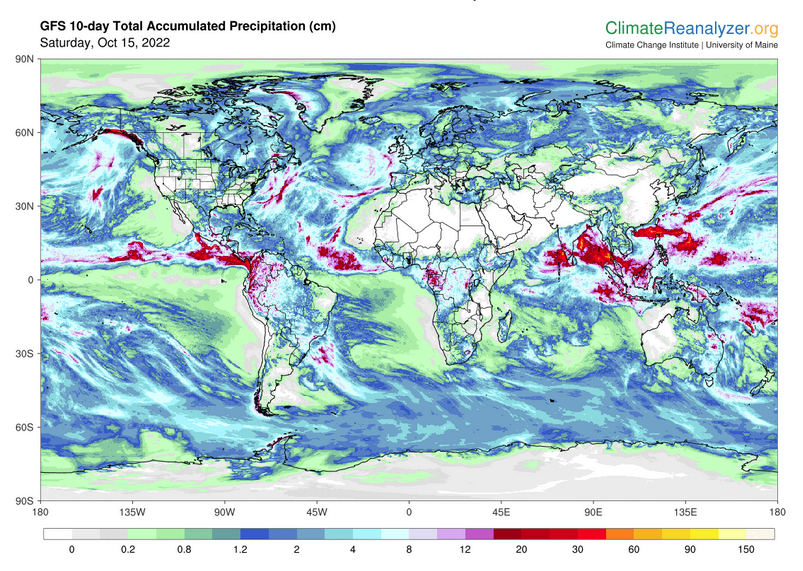
Below is the current or short-term precipitation forecast which can be updated by clicking HERE Additional maps can be obtained H ERE.
 Month to Date Information
Month to date Temperature can be found at https://hprcc.unl.edu/products/maps/acis/MonthTDeptUS.png
Month to date Precipitation can be found at https://hprcc.unl.edu/products/maps/acis/MonthPNormUS.png