Day One and Two Maps updated at 5pm EDT on October 15, 2022
NOAA updates many of its weather outlooks daily or even more frequently and in many cases issues a discussion with those outlooks. We provide a daily report which focuses on the shorter-term predictions but also has links to all the partial-month outlooks. Because WordPress does not provide the ability to have these maps automatically updated, our daily report shows some of the maps which we update each evening plus the links to the other important weather forecast Maps.
Once a week we show many of the actual forecast maps not just provide the links to these maps. This makes it easier for the reader. Our report provides a separate forecast for Days1-5, Days 6 -10, Days 8 – 14, and weeks 3 and 4. This provides information that is useful to readers in terms of planning their activities for the next 28 days.
The week 3-4 outlook is only updated by NOAA’s Climate Prediction Service once a week on Friday. Thus, when we publish on Friday night, it provides a 28-day view of the future. What is important is that this is a longer-term view than one that is typically available in the media and online.
We also include In Part II of the article the other information from the daily 48-hour forecast article. Importantly, this time of the year, it includes updates on tropical events. In both Parts I and II we also include some worldwide forecasts.
It is important to recognize that the forecasts do not always work out as predicted. But in the article, there are links to obtain updated forecasts If you read this article a few days or more after it is published. And there will be a totally updated version next Friday.

What NOAA is predicting for the next 28 days.
We will start with the short-term – It is up to date as of today. If you look at this article after today you can click the links to update (plus you will end up with a lot of additional information)
| Temperature (Maximum or Minimum Anomaly) for the next five days | Precipitation (Five days of cumulative precipitation) |
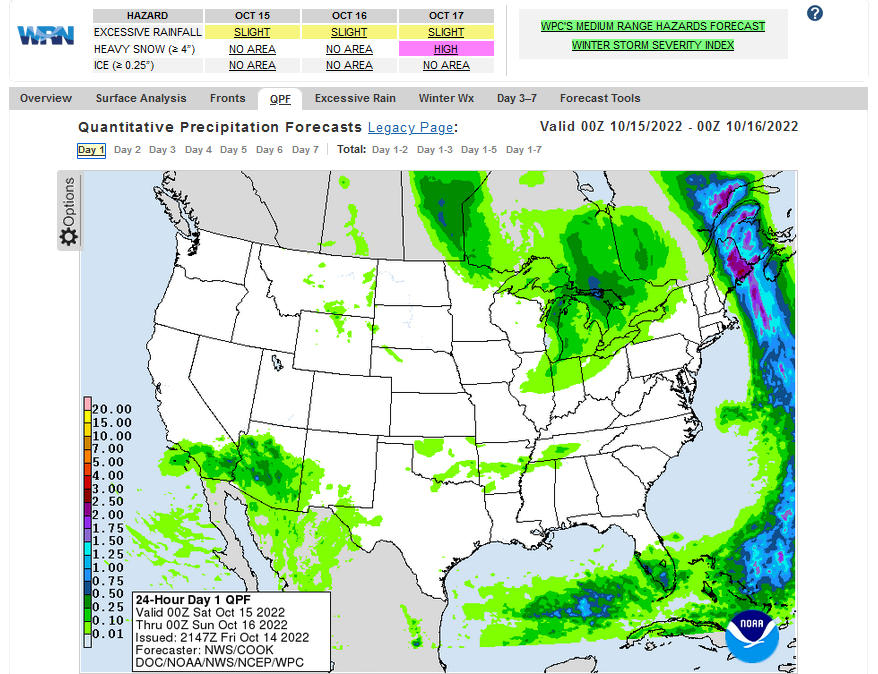
| https://www.wpc.ncep.noaa.gov/medr/me dr_mean.shtml | https://www.wpc.ncep.noaa.gov/qpf/day1-7.shtml |
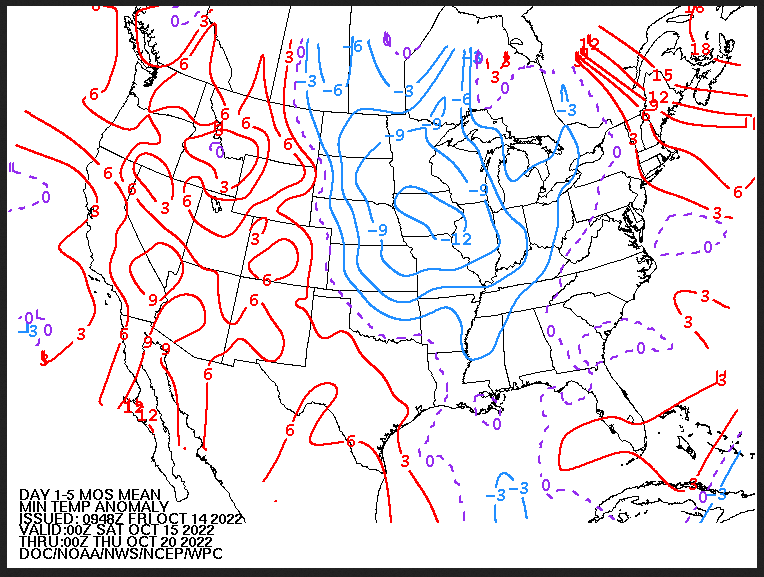
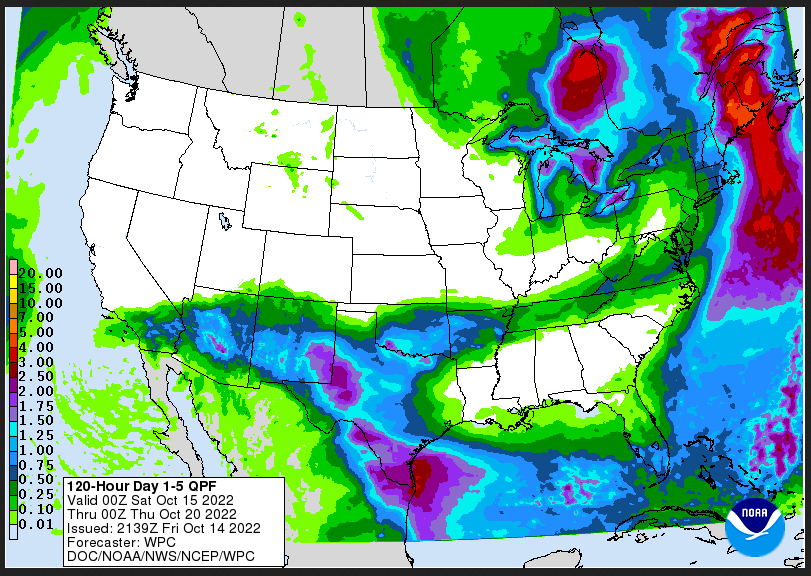
| Cool in the center and wet Southern Tier and Great Lakes/Northeast. |
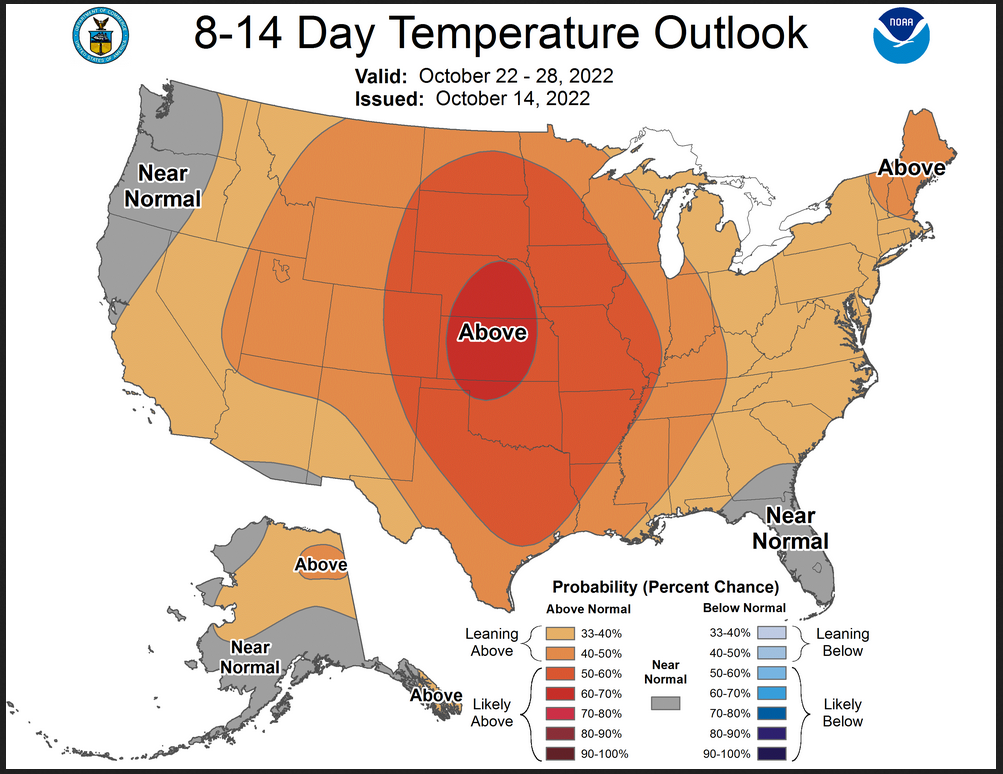
Now we look at “Outlook” maps for three time periods. Days 6 – 10, Days 8 – 14, and Weeks 3 and 4. An outlook differs from a forecast based on how NOAA uses these terms in that an “outlook” presents information as deviation from normal and the likelihood of these deviations.
I have provided the maps so you do not need to click to get them. But they do not update daily. But you can get the current images simply by clicking on the links provided. Then hit the return arrow at the upper left of your screen to return to the article. There is no need to do that right away since what is published today is up to date. The Week 3 – 4 Outlook only updates on Fridays.
Below are the links to obtain updates and additional information.
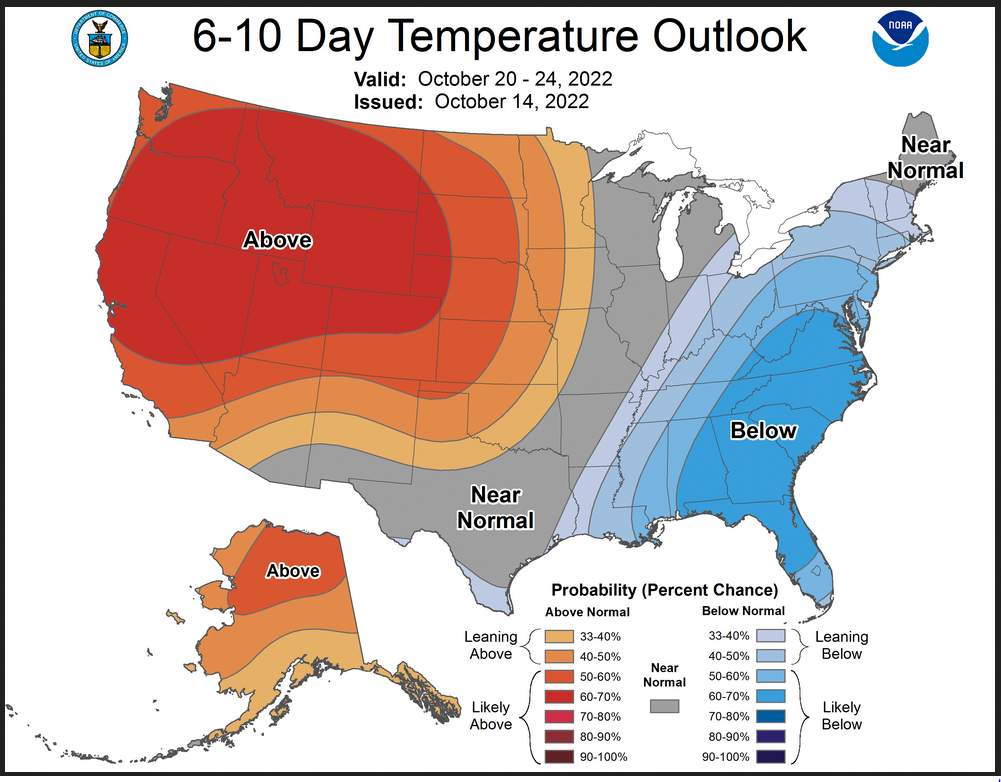
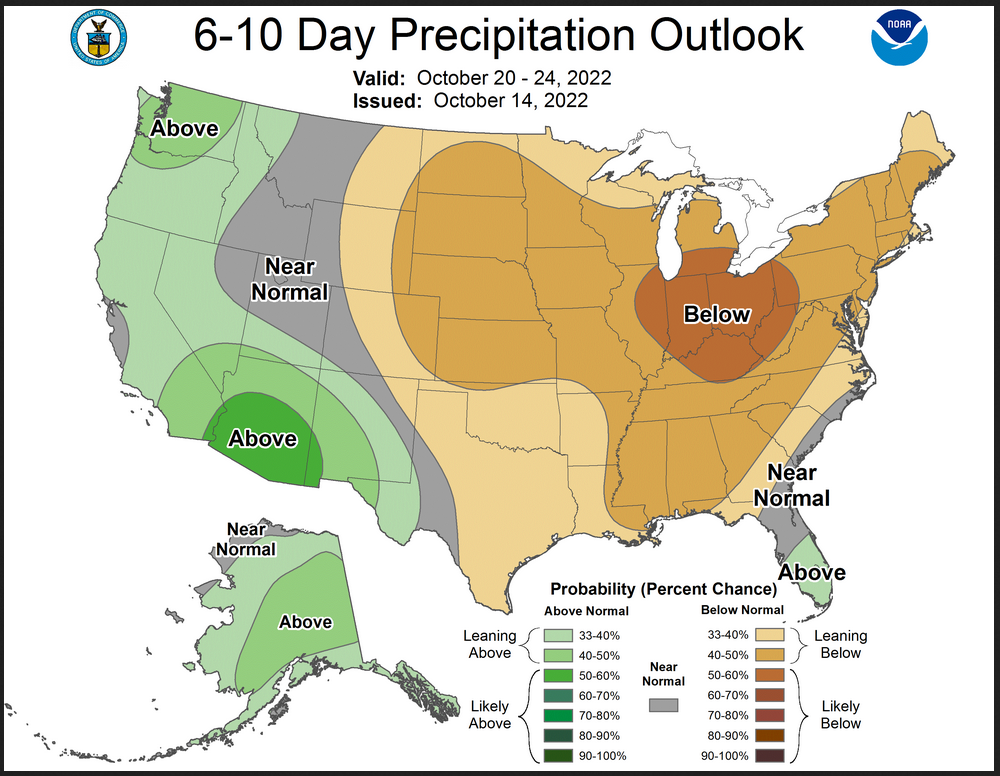
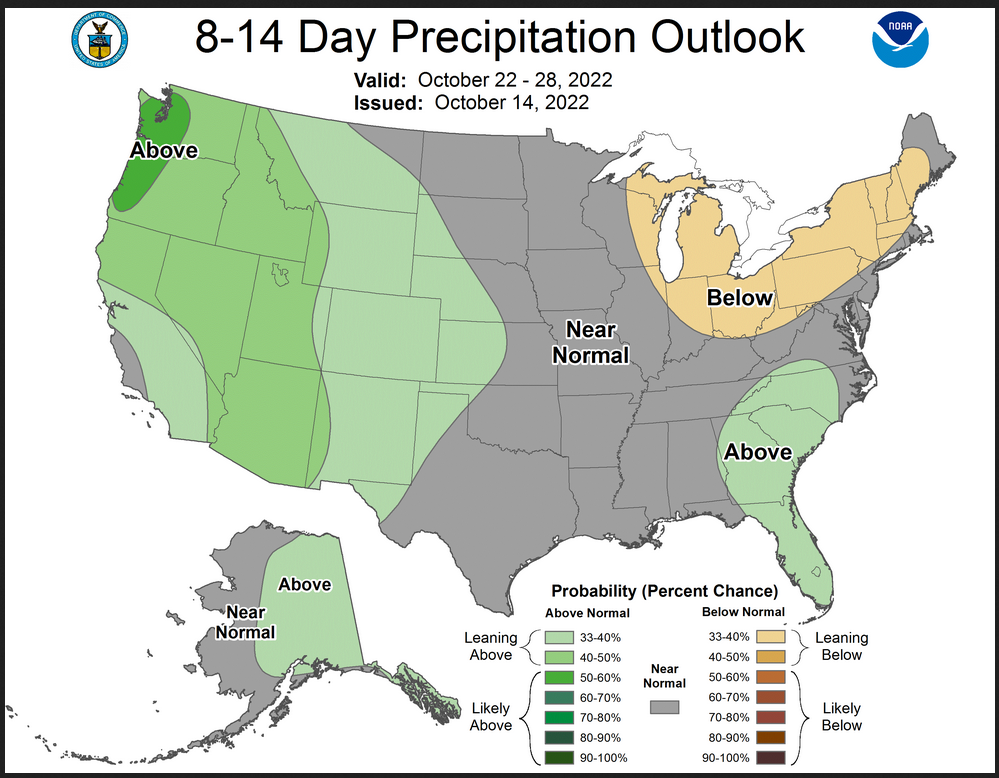
| The West is warm and the East is cool. The Southwest and the far West is wet and to the east it is dry. |
| Warn all over and the West remains wet |
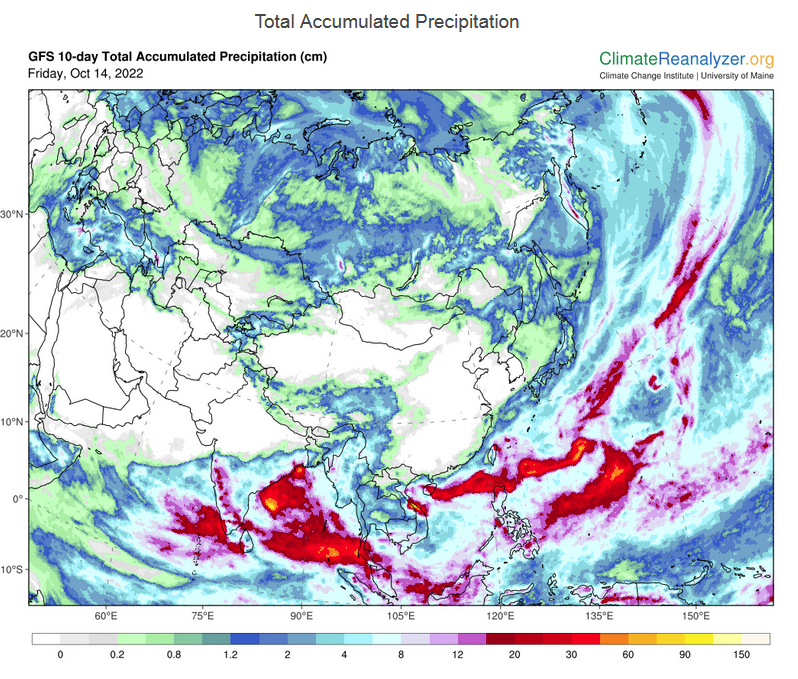
Let us take a look at the world situation. I think the units are centimeters. It is the ten day total accumulated precipitation forecast.
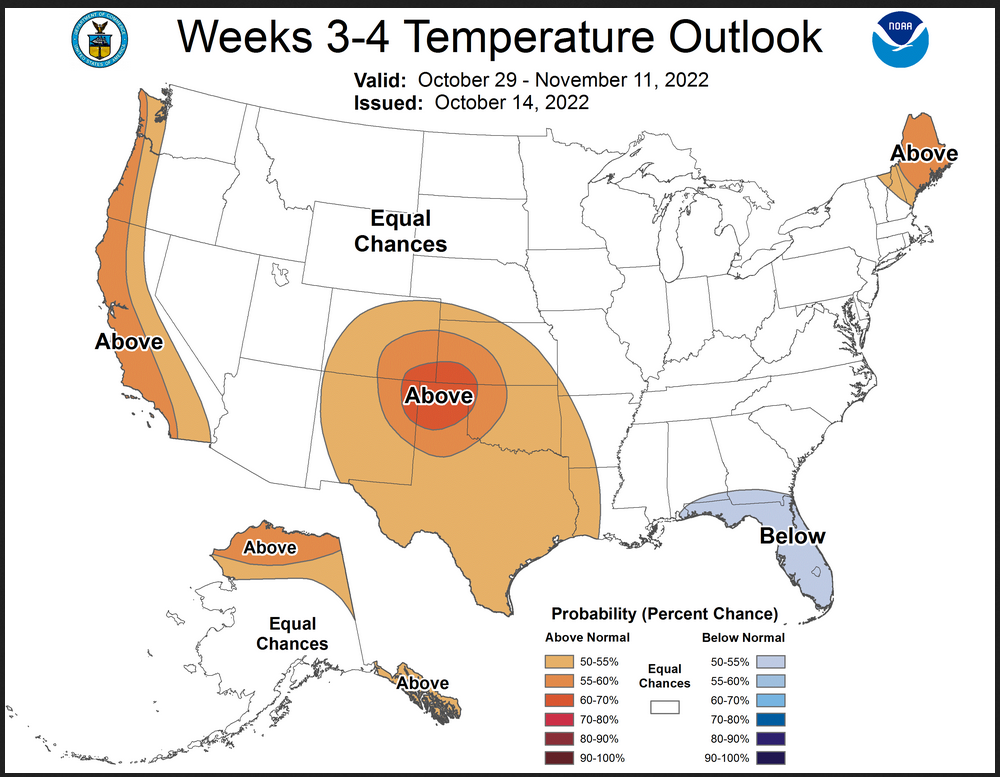
Now we address Weeks 3 and 4. This is a time frame that is very important. It is half of the 28-Day forecast period. That is why we include the discussion that accompanies the maps.
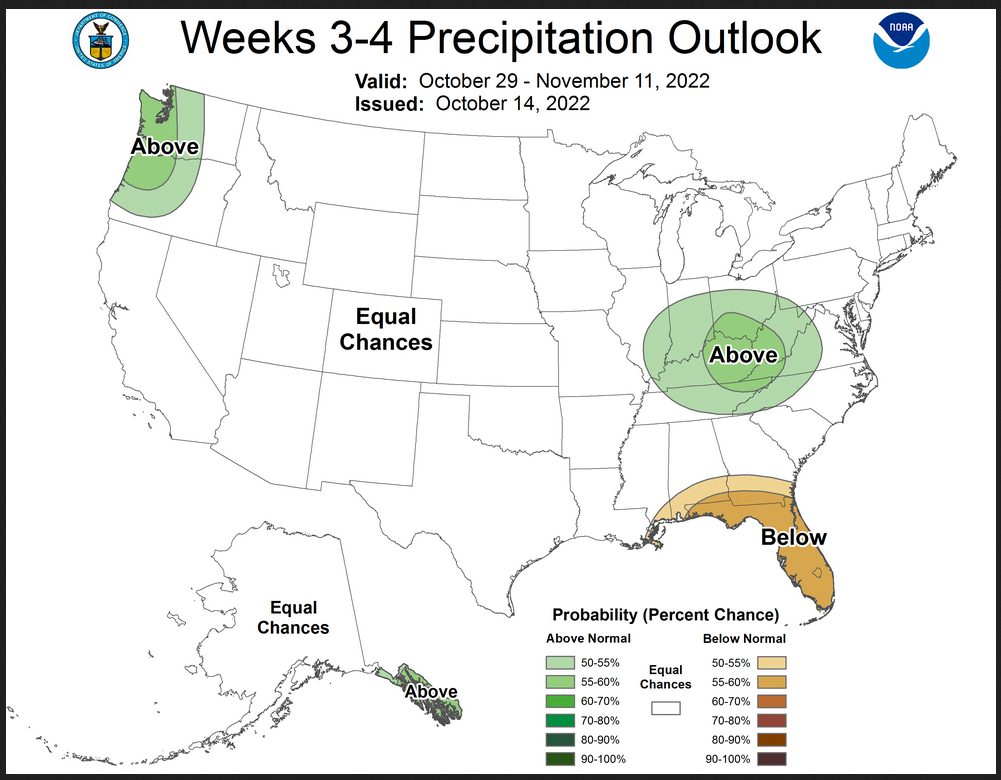
Prognostic Discussion for Week 3-4 Temperature and Experimental Precipitation Outlooks
NWS Climate Prediction Center College Park MD
300PM EDT Fri Oct 14 2022
Week 3-4 Forecast Discussion Valid Sat Oct 29 2022-Fri Nov 11 2022
La Niña conditions continue across the tropics with coldest sea surface temperature (SST) anomalies in the Niño 4 and Niño 1+2 regions. Tropical convection associated with the Madden Julian Oscillation (MJO) has recently begun to strengthen as it continues its eastward propagation into the West Pacific but this propagation may be short-lived. Both the GEFS and ECMWF forecasts of the Real-time Multivariate MJO (RMM) show a continuation of an eastward, but weakened, progression of the MJO signal from Phases 6 to 7 where it will potentially encounter destructive interference from the low-frequency La Niña signal. In the extratropics, the North Atlantic Oscillation (NAO) is expected to remain in its current negative phase through at least the start of the forecast period. With these factors in mind, this week’s temperature and precipitation outlooks are based primarily on dynamical model guidance as well as considerations for tropical and extratropical teleconnections.
Broad agreement exists between the CFS, ECMWF and GEFS with regard to the anomalous 500-hPa height patterns, particularly with the placement of anomalous troughing south of Alaska and ridging over the western CONUS. JMA differs from these solutions and indicates troughing over the Pacific and much of CONUS. Negative height anomalies are also observed in the CFS over the Great Lakes, but the ECMWF and GEFS generally show weak circulation over the eastern CONUS.
The temperature forecast for the Week 3-4 period tilts toward above normal probabilities across the southern Central Plains with highest probabilities over the Texas/Oklahoma Panhandle where model agreement is strongest. The dynamical models extend this signal into North Dakota, but conflicts with statistical models that indicate a cold signal related to the MJO. Thus, Equal Chances (EC) of above or below normal temperatures are carved out for the Northern Plains. The dynamical models strongly agree on above normal temperature probabilities along the West Coast and the Alaska Panhandle due to above normal SST anomalies and weak onshore flow, particularly over the Pacific Northwest, indicated by the manual blend of models. Below normal temperatures are favored for Florida due to the aforementioned weak troughing. Across the North Slope of Alaska, temperatures are likely to be above normal, consistent with decadal trends. For the remainder of Alaska and CONUS, EC is favored due to weak model guidance.
Most dynamical model forecasts favor enhanced probabilities for above normal precipitation across the Pacific Northwest, potentially in association with anomalous atmospheric river activity and onshore flow. Probabilities for elevated precipitation are also indicated for the Ohio Valley as typically associated with the current MJO. Dry conditions are favored for Florida associated with the weak troughing. EC of above or below median precipitation are carved out for the remainder of CONUS and Alaska due to weak and conflicting model signals.
Across Hawaii, slightly enhanced probabilities for above normal temperatures are forecast due to strong model consistency and slightly above normal SST anomalies. Dynamical model guidance from the SubX suite also indicates a tilt toward below normal precipitation for the islands.
| It is important to note that the Week 3 -4 Outlook is prepared by a different team than the 6 -10 and 8 – 14 day Outlooks as well as the update of the monthly outlook. |
Now switching over to Part II of this article which is our regular 48-Hr Forecast which also includes links for tropical updates and in some cases the NHC maps for storms that are near-term threats.
Here is what we are paying attention to today and the next 48 hours from this morning’s NWS Forecast.
...Heavy rainfall with the risk for flash flooding from the Southwest to
the Southern Plains this weekend...

...Cooler temperatures for the Midwest and Plains with showers over the
Great Lakes as a series of cold fronts move through the region...

...Well above average temperatures forecast from the Northwest to the
Great Basin with some record highs possible...

An upper-level cut-off low that has been residing off the coast of
southern California will begin to move eastward over the Southwest the
next couple of days. Meanwhile, a cold front will move southward over the
Plains and Southern Rockies late Saturday and throughout the day Sunday.
These features will help to trigger and support widespread showers and
thunderstorms across the region throughout the weekend. Anomalously high
moisture, the presence of modest CAPE, and the tendency for storms to
repeatedly move over the same areas have prompted a Slight Risk of
Excessive Rainfall Saturday across the Sonoran Desert from California into
portions of southern Arizona with scattered instances of flash flooding
anticipated. The threat transitions eastward with the upper-level low on
Sunday to southern New Mexico and southwestern Texas with another Slight
Risk of Excessive Rainfall in effect. Multiple rounds of storms along the
front are forecast to result in areal average rainfall totals between
1-2", with locally higher amounts of 2-4" possible. While the flood threat
will not be as high outside of the more sensitive terrain of the Southwest
and Southern Rockies, the widespread storms over the Southern Plains will
likely result in rain totals between 1-2", locally higher, here as well.

Over the east, a deep, amplified upper-level trough will continue to help
dominate the weather story as a series of shortwaves rotate around the
trough and multiple surface fronts progress across the eastern/central
U.S. Some lingering showers will continue to move northward over Maine and
progress eastward through this evening ahead of a slow moving cold front.
A flood watch remains in effect through Saturday morning as a couple
inches of additional rainfall on top of already wet soils could lead to
minor flooding. The focus then turns further west as progressively colder
air is advected southward over the Midwest and Plains. Highs in the
mid-40s to mid-50s will spread southward over the Great Lakes Region and
broader Midwest behind a cold front on Saturday. Temperatures will cool
significantly over the Northern Plains by Sunday as well as a second cold
front moves southward, with highs generally in the mid-40s to low 50s. In
addition, the series of shortwaves rotating around the upper-level low
will lead to several rounds of precipitation through the weekend across
the Great Lakes Region. Generally light to moderate showers are expected
during the day with some wet snow mixing in overnight, though little to no
accumulation is expected.

An amplified upper-level ridge will generally remain in place through the
weekend over the Pacific Northwest continuing the warmer than average
weather pattern for the region. Highs on Saturday and Sunday will be in
the upper 70s to low 80s for the I-5 urban corridor, with low 90s possible
for the Rogue Valley in Oregon. Many of these highs will be close to
either tying or breaking daily records. While not record-breaking, highs
will still be 10-20 degrees above normal for the rest of the interior
Northwest, Northern Rockies, and Great Basin, with mid- to upper 70s
forecast.
(It is updated twice a day and these updates can be found here.
Current forecast of heavy precipitation (Updates can be found HERE)
Maps that relate the forecast to geography can be found by clicking Here for Day 1 and Here for Day 2. (I will update these on Saturday morning so they will be current at that point).
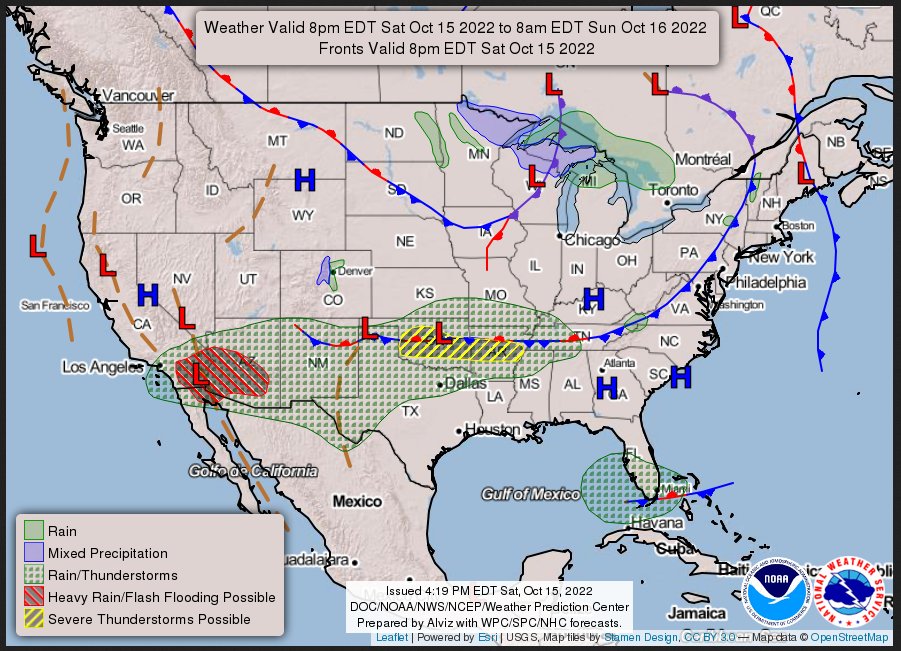
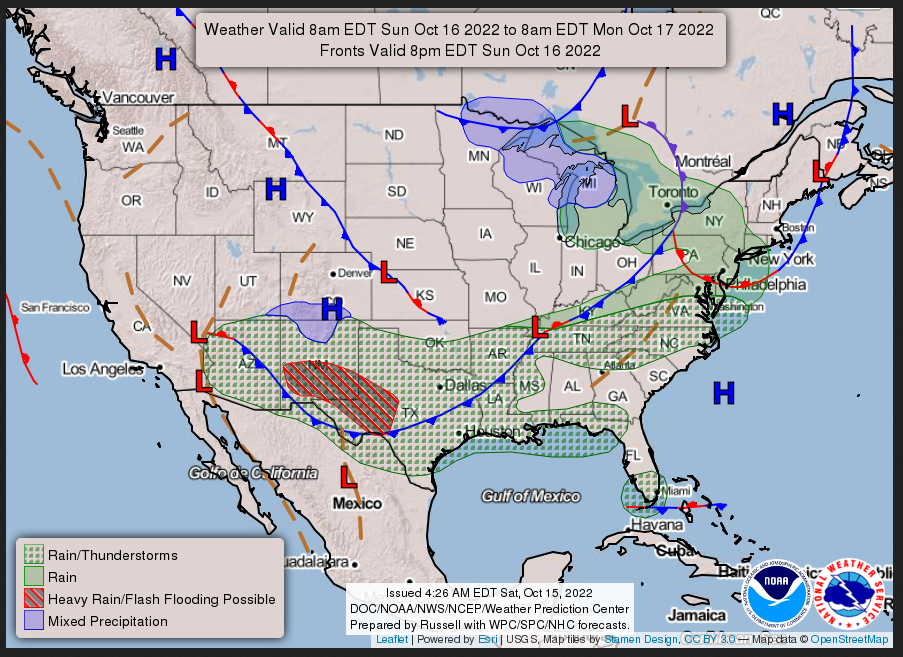
Here is a 60-hour animated forecast map that shows how the short-term forecast is expected to play out.
If it needs to be updated click here.
HAZARDS OUTLOOKS
Click here for the latest complete Day 3 -7 Hazards forecast which updates only on weekdays. Once a week probably Monday or Tuesday I will update the images. I provided the link for readers to get daily updates on weekdays. Use your own judgment to decide if you need to update these images.

Worldwide Tropical Forecast
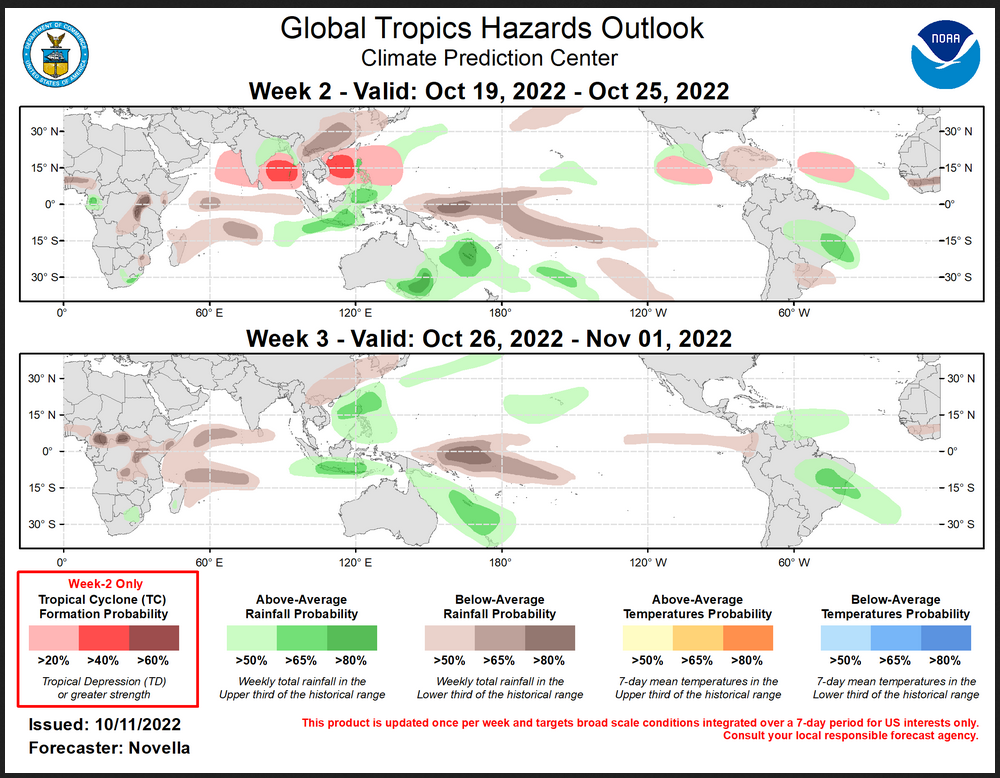
(This graphic updates on Tuesdays) If it has not been updated, you can get the update by clicking here
Detailed Maps and Reports.
Below are four maps that summarize the situation for the Atlantic, Eastern, Central Pacific and Western Pacific. Additional information can be accessed by clicking HERE
First the Atlantic
Click to view the forecast map and have access to additional information https://www.nhc.noaa.gov/gtwo.php ?basin=atlc&fdays=5
Then Eastern Pacific
Click to view the forecast map and have access to additional information https://www.nhc.noaa .gov/gtwo.ph p?basin=epac&fdays=5
Then Central Pacific
Click to view the forecast map and have access to additional information https://www.nhc.noaa.gov/gtwo.php?basin=cpac&fdays=5
And the Western Pacific
Click to view the forecast map and have access to additional information https://www.metoc.navy.mil/jtwc/jtwc.html
Updates and additional information can be accessed by clicking HERE
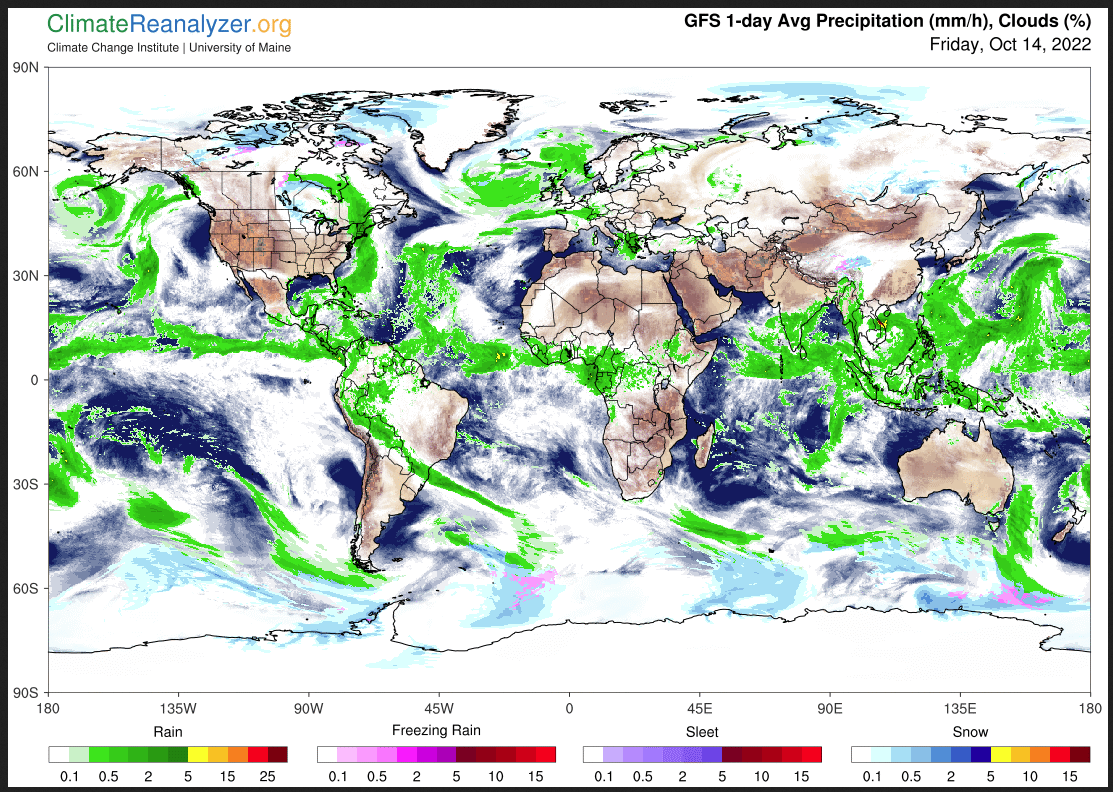
World Forecast
Below is the current or short-term precipitation forecast which can be updated by clicking HERE Additional maps for different time frames and other aspects of weather in addition to precipitation can be obtained HERE.
Month to Date Information
Temperature month to date can be found at https://hprcc.unl.edu/products/maps/acis/MonthTDeptUS.png
Precipitation month to date can be found at https://hprcc.unl.edu/products/maps/acis/MonthPNormUS.png
