Here is what we are paying attention to this evening and the next 48 hours from this afternoon’s NWS Forecast.
...Flash Flood Risk over Southern California, the Central Gulf Coast, and
the Southeast through tonight; Threat shifts Northeast for the end of the
week...

...Critical Fire Weather conditions over portions of the Central and
Northern Plains through Thursday...

...Below Normal Temperatures for much of the Central and Eastern US
through the end of the week...
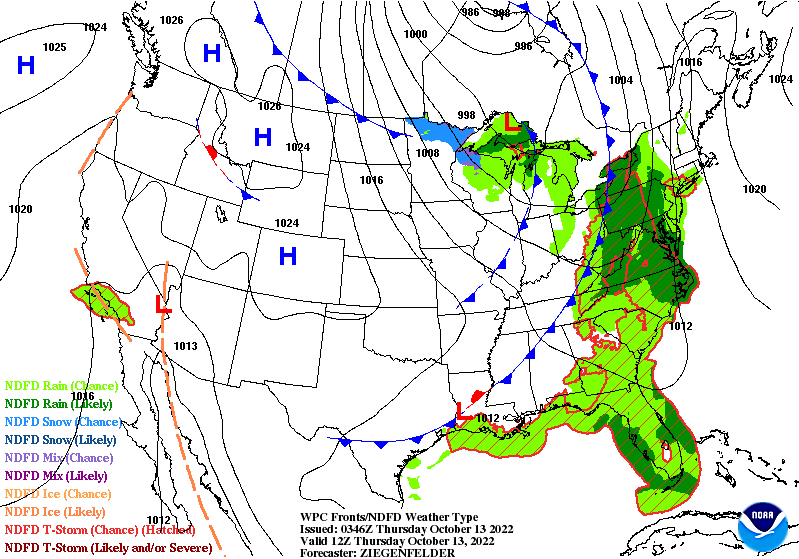
Continuation of the NWS Short Range Forecast (It is updated twice a day and these updates can be found here.
An upper level low will meander near the southern California coast over
the next few days. The low will pull away from the coast slightly on
Thursday, resulting in lower precipitation chances that day, then push
back towards the coast on Friday. This feature is expected to enhance
precipitation chances, and there is a Marginal Risk of Excessive Rainfall
(level 1/4) for portions of southern California today and Friday. Isolated
flash flooding will be possible, especially near steep terrain and burn
scars.

For the eastern two thirds of the US, the main weather feature through
Friday will be a cold front that will gradually push southeast towards the
East Coast. The front is currently draped from the Great Lakes region down
towards north Texas with the tail end of the front banked up against the
Rocky Mountains. The front is expected to push off the East Coast by
Friday morning. Precipitation associated with the front will be focused
ahead of and along the boundary while cooler, drier air funnels in behind
the front.

Heavy precipitation out ahead of the front could lead to isolated to
scattered areas of flash flooding through tonight across the Central Gulf
coast and the Southeast. The highest threat area will be focused along the
Mississippi/Alabama border where the highest moisture resides. There is a
Slight Risk of Excessive Rainfall (level 2/4) along the
Mississippi/Alabama border and a Marginal Risk of Excessive Rainfall
(level 1/4) across the rest of the Central Gulf Coast and portions of
Georgia and South Carolina.

As the front progresses, the heavy rain and flash flood threat will shift
northeast. Thursday and Friday, scattered flash flooding will be possible
for portions of the Northeast, and there is a Slight Risk of Excessive
Rainfall (level 2/4) for those areas. The highest threat area will stretch
from Pennsylvania to Maine on Thursday, then the highest threat will be in
Maine on Friday. Flooding will be most likely in urban areas and areas
with poor drainage, but drains could be clogged by leaves that have fallen
and cause flooding in areas that usually have decent drainage as well.

The cooler air funneling in behind the front will result in several days
of below normal temperatures for the Central and Eastern US. The northern
Plains have already begun to cool, and that cooler air will spread
southeast Thursday and Friday. Widespread highs in the 40s and 50s will be
possible across the Upper Midwest on Thursday, approximately 10-15 degrees
below normal for this time of year. Cooler, drier air will reach the East
Coast by Friday as the front pushes offshore. While the Central and
Eastern US cool down, the Pacific Northwest will experience above average
temperatures through the end of the week as high pressure builds across
the region. High temperatures are forecast to be in the 70s and 80s across
Washington and Oregon, and it will be possible for isolated locations to
set daily max temperature records each day.

As drier air continues to move into the Northern and Central Plains, fire
weather conditions will be dangerous. Low relative humidity (15-20
percent) and strong winds (20-25 gusting to 30-35 mph) in this region have
promoted the Storm Prediction Center to highlight an area of Critical Fire
Weather conditions from North Dakota to Kansas through Thursday. Rapid
wildfire spread will be possible, and those affected should listen to
local officials for fire safety information.
Current forecast of heavy precipitation (Updates can be found HERE)
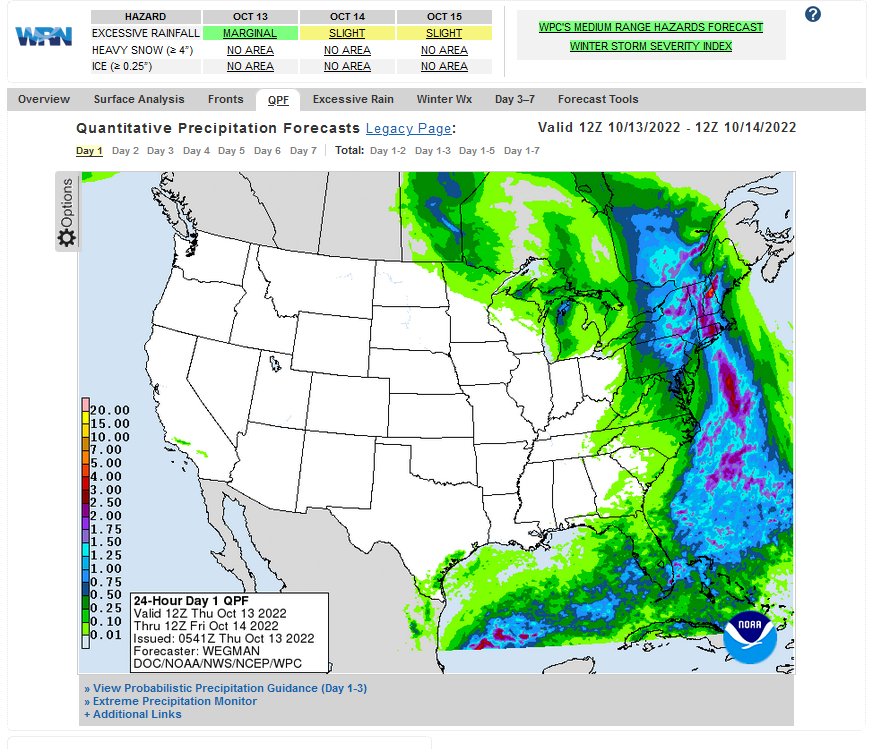 Maps that relate the forecast to geography can be found by clicking Here for Day 1 and Here for Day 2.
Here is a 60-hour animated forecast map that shows how the short-term forecast is expected to play out
 If it needs to be updated click here.
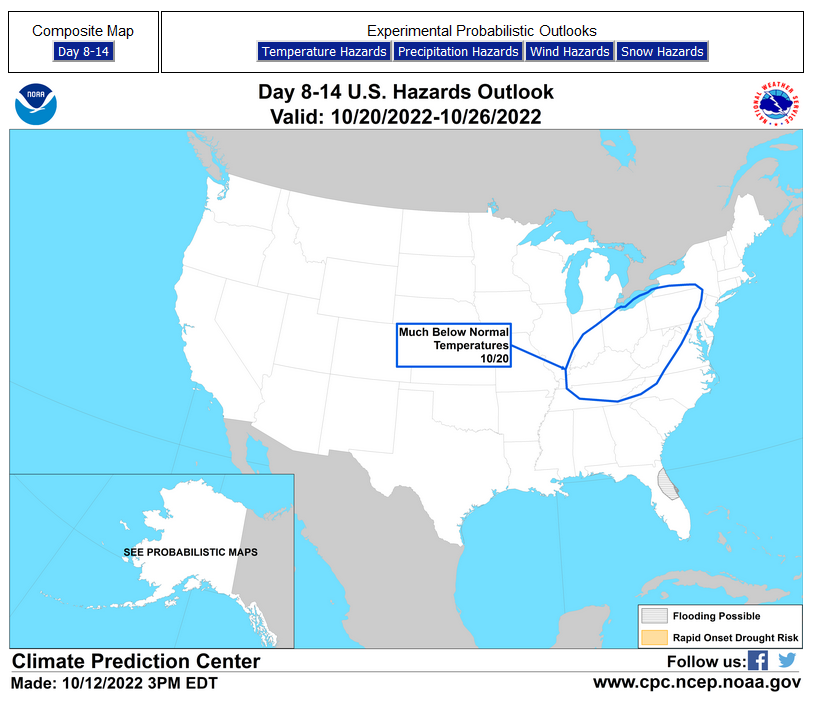
HAZARDS OUTLOOKS
Click here for the latest complete Day 3 -7 Hazards forecast which updates only on weekdays. Once a week probably Monday or Tuesday I will update the images. I provided the link for readers to get daily updates on weekdays. Use your own judgment to decide if you need to update these images.

Worldwide Tropical Forecast
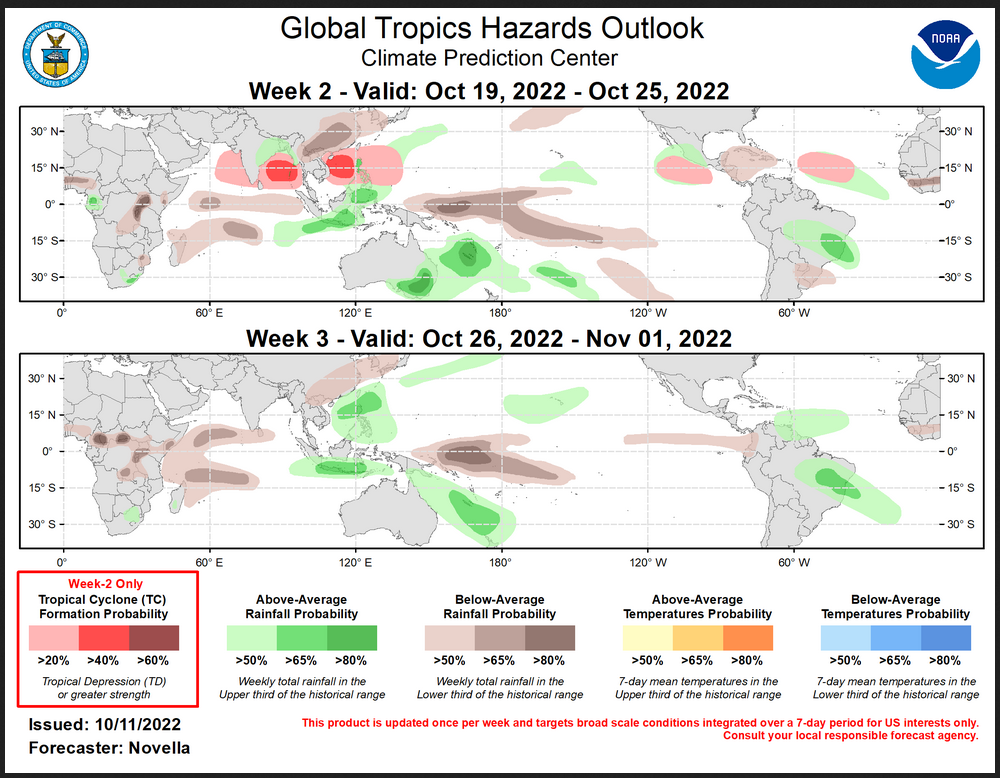
(This graphic updates on Tuesdays) If it has not been updated, you can get the update by clicking here This is a new approach and covers weeks 2 and 3 not weeks 1 and 2. It has more information but I am having trouble getting used to it. As usual, it comes with a discussion which is below
Detailed Maps and Reports for the Western Atlantic and the Pacific Oceans
Below are four maps that summarize the situation for the Atlantic, Eastern, Central Pacific, and Western Pacific. Additional information can be accessed by clicking HERE
First the Atlantic
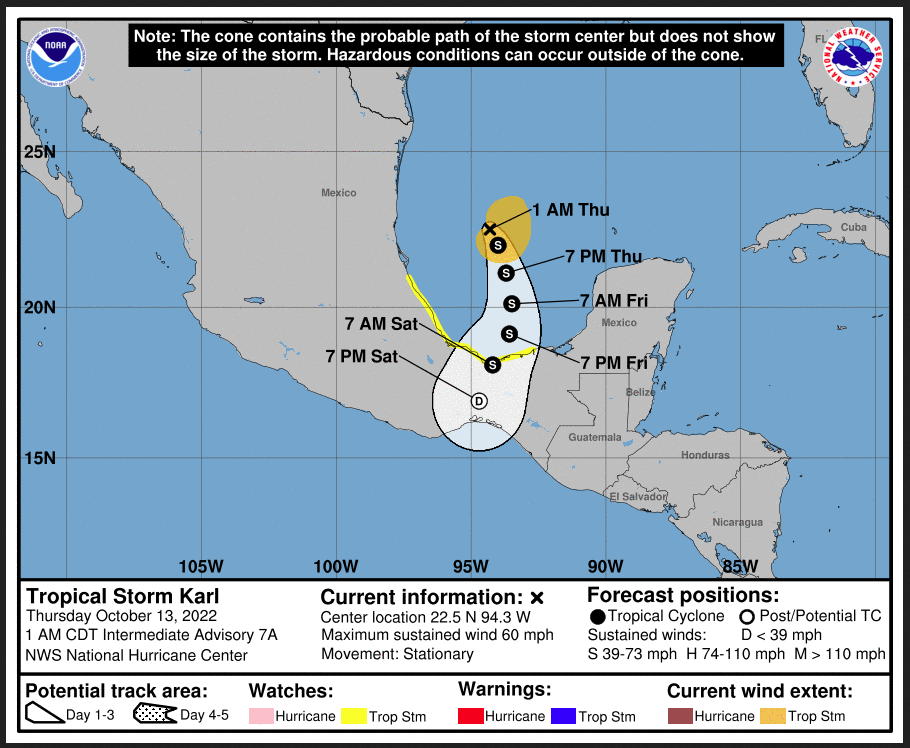
Click to view the forecast map and have access to additional information https://www.nhc .noaa.gov/gtwo.php?basin= atlc&fdays=5
Then Eastern Pacific
Click to view the forecast map and have access to additional information https://www.nhc.noaa.gov/gtwo.php?basin=epac&fdays=5
Then Central Pacific
Click to view the forecast map and have access to additional information https://www.nhc.noaa.gov/gtwo.php?basin=cpac&fdays=5
And the Western Pacific
Click to view the forecast map and have access to additional information https://www.metoc.navy.mil/jtwc/jtwc.html
Some Intermediate-Term Outlooks
Links to “Outlook” maps and discussions for three time periods. Days 6 – 10, Days 8 – 14, and Weeks 3 and 4. An outlook differs from a forecast based on how NOAA uses these terms in that an “outlook” presents information from deviation from normal and the likelihood of these deviations.
You have to click on the links because they do not update automatically and I do not want to have stale images in the article. But it is not difficult to click on a link and you get a large image plus a discussion. On Fridays in a separate article, we will show the images and provide a link in this article that article. But remember what you will see is the images as of Friday. But here you can get the current images simply by clicking on them. Then hit the return arrow at the upper left of your screen to return to the article. You will not find this information easily anywhere else.

Right now you can find these maps here (We show them every Friday there but you can click above and find them).
Worldwide Weather
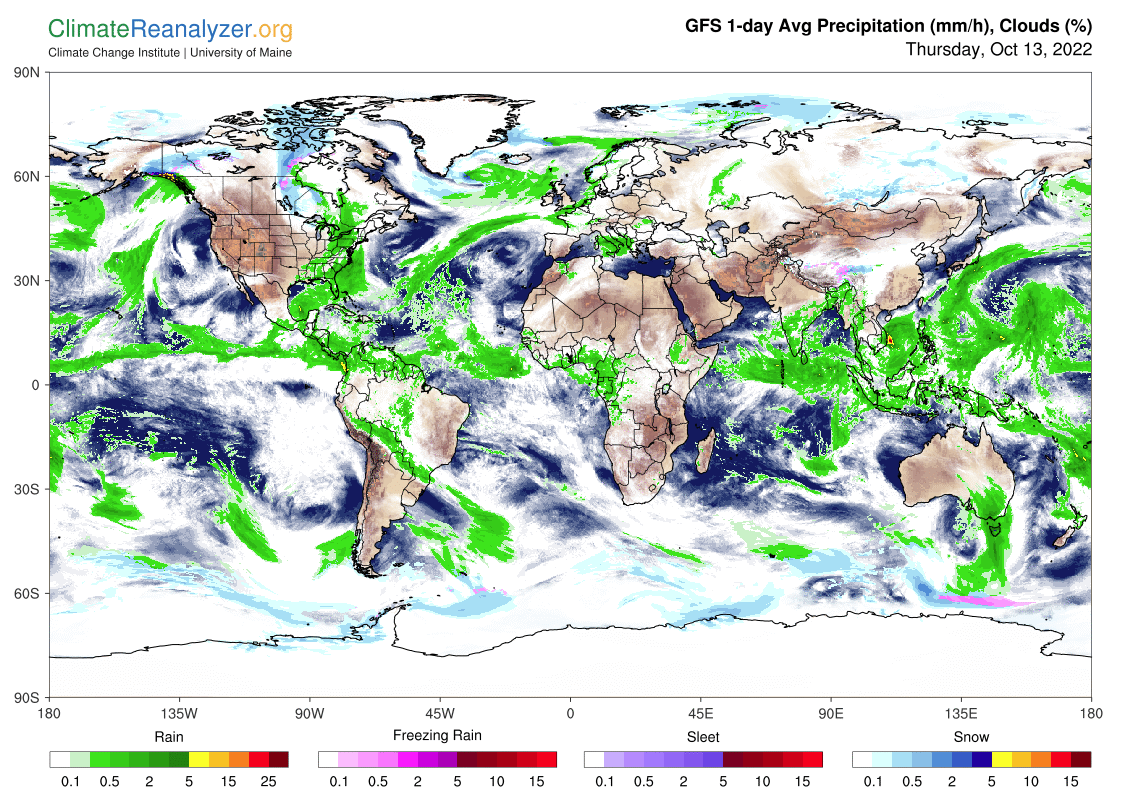
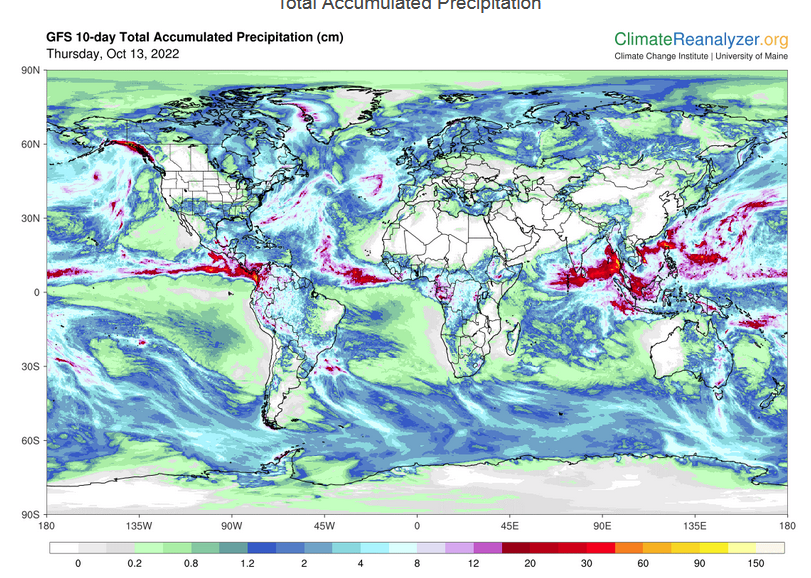
Below is the current or short-term precipitation forecast which can be updated by clicking HERE Additional maps can be obtained HERE.
 Month to Date Information
Month to date Temperature can be found at https://hprcc.unl.edu/products/maps/acis/MonthTDeptUS.png
Month to date Precipitation can be found at https://hprcc.unl.edu/products/maps/acis/MonthPNormUS.png