Updated slightly at 2 pm EDT on September 24, 2022
NOAA updates many of its weather outlooks daily or even more frequently and in many cases issues a discussion with those outlooks. We provide a daily report which focuses on the shorter-term predictions but also has links to all the partial-month outlooks. One of the weather outlook maps issued by NOAA only gets updated on Fridays and since this covers weeks 3 and 4, it is very important. It covers half of the 28-day period and the discussion released with this map is often where possible changes to the weather pattern are first identified.
That is why we issue a special report on Fridays (which most will read on Saturday) in which we show many of the actual forecast maps not just provide the links to these maps. This makes it easier for the reader. This provides a 28-day view of the future. We also include In Part II of the article the other information from the daily 48-hour forecast article. Importantly, this time of the year, it includes updates on tropical events.
It is important to recognize that the forecasts do not always work out as predicted. But in the article, there are links to obtain updated forecasts If you read this article a few days or more after it is published. And there will be a totally updated version next Friday.
As a bonus this Friday, we have included a look back at August 2022 this time on a worldwide basis. We covered precipitation but the major focus was on how August 2022 temperature fits into the modern record of yearly temperature. It is one way of looking at Global Warming(GW). Recently we reviewed August in regards to the U.S. Lower 48 States.

What NOAA is predicting for the next 28 days.
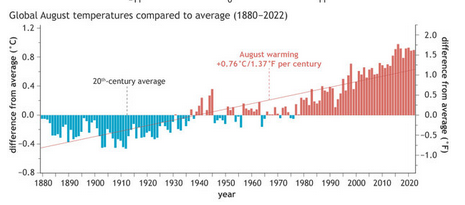
But I thought we might start by taking another look at August but this time on a Worldwide basis. Last week we took a look at August from a U.S.-only perspective. Below are the key graphics. You can read the full article by clicking HERE. It discusses some oddities in the pattern but I think I have covered most of that below .
–
| Last week I said “It was a top three for the lower 48 but a top six for the World so it really was not that extraordinary. Things tend to level off with La Nina and then there is a step-up in temperature during the next El Nino.”
Some might see some long-cycle impacts in this data. Most who do projections of Warming IMO do not really know what they are doing. It seems that not many people know how to deal with a data series that consists of a cycle and a trend. Clearly, it is getting warmer even if most are not able to project a data series like the above and must consult with the IPCC forecast models. That is ok also. But those who claim to be scientists or engineers should be able to handle a data series like the above without having to “look it up”. |
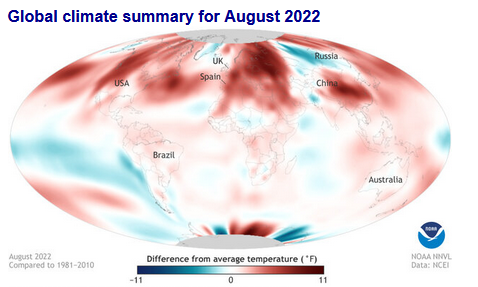
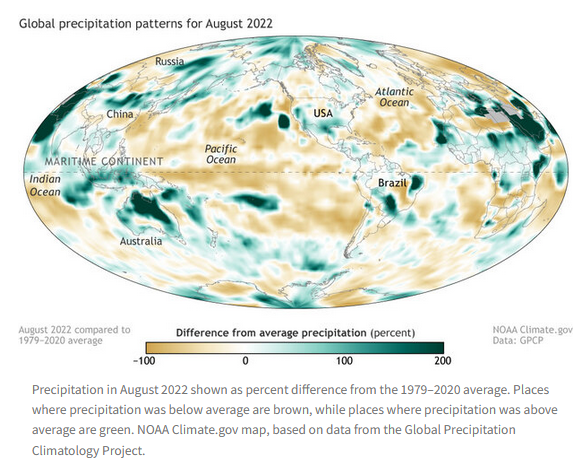
It is interesting to look at the pattern of the temperature and precipitation anomalies.
First Temperature
–
| Of course, we expect the Northern Hemisphere to be warmer than the Southern Hemisphere in August but these are anomalies so what we see are deviations from normal with the definition of “normal” being a bit out of date 1981 to 2010 rather than 1991 to 2020 for some reason. So I think it is showing what in the NH is AA or Arctic Amplification. It is pretty dramatic really. And it also shows the limitation of just looking at averages. These maps just came out and I concluded that I would include them in this article even though I could have written a separate article on the topic. |
Then precipitation
–
|
Back to our 28-Day Outlook.
We will start with the short-term – It is up to date as of today. If you look at this article after today you can click the links to update (plus you will end up with a lot of additional information)
| Temperature (Maximum Anomaly) for the next five days | Precipitation (Five days of cumulative precipitation) |
| https://www.wpc.ncep.noaa.gov/medr/me dr_mean.shtml | https://www.wpc.ncep.noaa.gov/qpf/day1-7.shtml |
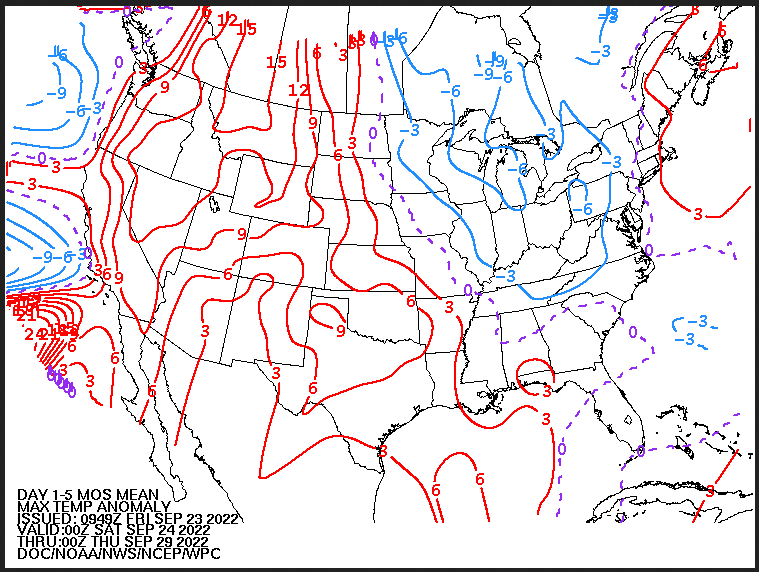
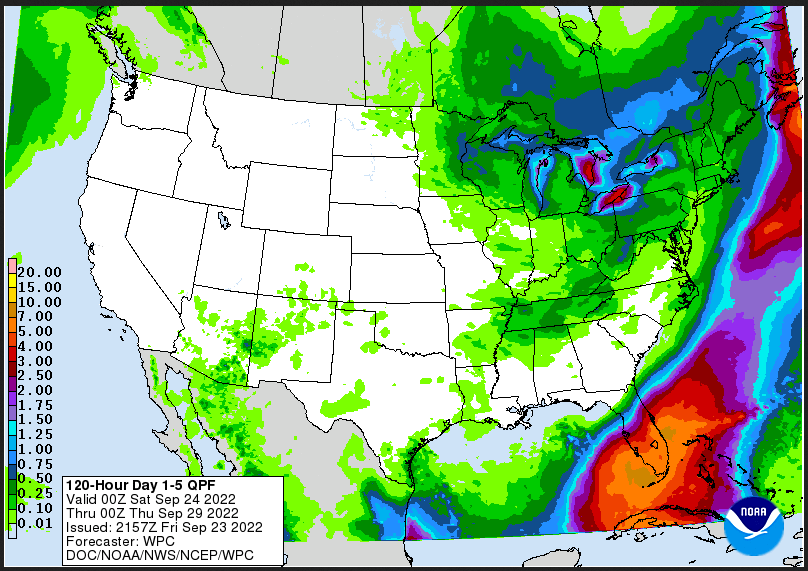
| Warm in the West and cool and wet in the East. |
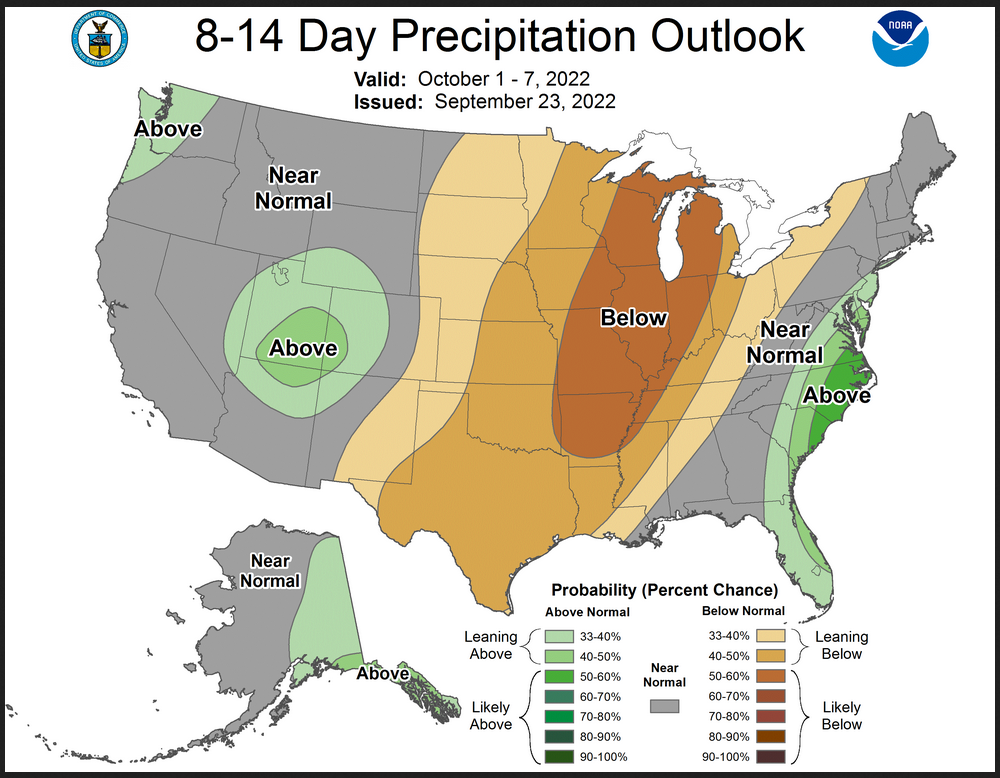
Now we look at “Outlook” maps for three time periods. Days 6 – 10, Days 8 – 14, and Weeks 3 and 4. An outlook differs from a forecast based on how NOAA uses these terms in that an “outlook” presents information as deviation from normal and the likelihood of these deviations.
I have provided the maps so you do not need to click to get them. But they do not update daily. But you can get the current images simply by clicking on the links provided. Then hit the return arrow at the upper left of your screen to return to the article. There is no need to do that right away since what is published today is up to date. The Week 3 – 4 Outlook only updates on Fridays.
Below are the links to obtain updates and additional information.
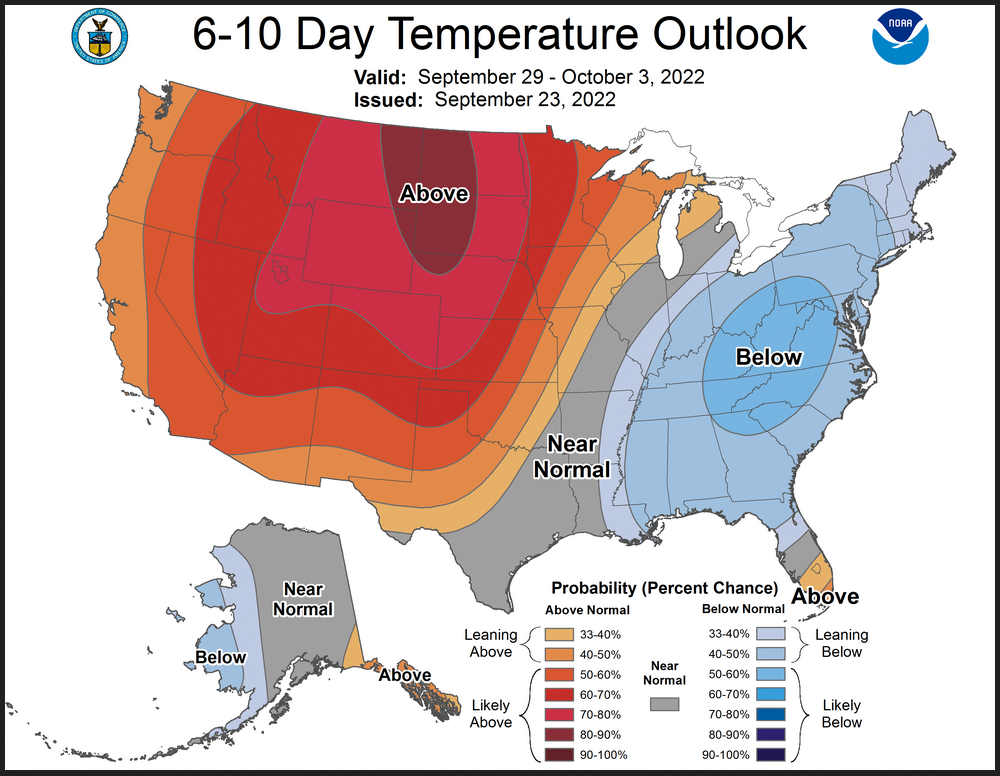
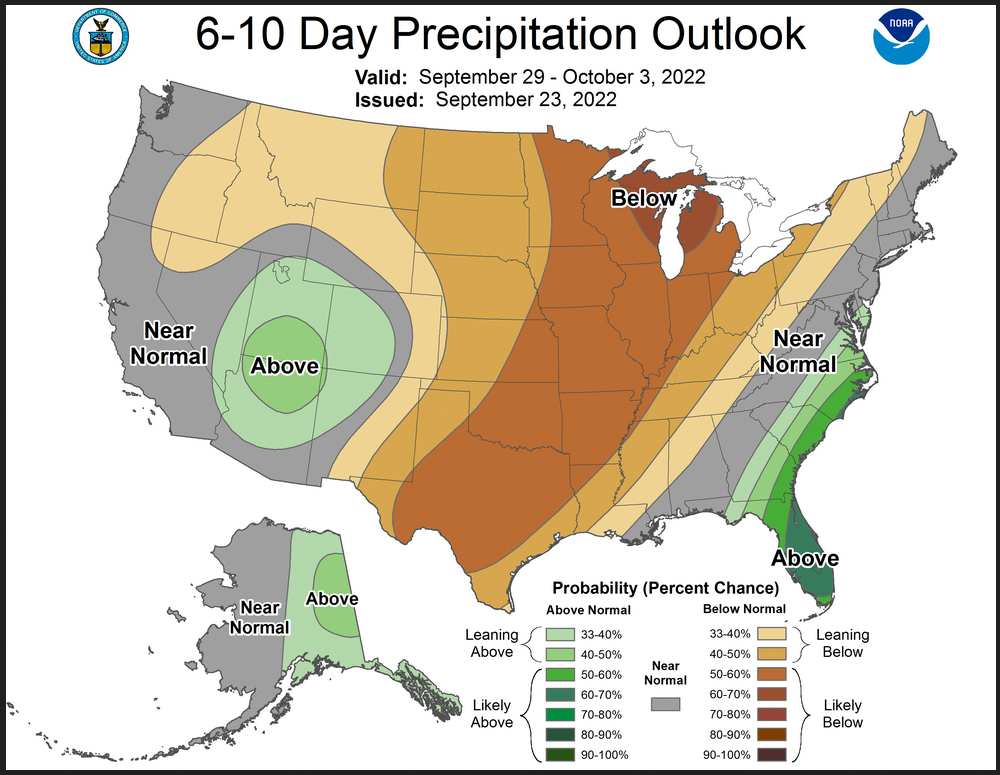
| The West is warm and the East is cool and the Great Plains are dry. There is a remnant of tropical moisture in the Four Corners area. |
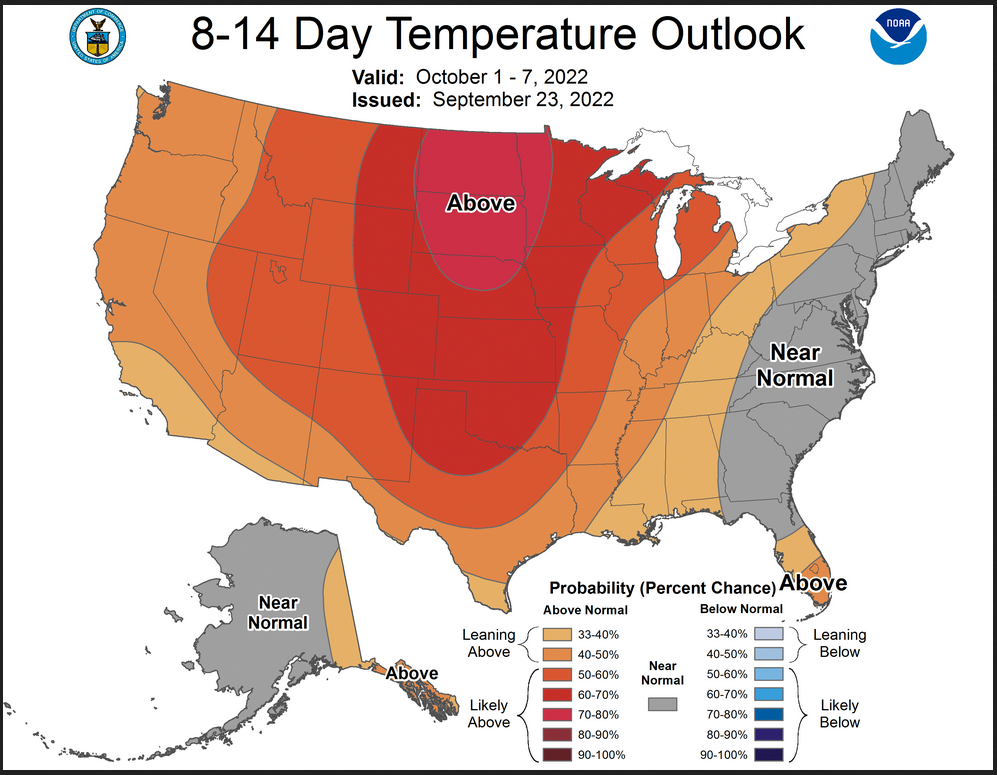
| The pattern moves slowly east. |
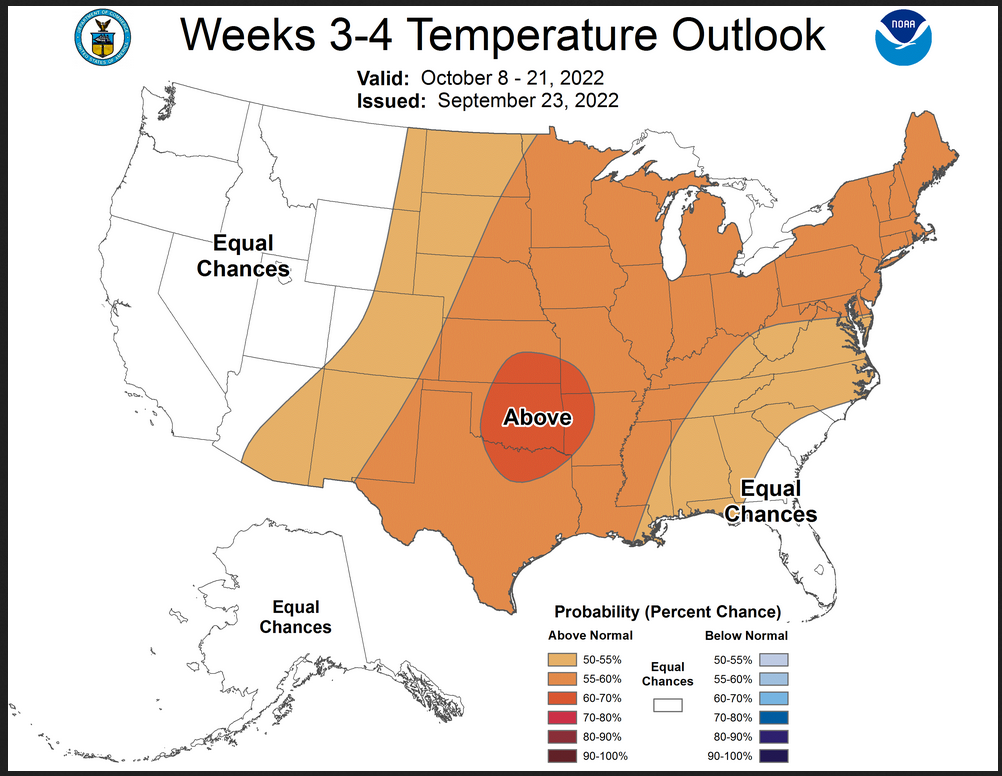
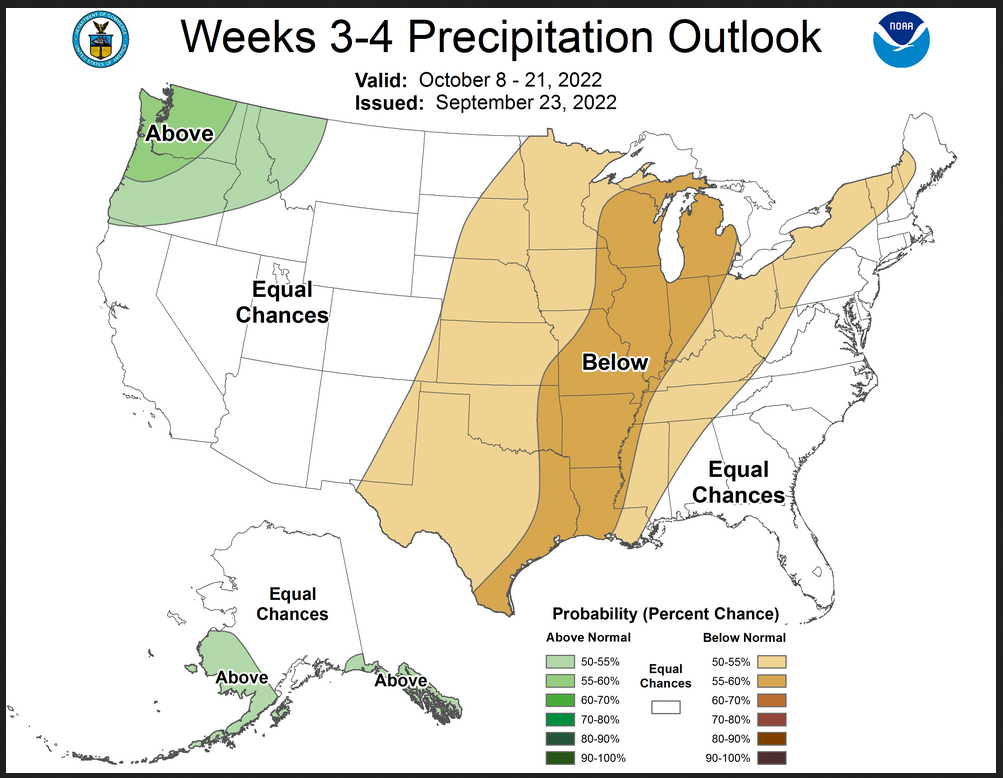
Now we address Weeks 3 and 4. This is a time frame that is very important. It is half of the 28-Day forecast period. That is why we include the discussion that accompanies the maps.
Prognostic Discussion for Week 3-4 Temperature and Experimental Precipitation Outlooks
NWS Climate Prediction Center College Park MD
300PM EDT Fri Sep 23 2022Week 3-4 Forecast Discussion Valid Sat Oct 08 2022-Fri Oct 21 2022
For the Weeks 3-4 forecast period, La Niña conditions are expected to persist in the tropical Pacific while the Madden-Julian Oscillation (MJO) is forecast to be inactive. Statistical guidance for the Week 3-4 period based on tropical teleconnections confirms MJO signals are weak and that ENSO and Decadal Trend are the primary contributions to the background climate state as we approach the forecast period. This outlook is based on a combination of operational and experimental dynamical model guidance as well as statistical guidance, including the experimental Linear Inverse Model (LIM) at CPC.
The dynamical models broadly agree that the weeks 3-4 average anomalous 500mb height pattern includes above-average heights across CONUS and below-average heights to the west or south of Alaska during the forecast period. The troughing pattern near Alaska is closer to the mainland in week-3 and retrogrades west in week-4. Temperature probabilities for the weeks 3-4 period are generally low for Alaska indicating near-normal conditions may be expected on average during the forecast period.
The models agree that the ridging over CONUS brings above-average temperatures to the central region of the country with the highest probabilities located in parts of the Southern Plains. However a couple models indicate a weakness in the probabilities for the Rocky Mountains and westward, thus Equal Chances is forecast for those areas. Models also indicate weaker, and inconsistent probabilities along the Eastern Seaboard, hence Equal Chances are forecast there as well.
Consistent with the anomalous ridging pattern, below-average precipitation is expected for a broad area in central CONUS. Models agree on a wetter than average signal for the Pacific Northwest and disagree on the conditions along the Eastern Seaboard, thus Equal Chances are forecast in that area. The uncertainty of the position of the troughing axis in the dynamical guidance led to an Equal Chances forecast for precipitation for much of Alaska, except along the Aleutian Islands and parts of the Alaska Panhandle, where a slight tilt toward above-average precipitation is favored by most models.
The SubX multi-model ensemble forecast for Hawaii indicates moderate to strong probabilities of above-average temperatures for all islands and moderate chances of above-average rainfall for Hilo and Kahului but weaker probabilities for above-average rainfall in Honolulu and Lihue.
| It is important to note that the Week 3 -4 Outlook is prepared by a different team than the 6 -10 and 8 – 14 day Outlooks. |
Now switching over to Part II of this article which is our regular 48-Hr Forecast which also includes links for tropical updates and in some cases the NHC maps for storms that are near-term threats.
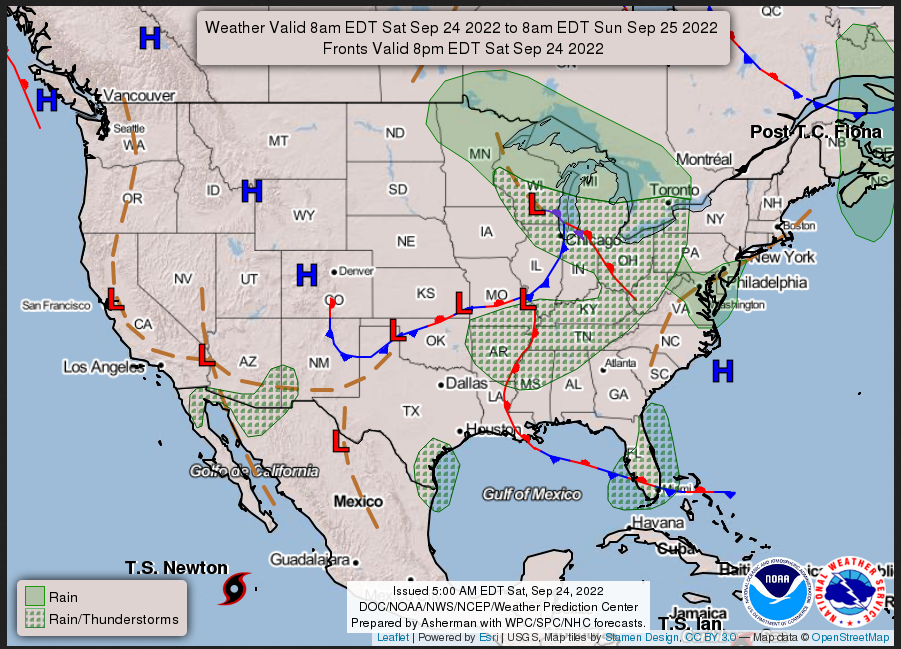
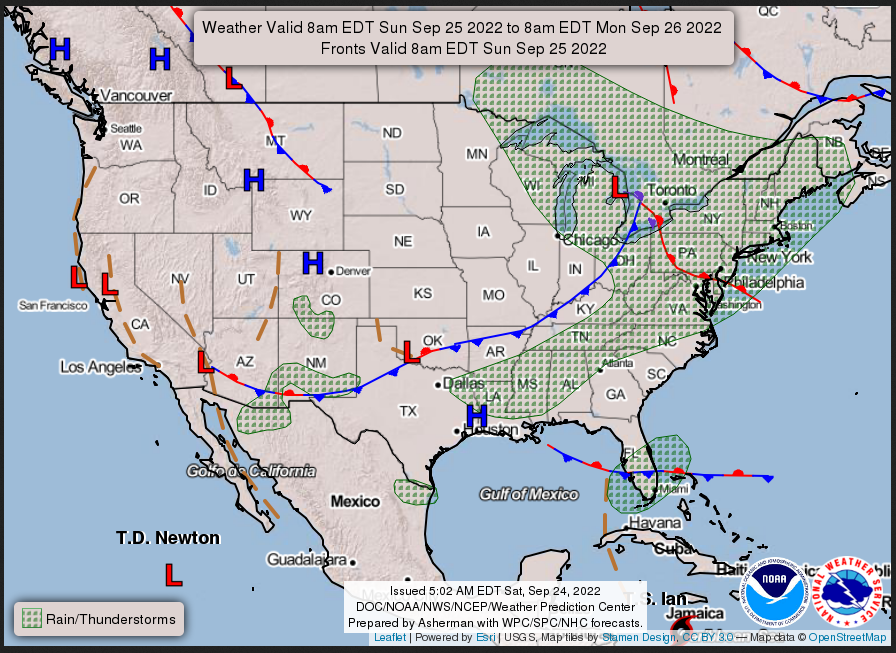
Here is what we are paying attention to today and the next 48 hours from this morning’s NWS Forecast.
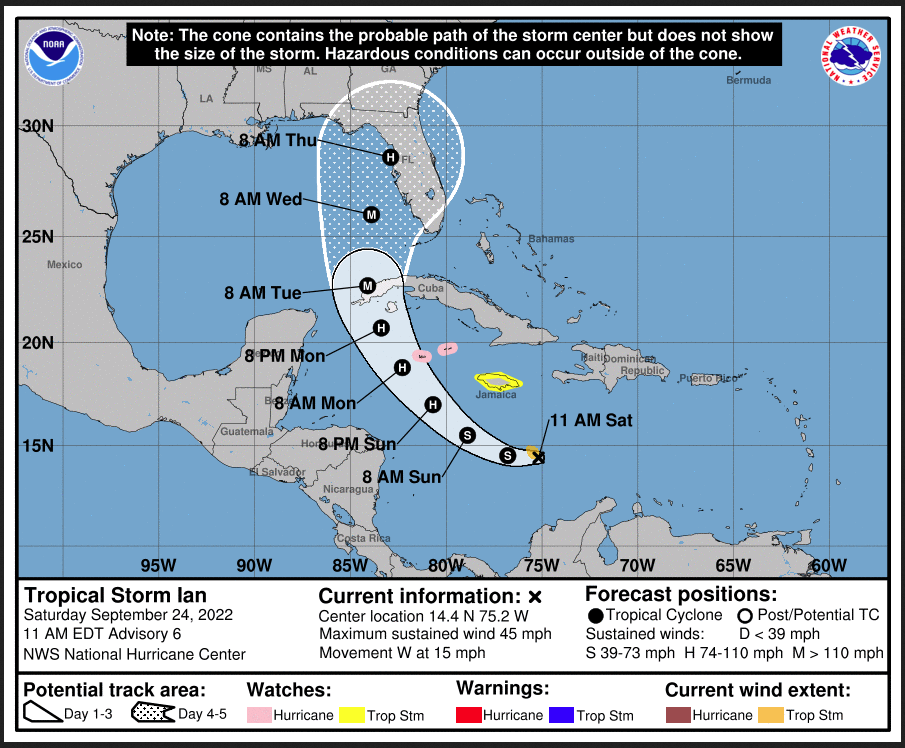
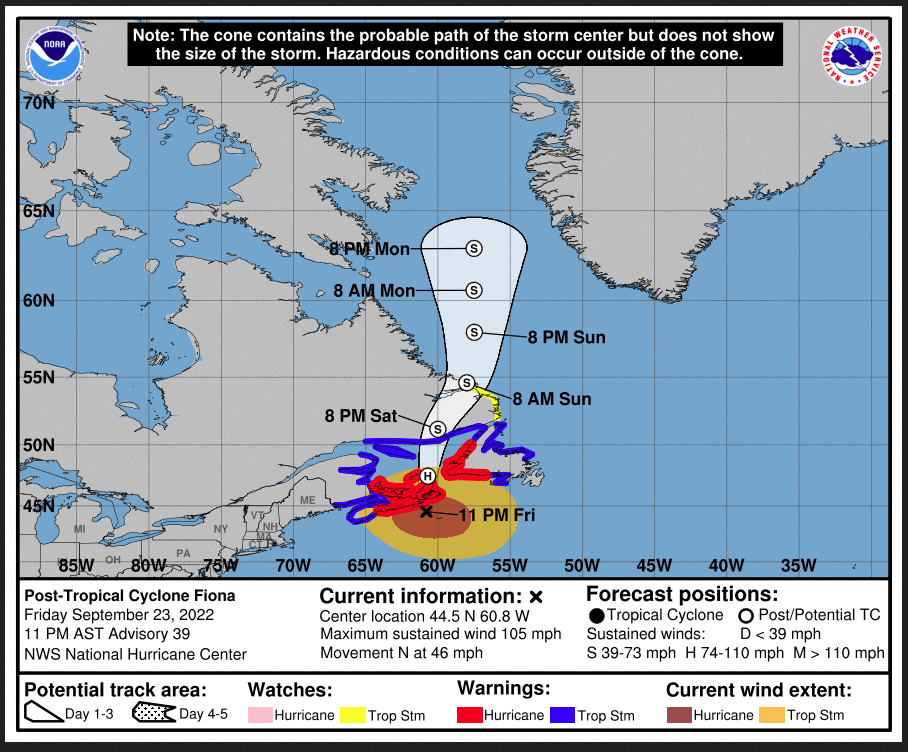
...First taste of autumnal weather in the eastern U.S. this weekend will
be followed by unsettled weather on Monday...

...Blustery northwest winds from the outer edge of Fiona brush up against
eastern Maine today...

...Heat is expected over southern Plains for the next couple of days...

The weekend will begin with a fresh surge of cool Canadian air providing
the first taste of fall weather along the East Coast while an
exceptionally intense storm impacts the Canadian Maritimes.  This storm,
which originated from the powerful category-4 Hurricane Fiona, is forecast
to bring blustery winds across Maine today.  In contrast, light winds
associated with a cool high pressure system is providing favorable
conditions for frost to form this morning across portions of the interior
Northeast.

Farther upstream, showers and a few thunderstorms ahead of a
weak low pressure system are expected to spread eastward across the Great
Lakes through Sunday.  This system is forecast to gradually develop and
expand as it moves through the Great Lakes region.  The pleasant fall
weather along the East Coast today will give way to a gradual expansion of
unsettled weather later this weekend and into Monday especially over the
Northeast.

Meanwhile, an amplifying ridge in the West will allow for sunny/clear
skies and above normal temperatures for the region this weekend.  The
southern Plains will experience a couple more days of heat under the
eastern edge of the ridge where high temperatures reaching into the upper
90's could challenge some daily records.  Over southern portions of
Florida, a stalled out front will provide the focus for isolated to
scattered showers and thunderstorms this weekend.  By Monday, attention
will be drawn to the Caribbean Sea where Tropical storm Ian is currently
forecast to intensify into a hurricane and move toward western Cuba.  The
outer rainbands associated with Ian could reach the Keys and southern
Florida later on Monday with a passing heavy downpour and gusty winds.
(It is updated twice a day and these updates can be found here.
Maps that relate the forecast to geography can be found by clicking Here for Day 1 and Here for Day 2. (I will update these on Saturday morning so they will be current at that point).
Here is a 60-hour animated forecast map that shows how the short-term forecast is expected to play out.
If it needs to be updated click here.
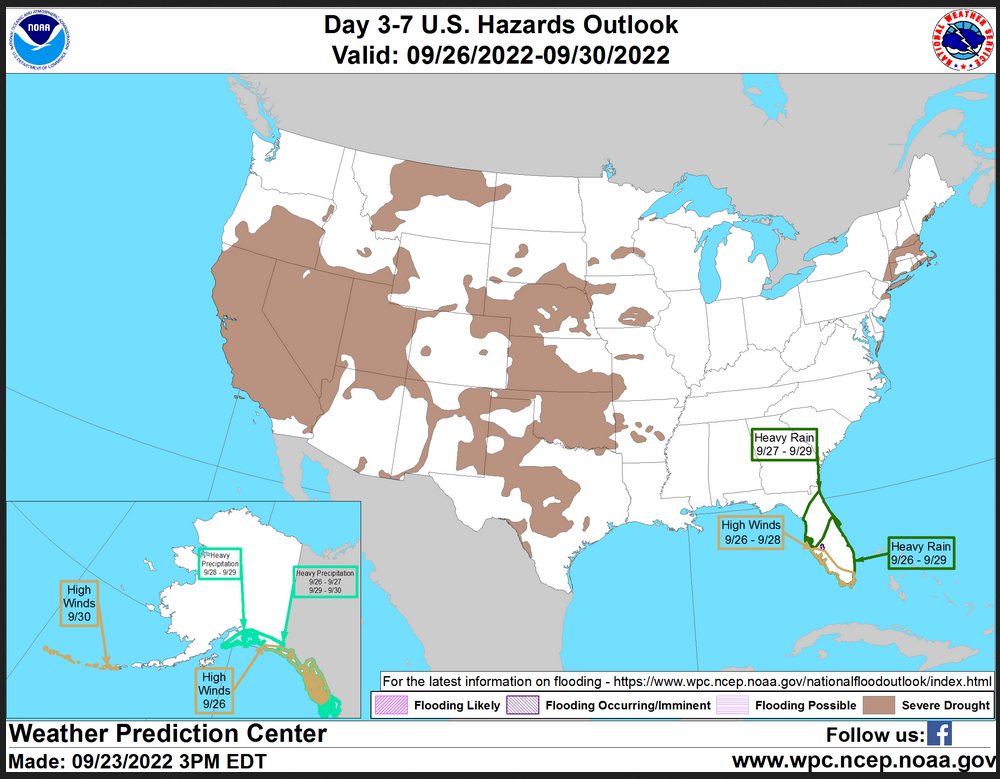
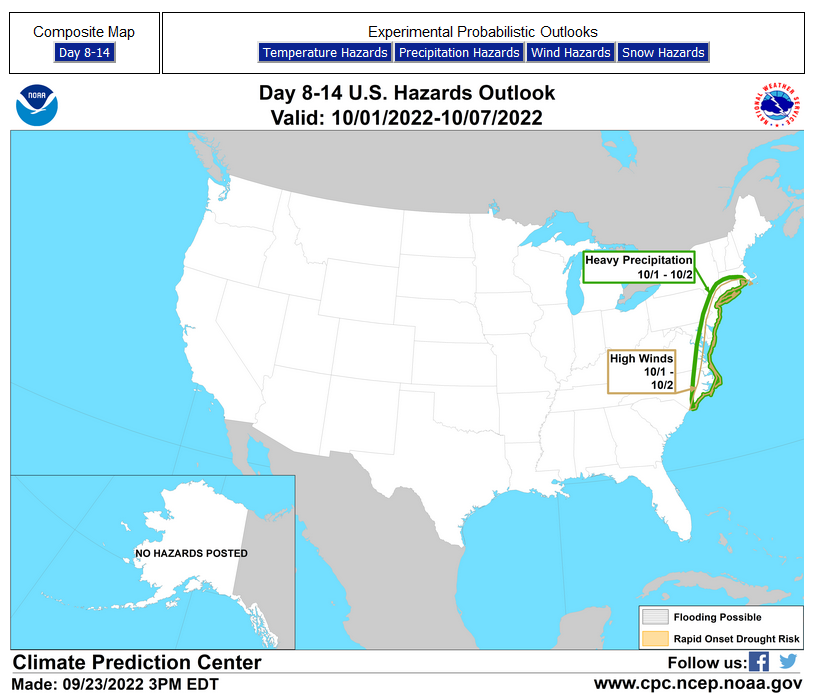
HAZARDS OUTLOOKS
Click here for the latest complete Day 3 -7 Hazards forecast which updates only on weekdays. Once a week probably Monday or Tuesday I will update the images. I provided the link for readers to get daily updates on weekdays. Use your own judgment to decide if you need to update these images.
Worldwide Tropical Forecast
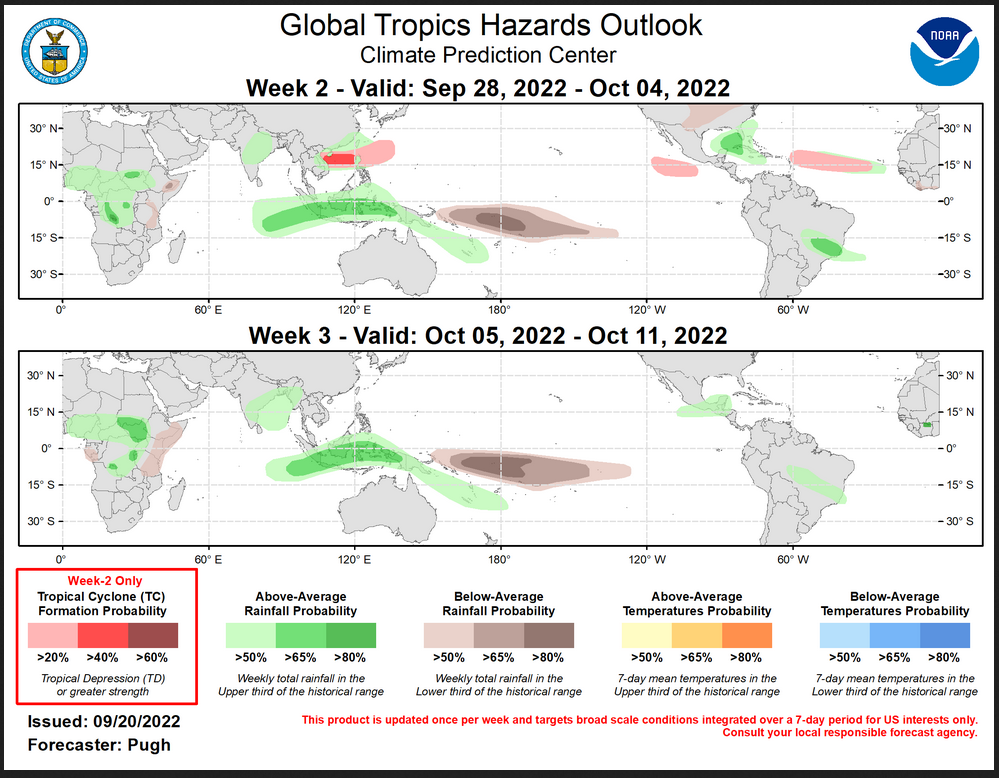
(This graphic updates on Tuesdays) If it has not been updated, you can get the update by clicking here
Detailed Maps and Reports for the Western Atlantic and the Pacific Oceans
Below are four links leading to maps that summarize the situation for the Atlantic, Eastern, Central Pacific and Western Pacific. Additional information can be accessed by clicking HERE When there are active storms we show the actual maps. With WordPress the maps do not auto-update so we have to manually update them when there is storm activity. That is why we show the links.
First the Atlantic
Click to view the forecast map and have access to additional information https://www.nhc.noaa.gov/gtwo.php ?basin=atlc&fdays=5
Then Eastern Pacific
Click to view the forecast map and have access to additional information https://www.nhc.noaa .gov/gtwo.ph p?basin=epac&fdays=5
Then Central Pacific
Click to view the forecast map and have access to additional information https://www.nhc.noaa.gov/gtwo.php?basin=cpac&fdays=5
And the Western Pacific
Click to view the forecast map and have access to additional information https://www.metoc.navy.mil/jtwc/jtwc.html
World Forecast for Day 6 (Currently Set for Day 6 but the reader can change that)
World Weather Forecast produced by the Australian Bureau of Meteorology. Unfortunately, I do not know how to extract the control panel and embed it into my report so that you could use the tool within my report. But if you visit it Click Here and you will be able to use the tool to view temperature or many other things for THE WORLD. It can forecast out for a week. Pretty cool. Return to this report by using the “Back Arrow” usually found top left corner of your screen to the left of the URL Box. It may require hitting it a few times depending on how deep you are into the BOM tool.
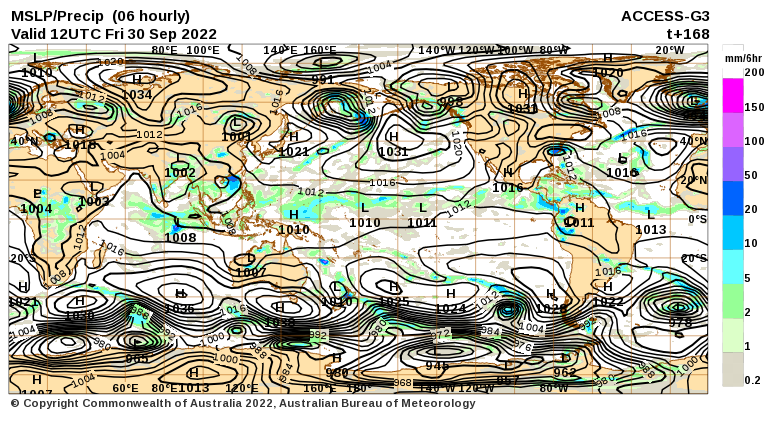
Below are the current worldwide precipitation and air pressure forecasts for six days out. They will not auto-update and right now are current for Day 6. If you want the forecast for a different day Click Here I will try to update this map each day but you have the link so you can access the dashboard and get a wide variety of forecasts. I mostly rely on the reader to interpret world maps.
For this map, areas of expected precipitation for the date and time shown are clearly shown. The number of High-Pressure systems shown is called the Wave Number. Maybe I will discuss WN someday. But it shows how many Rossby Waves there are around the World. Sometimes they are hard to count. Counting Low-Pressure systems should provide the same WN. Rossby Waves are the way the temperature distribution of the Planet remains in balance. It is basically the science of fluid dynamics. It can be very helpful in predicting the movement of weather patterns. You can snip an area of interest and move it into MS Paint and enlarge it.
Month to Date Information
Temperature month to date can be found at https://hprcc.unl.edu/products/maps/acis/MonthTDeptUS.png
Precipitation month to date can be found at https://hprcc.unl.edu/products/maps/acis/MonthPNormUS.png

Amazing report as always Sig.
I am glad you enjoyed it. Of course, the focus of the Friday article is a look ahead. But the information I included on August worldwide was very interesting at least to me. Is there other information that you would find useful to be included in my articles?