Updated at 4 pm EDT September 19, 2022 with respect to Hurricane Fiona and the Day 1 and Day 2 CONUS forecasts
The heat is moving from west to east. It is fairly dry and that also is tending to move from west to east also. It is almost an Autumn pattern.
NOAA updates many of its weather outlooks daily or even more frequently and in many cases issues a discussion with those outlooks. We provide a daily report which focuses on the shorter-term predictions but has links to all the partial-month outlooks. One of the reports issued by NOAA only gets updated on Fridays and since this covers weeks 3 and 4 it is very important. The discussion that gets issued with this week 3-4 NOAA report is often where possible changes to the weather pattern are first identified.
So we have decided to issue a special report on Fridays (which most will read on Saturday) in which for a subset of the information, we show the actual forecast maps not just provide the links. This makes it easier for the reader. We will also include at the end of the article the other information from the daily article
When the Week 3-4 Outlook is issued on Friday, we have a 28-day view of the future. It is important to recognize that the forecasts do not always work out as predicted. But in the article, there are links to obtain updated forecasts. In some weeks the 28-Outlook is published a day or two late because there are other articles to publish and we want each to be featured on the Econcurrents.com website for a while. So we can end up with a 27-day or 26-day outlook. But the other maps usually are up to date at the time of publishing.
The regular 48-hour forecast article is included in this article and follows the 28-Day Analysis.

What NOAA is predicting for the next 28 days.
We will start with the short-term – It is up to date as of today. If you look at this article after today you can click the links to update (plus you will end up with a lot of additional information)
| Temperature (Maximum Anomaly) for the next five days | Precipitation (Five days of cumulative precipitation) |
| https://www.wpc.ncep.noaa.gov/medr/me dr_mean.shtml | https://www.wpc.ncep.noaa.gov/qpf/day1-7.shtml |
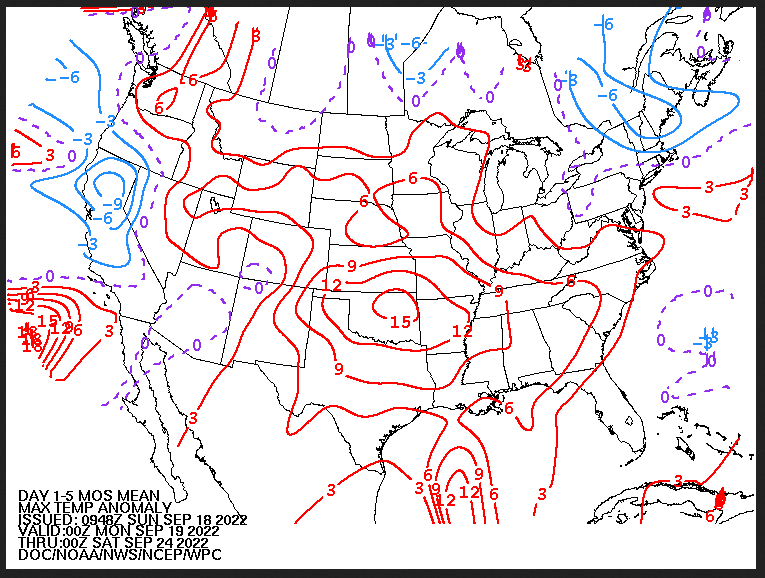
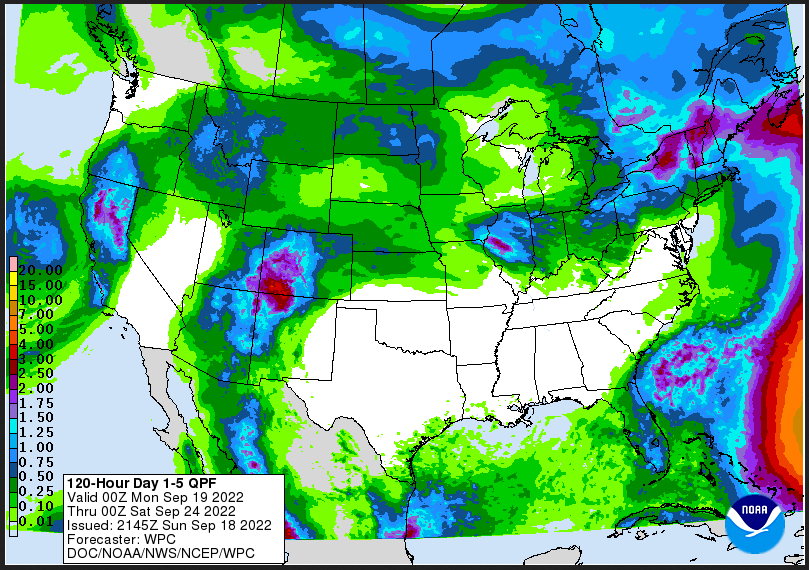
| Most of the warm temperature anomalies are in the Central Great Plains. The precipitation is both across the Northern Tier and in the Monsoon States. There is a storm off the U.S. West Coast. |
Now we look at “Outlook” maps for three time periods. Days 6 – 10, Days 8 – 14, and Weeks 3 and 4. An outlook differs from a forecast based on how NOAA uses these terms in that an “outlook” presents information as deviation from normal and the likelihood of these deviations.
I have provided the maps so you do not need to click to get them. But they do not update daily. But you can get the current images simply by clicking on the links provided. Then hit the return arrow at the upper left of your screen to return to the article. There is no need to do that right away since what is published today is up to date. The Week 3 – 4 Outlook only updates on Fridays.
Below are the links to obtain updates and additional information.
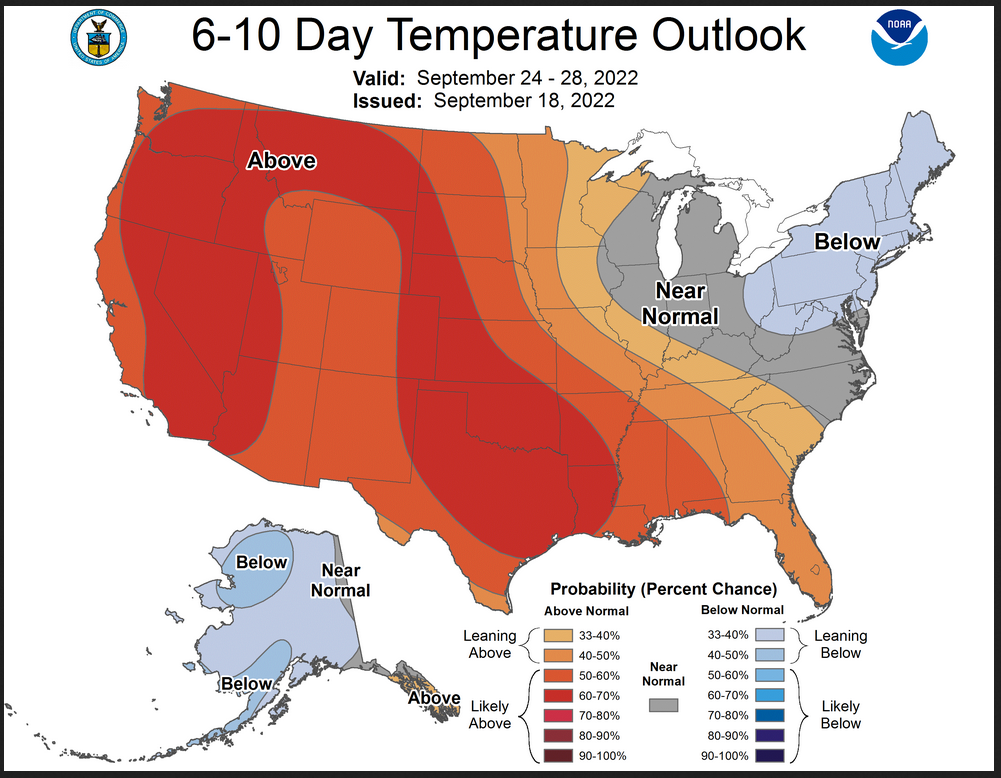
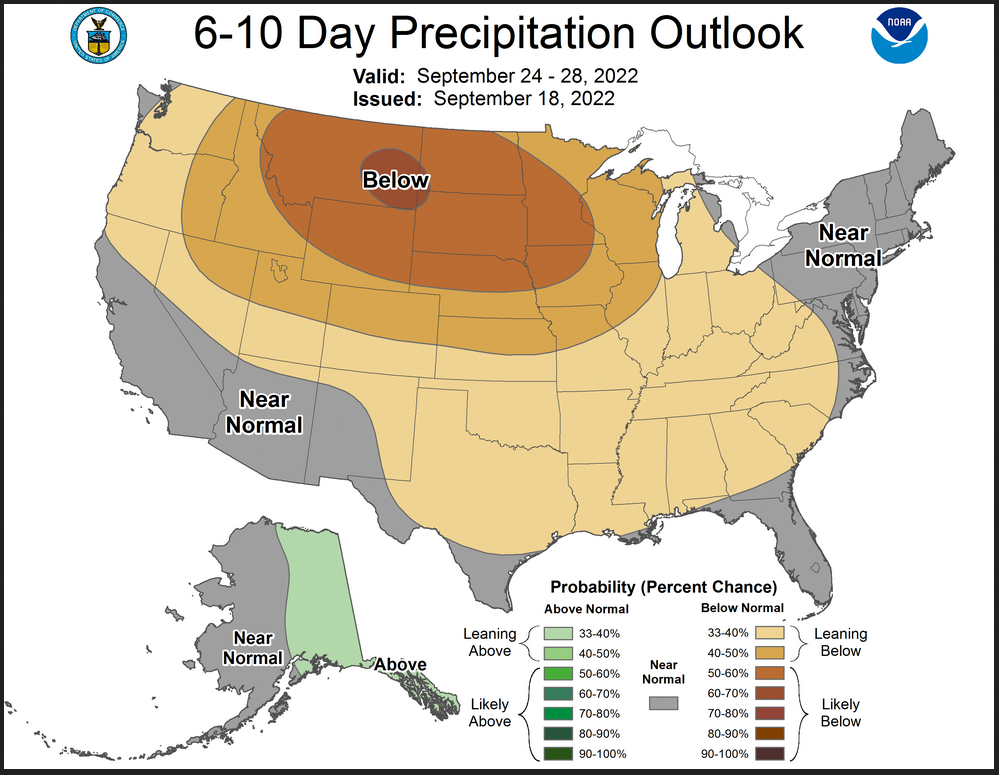
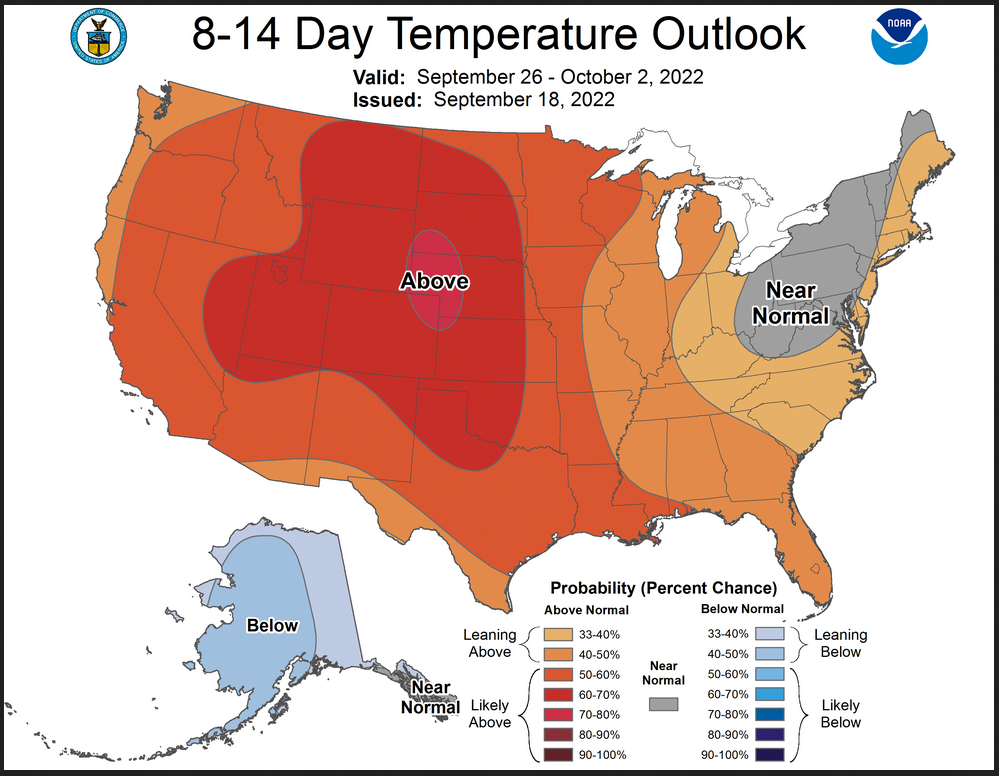
| The West is warm and the Northern tier is dry during this time period. The Northeast and Alaska are cool. |
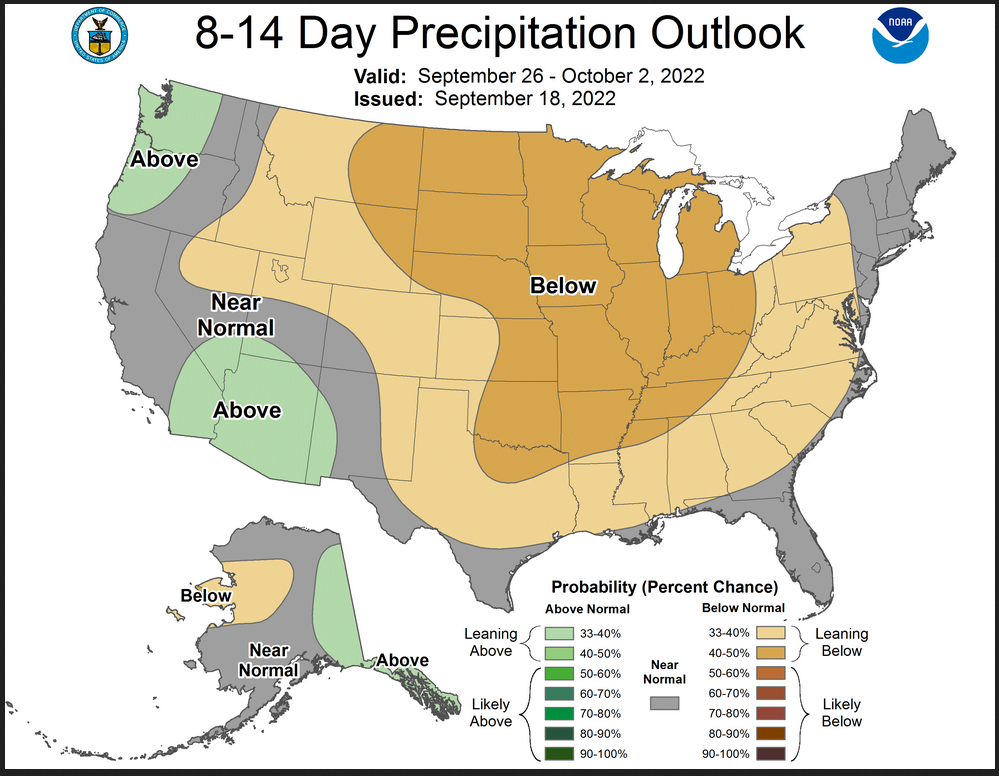
| The West remains warm but wet in places. The large dry anomaly moves to the east. |
Now we address Weeks 3 and 4. This is a time frame that is very important. It is half of the 28-Day forecast period. That is why we include the discussion that accompanies the maps.
Prognostic Discussion for Week 3-4 Temperature and Experimental Precipitation Outlooks
NWS Climate Prediction Center College Park MD
300PM EDT Fri Sep 16 2022Week 3-4 Forecast Discussion Valid Sat Oct 01 2022-Fri Oct 14 2022
The tropical pattern continues to be dominated by La Niña conditions over the Pacific, which were unusually strong throughout the Boreal summer months. While the Madden-Julian Oscillation (MJO) was active throughout the summer as well, destructive interference with the strong La Niña base state limited the ability for organized enhanced convective envelopes to cross the Pacific to the Western Hemisphere. Recent observations reflect a similar pattern, with a weak MJO projection due to destructive interference with ENSO over the Pacific following enhanced activity across the Indian Ocean and Maritime Continent through late August. Statistical guidance for the Weeks 3-4 period based on tropical teleconnections is therefore most similar to composite forecasts based on past cold ENSO events, with ENSO and long term trends comprising the main contributors to the Multivariate Linear Regression (MLR) tool.
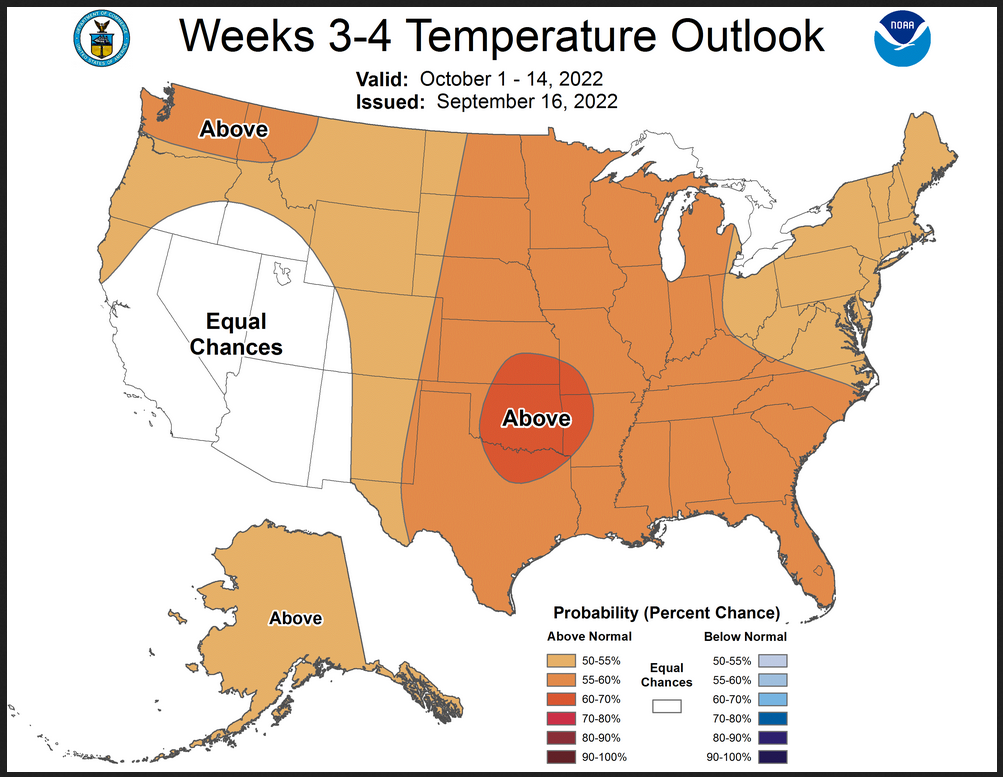
This Weeks 3-4 outlook is based on a combination of operational and experimental dynamical model guidance and statistical guidance that is reflective of the ENSO base state. The anticipated 500-hPa height anomaly pattern is fairly consistent among the dynamical models, showing a shift from the forecast Week-2 pattern, which favors ridging over western North America and shallow troughing over the east, towards increasing ridging over the east-central CONUS and a weakness across the Southwest. The upstream pattern during the Weeks 3-4 period favors troughing over the Bering Sea, with above-average heights across the Northwest Pacific, which would promote enhanced southerly flow into southern Alaska. This pattern is broadly consistent with the MLR-based height anomaly forecast, leading to a fairly straightforward temperature forecast.
Consistent with the idea of anomalous ridging over the east-central CONUS, above-average temperatures are favored for the entire CONUS east of the Rockies, with the highest probabilities existing across the south-central Plains. Experimental Weeks 3-4 heatwave tools based on dynamical model guidance indicate a potential for periods of late season extreme heat across the Southern Plains during the outlook period. Elsewhere, several tools indicate a potential for periods of cooler conditions for the Northeast, leading to slightly reduced probabilities of above-normal temperatures. Equal chances for below- and above-normal temperatures are maintained for the southwestern CONUS and central Rockies, where near-normal heights are favored by the dynamical model guidance. While the manual blend of dynamical and statistical model guidance keeps fairly low probabilities for the Northwest, an experimental subsampling of the highest skill ensemble model forecasts provides a substantially warmer solution for the Northwest, meriting an increase in above-normal temperature probabilities. Above-normal temperatures are favored across all of Alaska with anticipated southerly flow.
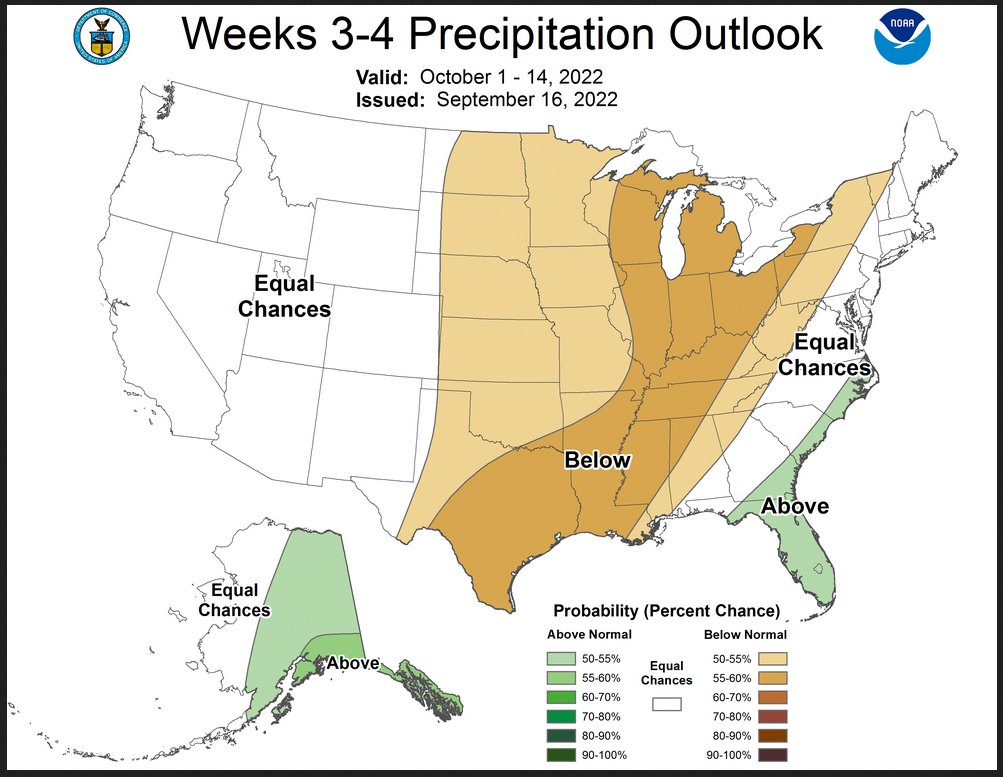
The manual blend of operational model guidance yielded mostly low precipitation probabilities across the U.S., with only a small area across Kentucky and Tennessee showing enhanced chances for below-average precipitation exceeding 55 percent. Both the multi-model ensemble of the Subseasonal Experimental suite of models (Sub-X MME) and the subsampling tool were more bullish favoring below-normal precipitation across much of the Plains, Midwest, and Northeast during the period, which seems reasonable given the potential for anomalous ridging. Therefore, this outlook shows a fairly broad swath of below-normal precipitation favored from the southern Plains through the Great Lakes region and interior Northeast. In contrast, most of the models feature above-average precipitation across the Florida Peninsula, with many tools bringing the enhanced signal northward through the coastal Carolinas, possibly due to tropical activity. Across Alaska, above-average precipitation is favored for the eastern half of the state, with the highest probabilities across southeastern Alaska and the Panhandle due to the favored southerly flow.
Contrary to a typical La Niña response, the operational dynamical models slightly favor above-average precipitation for Hawaii, while the Sub-X MME centers the wet signal to the north of the island chain. Due to these conflicting signals, equal chances for below- and above-average precipitation are maintained for the Weeks 3-4 period. The temperature guidance is more consistent, with all of the available guidance favoring above-normal temperatures.
| It is important to note that the Week 3 -4 Outlook is prepared by a different team than the 6 -10 and 8 – 14 day Outlooks. |
Now we take another look at the prior month of August, 2022 and the three months June through August.
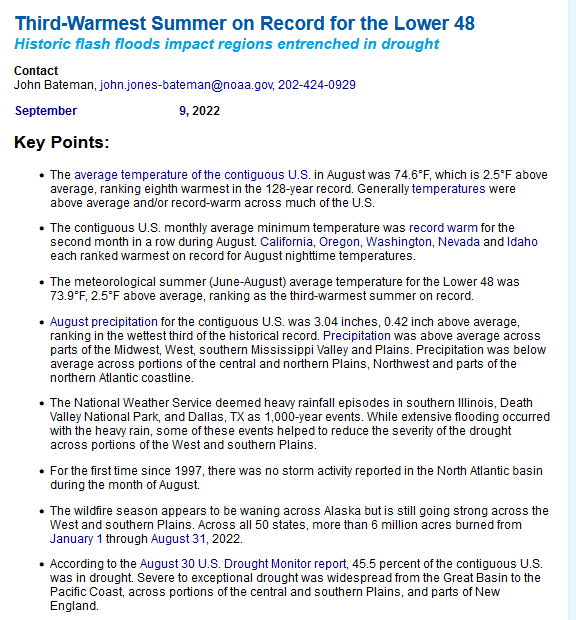
| It was a top three for the lower 48 but a top six for the World so it really was not that extraordinary. Things tend to level off with La Nina and then there is step up in temperature during the next El Nino. |
Now switching over to Part II of this article which is our regular 48-Hr Forecast which also includes links for tropical updates.
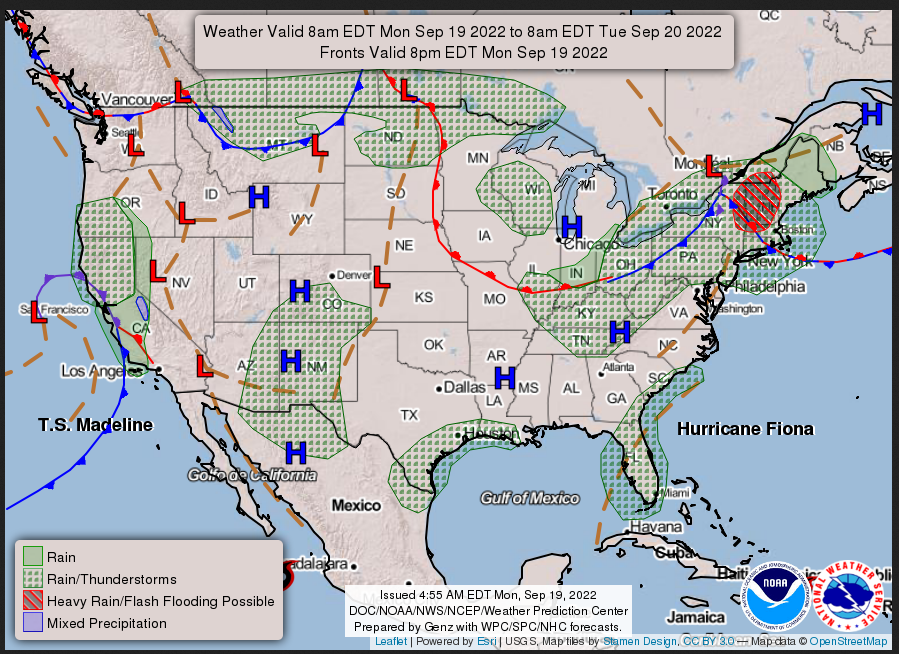
Here is what we are paying attention to today and the next 48 hours from this morning’s NWS Forecast.
(It is updated twice a day and these updates can be found here.
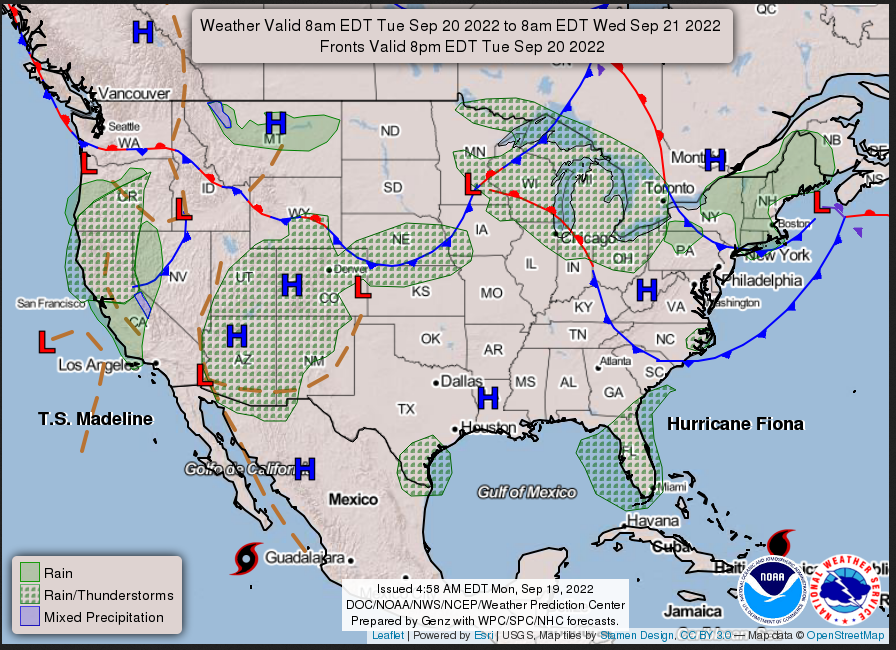
...There is a Slight Risk of excessive rainfall over parts of Northern New
England through Tuesday morning...

...There is a Marginal Risk of excessive rainfall over parts of California
and the Southwest/Southern Rockies through Wednesday morning...

...Temperatures will be 10 to 20 degrees above average over parts of the
Central Plains/Middle Mississippi Valley...

A front extending across the Great Lakes to the Central Plains will move
slowly eastward to the Northeast Coast by Tuesday. The front will trigger
showers and thunderstorms along and ahead of the boundary producing areas
of heavy rain. Therefore, the WPC has issued a Slight Risk of excessive
rainfall over parts of Northern New England through Tuesday morning. The
associated heavy rain will create mainly localized areas of flash
flooding, with urban areas, roads, and small streams the most vulnerable.

Furthermore, the showers and thunderstorms will be strong to severe.
Therefore, the SPC has issued a Marginal Risk of severe thunderstorms over
parts of the Northeast through Tuesday morning. The hazards associated
with these thunderstorms are frequent lightning, severe thunderstorm wind
gusts, hail, and a minimal threat of tornadoes.

Meanwhile, low pressure off the California Coast will stream moisture into
parts of Northern/Central California, producing rain with the possibility
of heavy rain over the region through Wednesday. Therefore, the WPC has
issued a Marginal Risk of excessive rainfall over parts of
Northern/Central California through Tuesday morning. On Tuesday, the
Marginal Risk of excessive rainfall will extend over Northern California
and parts of Oregon through Wednesday morning. The associated heavy rain
will create localized areas of flash flooding, affecting areas that
experience rapid runoff with heavy rain and burn scars.

In addition, moisture surging northward into the Southwest/Southern
Rockies and upper-level energy will aid in producing showers and
thunderstorms with the possibility of heavy rain. Therefore, the WPC has
issued a Marginal Risk of excessive rainfall over parts of
Southwest/Southern Rockies and far western Texas through Tuesday morning.
On Tuesday, the Marginal Risk of excessive rainfall will continue over
parts of the Southwest/Southern Rockies and extend into parts of the Great
Basin/Central Rockies through Wednesday morning. The associated heavy rain
will create localized areas of flash flooding, affecting areas that
experience rapid runoff with heavy rain and burn scars.

Moreover, a front over the Northern High Plains into the Pacific Northwest
will move eastward to the Great Lakes on Tuesday into Wednesday. The
system will produce showers and thunderstorms over parts of the Northern
Plains on Monday, moving into the Great Lakes on Tuesday. On Tuesday, the
showers and thunderstorms will be strong to severe. Therefore, the SPC has
issued a Marginal Risk of severe thunderstorms over parts of Wisconsin and
Michigan from Tuesday into Wednesday morning. The hazards associated with
these thunderstorms are frequent lightning, severe thunderstorm wind
gusts, hail, and a minimal threat of tornadoes.

Additionally, temperatures will be 10 to 20 degrees above average over
parts of the Central Plains/Middle Mississippi Valley. Temperatures will
be in the 90s to near 100 over the region, possibly setting records on
Tuesday. Elsewhere, the SPC has issued an Elevated Risk of fire weather
over parts of the Northern Rockies on Monday, prompting Red Flag Warnings
over portions of Wyoming through Monday evening.
Maps that relate the forecast to geography can be found by clicking Here for Day 1 and Here for Day 2.
Here is a 60-hour animated forecast map that shows how the short-term forecast is expected to play out.
If it needs to be updated click here.
HAZARDS OUTLOOKS
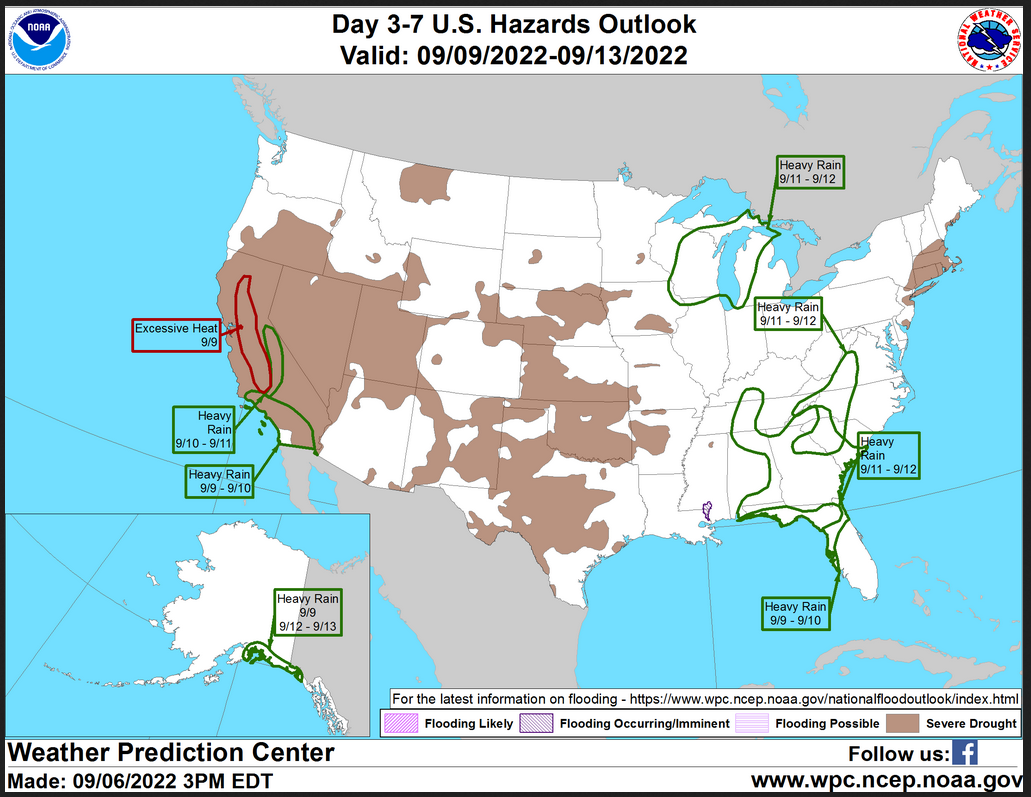
Click here for the latest complete Day 3 -7 Hazards forecast which updates only on weekdays. Once a week probably Monday or Tuesday I will update the images. I provided the link for readers to get daily updates on weekdays. Use your own judgment to decide if you need to update these images.
Worldwide Tropical Forecast
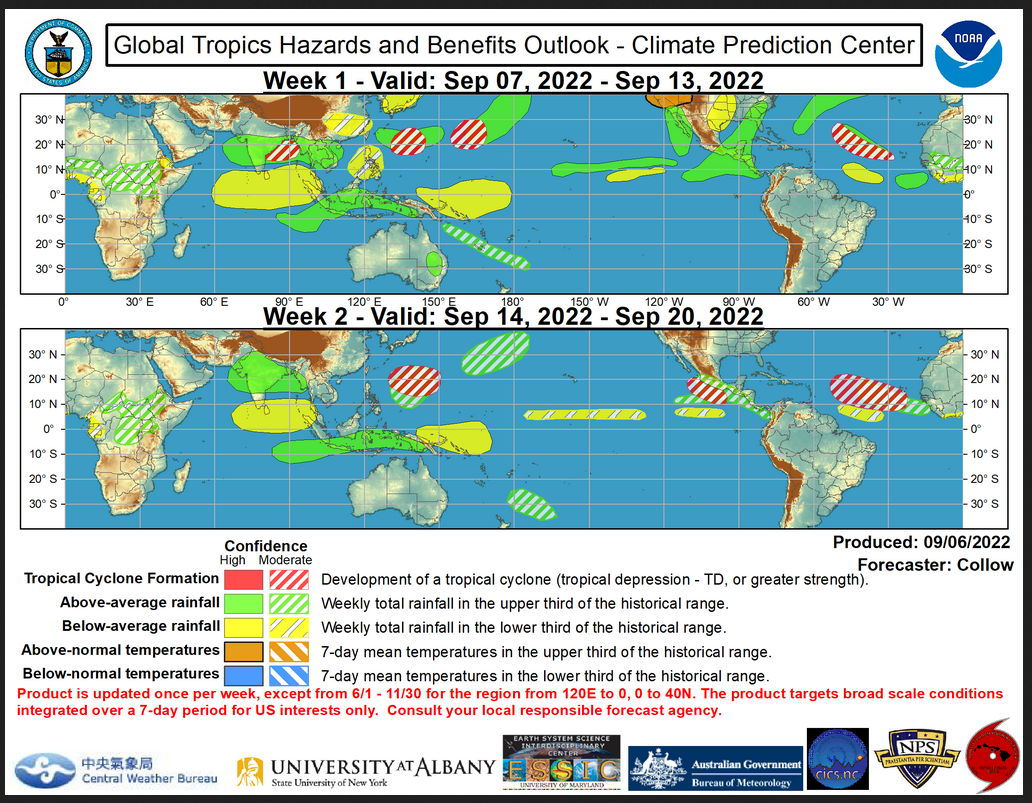
(This graphic updates on Tuesdays) If it has not been updated, you can get the update by clicking here
Detailed Maps and Reports for the Western Atlantic and the Pacific Oceans
Below are four links leading to maps that summarize the situation for the Atlantic, Eastern, Central Pacific and Western Pacific. Additional information can be accessed by clicking HERE When there are active storms we show the actual maps. With WordPress the maps do not auto-update so we have to manually update them when there is storm activity. That is why we show the links.
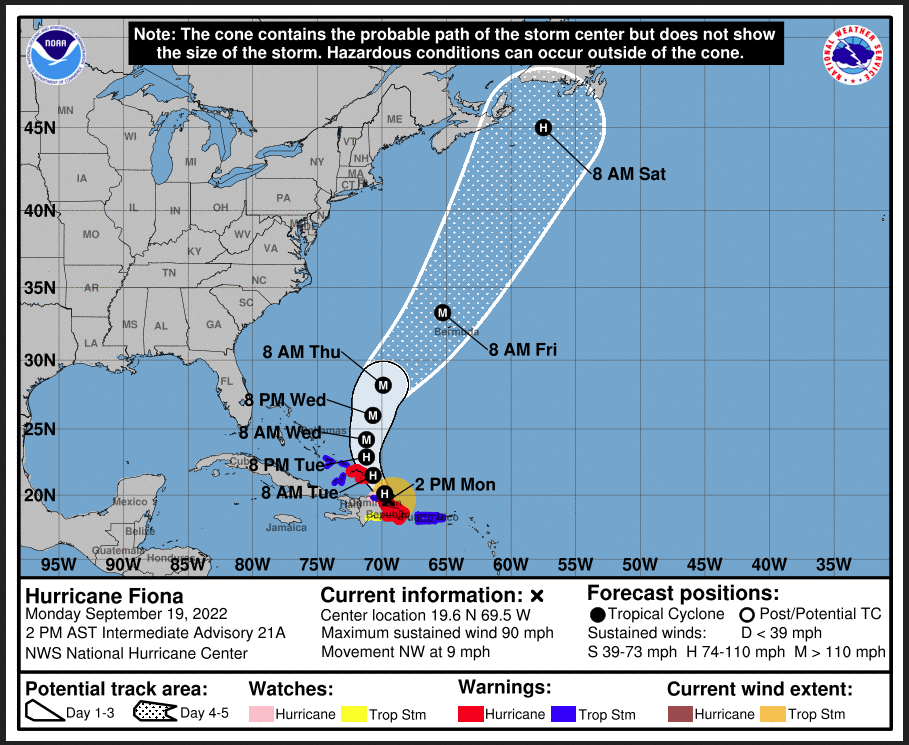
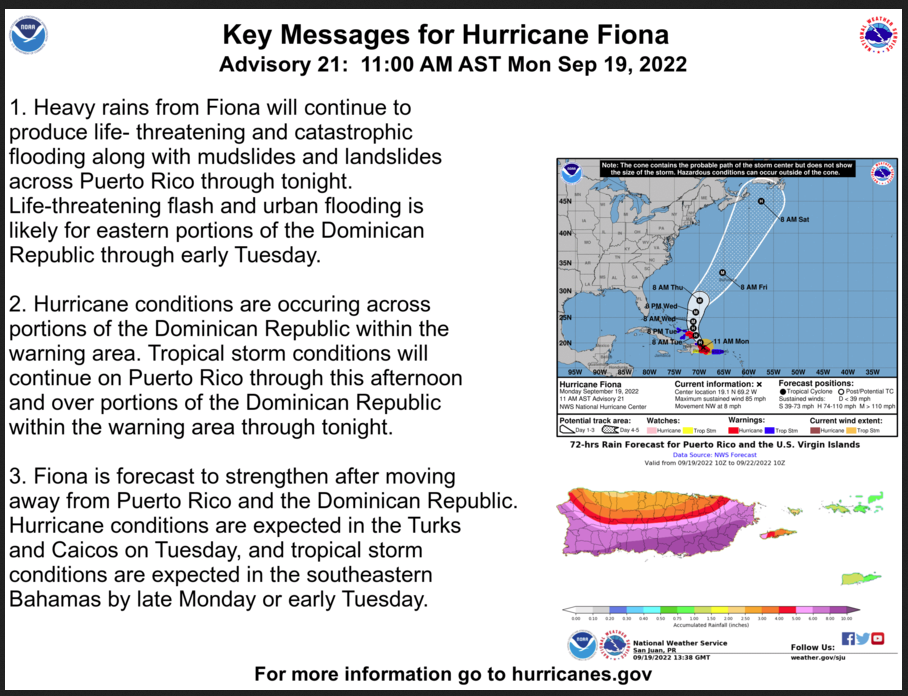
First the Atlantic
Click to view the forecast map and have access to additional information https://www.nhc.noaa.gov/gtwo.php ?basin=atlc&fdays=5
Then Eastern Pacific
Click to view the forecast map and have access to additional information https://www.nhc.noaa .gov/gtwo.ph p?basin=epac&fdays=5
Then Central Pacific
Click to view the forecast map and have access to additional information https://www.nhc.noaa.gov/gtwo.php?basin=cpac&fdays=5
And the Western Pacific
Click to view the forecast map and have access to additional information https://www.metoc.navy.mil/jtwc/jtwc.html
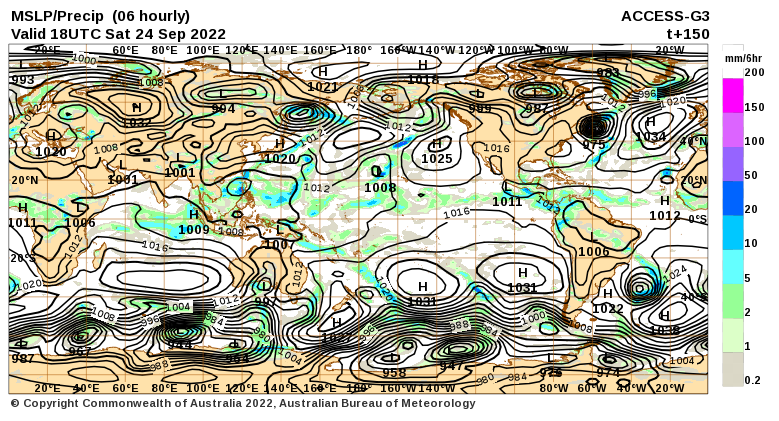
World Forecast for Day 6 (Currently Set for Day 6 but the reader can change that)
World Weather Forecast produced by the Australian Bureau of Meteorology. Unfortunately, I do not know how to extract the control panel and embed it into my report so that you could use the tool within my report. But if you visit it Click Here and you will be able to use the tool to view temperature or many other things for THE WORLD. It can forecast out for a week. Pretty cool. Return to this report by using the “Back Arrow” usually found top left corner of your screen to the left of the URL Box. It may require hitting it a few times depending on how deep you are into the BOM tool. Below are the current worldwide precipitation and air pressure forecasts for six days out. They will not auto-update and right now are current for Day 6. If you want the forecast for a different day Click Here I will try to update this map each day but you have the link so you can access the dashboard and get a wide variety of forecasts.I mostly rely on the reader to interpret world maps. For this map, areas of expected precipitation for the date and time shown are clearly shown. The number of High-Pressure systems shown is called the Wave Number. Maybe I will discuss WN someday. But it shows how many Rossby Waves there are around the World. Sometimes they are hard to count. Counting Low-Pressure systems should provide the same WN. Rossby Waves are the way the temperature distribution of the Planet remains in balance. It is basically the science of fluid dynamics. It can be very helpful in predicting the movement of weather patterns. You can snip an area of interest and move it into MS Paint and enlarge it.
 Month to Date Information
Month to date Temperature can be found at https://hprcc.unl.edu/products/maps/acis/MonthTDeptUS.png
Month to date Precipitation can be found at https://hprcc.unl.edu/products/maps/acis/MonthPNormUS.png