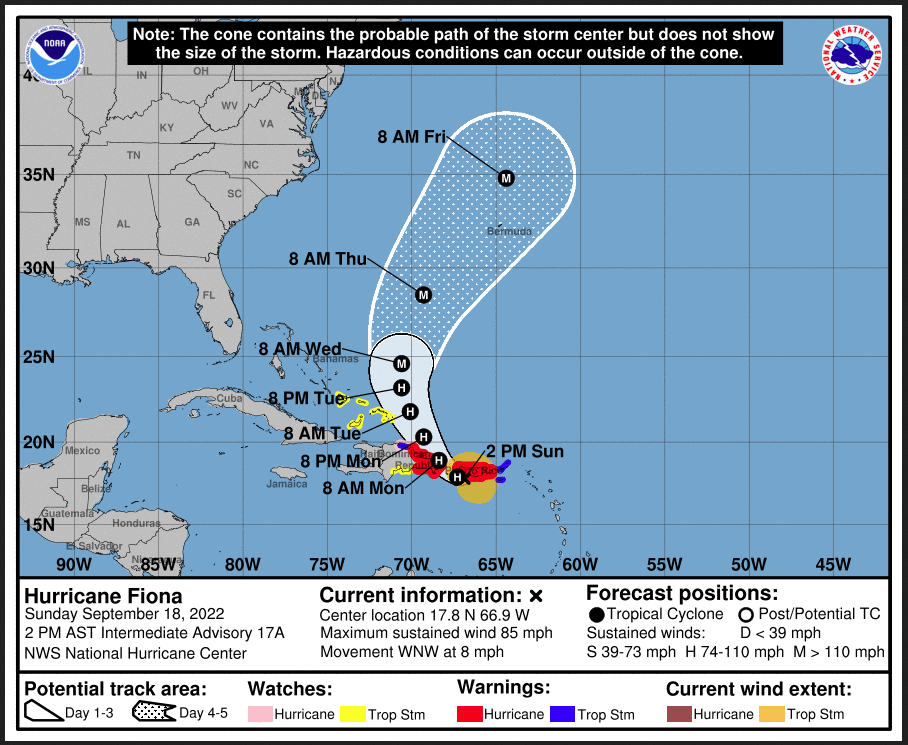
Updated at 6 pm EDT September 18, 2022 to provide updated information on Hurricane Fiona
Here is what we are paying attention to this evening and the next 48 hours from this afternoon’s NWS Forecast.
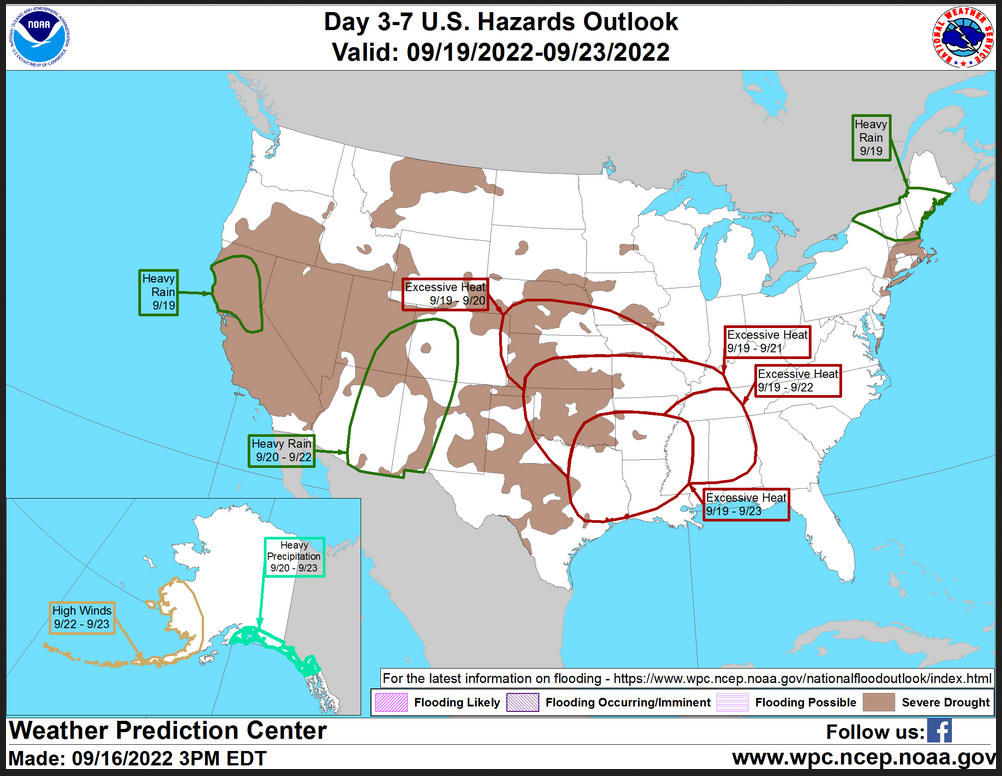
...Rain and below-normal temperatures are expected across portions of
California and the Pacific Northwest into next week...

...Well-above normal to record-breaking temperatures are forecast for
portions of the central to southern Plains into the Mississippi Valley
next week...

...Severe thunderstorms and heavy rain are expected for parts of the
Midwest today and tomorrow...
Continuation of the NWS Short Range Forecast (It is updated twice a day and these updates can be found here.
A slow-moving area of low pressure approaching the West Coast is expected
to bring rain and cooler temperatures to portions of Oregon and Northern
California beginning later today and continuing into next week.  While the
anticipated rains are expected to be beneficial for many areas, heavy
amounts may produce isolated occurrences of flash flooding, especially
across areas where wildfire burn scars may accelerate runoff.

As moisture returns to the region, afternoon and evening thunderstorms can
be expected across parts of eastern Arizona, western New Mexico, and
southwestern Colorado tomorrow and Monday.

While much of the West Coast remains seasonal to below-normal,
temperatures across much of the remainder of the U.S. are forecast to be
above-normal into early next week, especially across the Plains.  High
temperatures are forecast to soar to 15-20 degrees normal across parts of
the central Plains into the southern Plains tomorrow, before these heat
anomalies expand further into the mid Mississippi Valley by Monday.
Forecast highs are expected to at least approach record levels from
portions of Nebraska, Kansas, and Oklahoma to western Kentucky and
Tennessee on Monday.

North of the anomalous heat, a cold front is forecast to push east across
the Great Lakes while settling south from the northern Plains and Upper
Midwest.  This front is expected to be the focus for showers and storms,
with some storms forecast to become strong to severe.  Damaging wind and
hail, and even a few tornadoes are possible across portions of northern
Minnesota later on this afternoon into the evening.  Severe weather,
including heavy rain, is also possible farther to the south across a
portion of the mid Missouri Valley later this evening.

The focus for severe weather is expected to shift farther east on Monday,
with the greatest threat centered over over central Illinois and Indiana.
Once again, damaging wind and hail, as well as areas of heavy rainfall can
be expected.

Ahead of this system a slow-moving front centered across northern New York
and New England is expected to bring unsettled weather and cooler
temperatures, and the potential for locally heavy rainfall to parts of the
region beginning Sunday and continuing into Monday.

Across Florida and along the Gulf Coast, daily showers and thunderstorms
capable of producing locally heavy rainfall are forecast to continue into
next week.
Current forecast of track and other information
Maps that relate the forecast to geography can be found by clicking Here for Day 1 and Here for Day 2.
Here is a 60-hour animated forecast map that shows how the short-term forecast is expected to play out.
If it needs to be updated click here.
HAZARDS OUTLOOKS
Click he re for the latest complete Day 3 -7 Hazards forecast which updates only on weekdays. Once a week probably Monday or Tuesday I will update the images. I provided the link for readers to get daily updates on weekdays. Use your own judgment to decide if you need to update these images.
Worldwide Tropical Forecast
(This graphic updates on Tuesdays) If it has not been updated, you can get the update by clicking here This is a new approach and covers weeks 2 and 3 not weeks 1 and 2. It has more information but I am having trouble getting used to it. As usual, it comes with a discussion so I thought I would show that discussion tonight. I will not do that every night but if you click the link you will have that discussion.
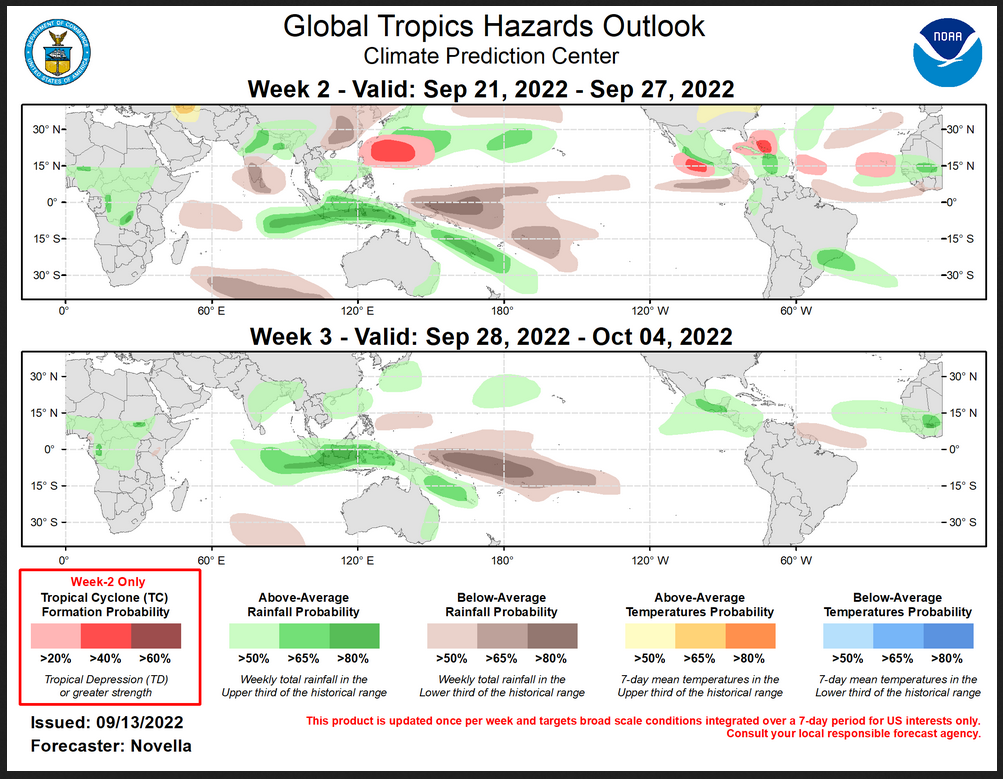
Outlook Discussion Last Updated – 09/13/22
Valid – 09/21/22 – 10/04/22
Both the RMM index and upper-level velocity potential anomaly based MJO index indicate a weakened and incoherent MJO during the past week. This weakening is likely attributed to destructive interference with the low frequency footprint over the equatorial Pacific, and there is some support for continued eastward propagation of the intraseasonal signal and possible reemergence in the guidance and tools. Dynamical model RMM forecasts seem to only paint part of the MJO picture moving forward, generally favoring some eastward propagation of the signal, but maintain a low amplitude with only few mean solutions exiting the RMM unit circle during the next few weeks. However, there are questions as to how well the RMM index is able to represent the MJO against the backdrop of such an unusually strong La Nina during the past few months. Hovmoller analyses of upper-level velocity potential and OLR anomaly forecasts focused north of the equator provide a bit more clarity in this regard, which depict the development of enhanced divergence aloft and convection with MJO activity coming through objective wavenumber-frequency filtering over the eastern Pacific and Americas during week-1, that continues to shift eastward into the tropical Atlantic and Africa with a more coherent wave-1 pattern emerging late in September. Should the MJO become better reorganized as it reenters the eastern Hemisphere, large scale conditions would be favorable for tropical cyclone (TC) development over the eastern Pacific and the Atlantic through the end of the month. Additional TC formation is also forecast to continue in the western Pacific tied to Rossby wave activity favored during the outlook period. During the past week, three TCs developed in the western Pacific basin. Typhoon Muifa formed near 17N/135E on 9/7 and briefly reached Super Typhoon Intensity this past weekend, before weakening to category 2 over the East China Sea. The Joint Typhoon Warning Center (JTWC) forecasts Muifa to track northwestward and make landfall as a category 1 system over the Zhejiang Province of eastern China where locally heavy rainfall amounts and high winds are favored during the next day or so. Towards the east, TC Merbok formed on 9/11 near 21N/160E and has remained at Tropical Storm intensity while drifting northward over the past few days. Although this system will remain over open waters, the JTWC forecasts Merbok to strengthen to category 2 system under a favorable SST and shear environment and accelerate poleward with an approaching mid-level trough to the west. As Merbok undergoes extratropical transition this week, dynamical models depict an amplification of the mid-level height pattern downstream over northern Pacific and western North America by next weekend, leading to increased chances for below (above) normal temperatures (precipitation) for many parts of Alaska and the western CONUS by next week. In the northern Philippine Sea, Tropical Depression 16W formed on 9/12 near 21N/138E. As this system is expected to meander under competing mid-level steering mechanisms in the near-term, a more northeasterly track towards the islands of southern Japan while strengthening to Typhoon intensity is forecast later this week.
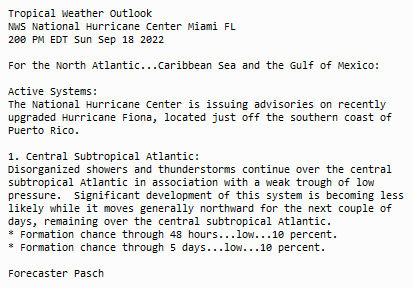
Across the Atlantic, the National Hurricane Center (NHC) is monitoring a pair of tropical waves in the Main Development Region (MDR) where the leading wave has a 40% chance of formation during the next 5 days. Probabilistic TC genesis tools reflect moderate chances of development during the week-1 period, however these signals also persist into the start of week-2 period. Although the GFS and GEFS are less robust with TC potential, there has been good continuity in the ECMWF ensemble favoring several deepening low centers once the disturbance approaches Hispaniola at the end of week-1, but diverge thereafter. Therefore, a broad slight chance (20%) area for TC formation is issued for week-2 to account for this spread in the guidance, with an embedded moderate chance (40%) area posted mainly east of the Bahamas should this disturbance not form during week-1. Another slight chance area is posted to the east of the Lesser Antilles, where there is also support in the probabilistic tools indicating modest chances for development tied to another easterly wave in the MDR. Across the eastern MDR, another easterly wave is forecast to move off of West Africa later in week-2. There are strengthening signals in the latest probabilistic guidance for TC formation near Cape Verde to support slight chances of TC development in the outlook.
In the eastern Pacific, the NHC is also monitoring a trough of low pressure with a high chance (80%) of formation during the next 5 days. Beyond this development potential during week-1, there is support from the model guidance and probabilistic tools for additional TC formation in the basin. Notably, lower-level zonal wind forecasts from the ECMWF, CFS, and GEFS favor a band of strengthening anomalous westerlies to the south of Mexico and into the Caribbean suggestive of an enhanced Central America Gyre (CAG) circulation conducive for TC development. Therefore, a broad slight chance and embedded moderate chance (40%) area are posted to the south of Mexico for week-2. For the western Pacific, there is good agreement in the GEFS and ECMWF ensembles favoring a broad area of deepening low pressure to the south of Japan in the wake of TCs Muifa and Tropical Depression 16W during week-2. With 40% chances depicted in the probabilistic tools, a corresponding moderate chance area for TC development is posted with a broader slight chance area in the outlook.
Probabilities for above- and below- normal precipitation and temperatures in the outlook are based on historical skill-weighted blend of GEFS, ECMWF, CFS and Canadian ensemble forecasts, La Nina precipitation composites, anticipated TC tracks, and some consideration from MJO composites. For hazardous weather concerns in your area during the next two weeks, please refer to your local NWS office, the Medium Range Hazards Forecast from the Weather Prediction Center (WPC) and the CPC Week-2 Hazards Outlook. Forecasts issued over Africa are made in coordination with the International Desk at CPC.
Detailed Maps and Reports for the Western Atlantic and the Pacific Oceans
Below are three maps that summarize the situation for the Atlantic, Eastern and Central Pacific. Additional information can be accessed by clicking HERE
First the Atlantic
Click to view the forecast map and have access to additional information https://www.nhc .noaa.gov/gtwo.php?basin= atlc&fdays=5
Then Eastern Pacific
Click to view the forecast map and have access to additional information https://www.nhc.noaa.gov/gtwo.php?basin=epac&fdays=5
Then Central Pacific
Click to view the forecast map and have access to additional information https://www.nhc.noaa.gov/gtwo.php?basin=cpac&fdays=5
And the Western Pacific
Click to view the forecast map and have access to additional information https://www.metoc.navy.mil/jtwc/jtwc.html
Some Intermediate-Term Outlooks
Links to “Outlook” maps and discussions for three time periods. Days 6 – 10, Days 8 – 14, and Weeks 3 and 4. An outlook differs from a forecast based on how NOAA uses these terms in that an “outlook” presents information from deviation from normal and the likelihood of these deviations.
You have to click on the links because they do not update automatically and I do not want to have stale images in the article. But it is not difficult to click on a link and you get a large image plus a discussion. On Fridays in a separate article, we will show the images and provide a link in this article that article. But remember what you will see is the images as of Friday. But here you can get the current images simply by clicking on them. Then hit the return arrow at the upper left of your screen to return to the article. You will not find this information easily anywhere else.

Right now you can find these maps here (We show them every Friday there but you can click above and find them).
World Forecast for Day 6 (Currently Set for Day 6 but the reader can change that)
World Weather Forecast produced by the Australian Bureau of Meteorology. Unfortunately, I do not know how to extract the control panel and embed it into my report so that you could use the tool within my report. But if you visit it Click Here and you will be able to use the tool to view temperature or many other things for THE WORLD. It can forecast out for a week. Pretty cool. Return to this report by using the “Back Arrow” usually found top left corner of your screen to the left of the URL Box. It may require hitting it a few times depending on how deep you are into the BOM tool. Below are the current worldwide precipitation and air pressure forecasts for six days out. They will not auto-update and right now are current for Day 6. If you want the forecast for a different day Click Here I will try to update this map each day but you have the link so you can access the dashboard and get a wide variety of forecasts.I mostly rely on the reader to interpret world maps. For this map, areas of expected precipitation for the date and time shown are clearly shown. The number of High-Pressure systems shown is called the Wave Number. Maybe I will discuss WN someday. But it shows how many Rossby Waves there are around the World. Sometimes they are hard to count. Counting Low-Pressure systems should provide the same WN. Rossby Waves are the way the temperature distribution of the Planet remains in balance. It is basically the science of fluid dynamics. It can be very helpful in predicting the movement of weather patterns. You can snip an area of interest and move it into MS Paint and enlarge it.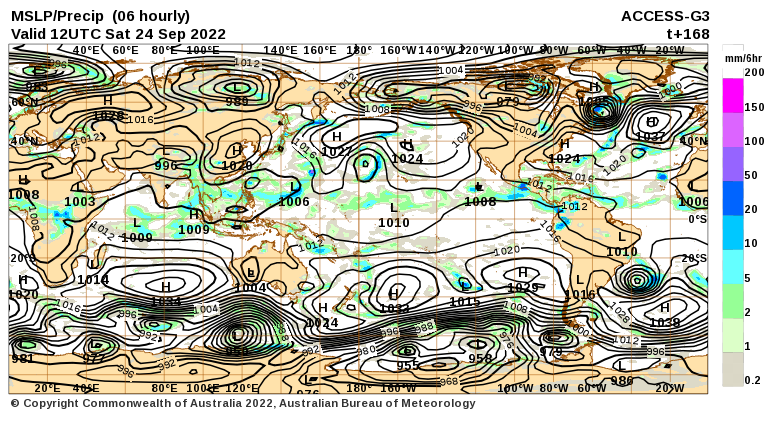 Month to Date Information
Month to date Temperature can be found at https://hprcc.unl.edu/products/maps/acis/MonthTDeptUS.png
Month to date Precipitation can be found at https://hprcc.unl.edu/products/maps/acis/MonthPNormUS.png
