Here comes El Nino – is that possible?
JAMSTEC is predicting a more rapid demise of La Nina and a rapid onset of El Nino conditions. Thus we should expect their forecast to differ dramatically from the NOAA forecast. Is it reasonable to predict a rapid change to El Nino? It is certainly possible. But it is not the majority opinion. Certainly, three La Ninas in a row build up the warm water in the IndoPacific Warm Pool. So I am presenting the JAMSTEC forecast as an alternative perspective.
I am going to first show the JAMSTEC forecasts by month and then by season. I will also show two of the indices they use in their model. One of those indices relates to the Indian Ocean Dipole which will also be discussed.

For Introductory purposes, I will again describe what JAMSTEC is.
JAMSTEC | Japan Agency for Marine-Earth Science and Technology

It is not a huge organization like NOAA but it does a lot of things much of which are related to ocean research. It is not the weather forecasting agency for JAPAN but issues this worldwide forecast as part of its research program. Some information on their model can be found by clicking Here
I am going to start with their forecast of SSTA (Sea Surface Temperature Anomalies)
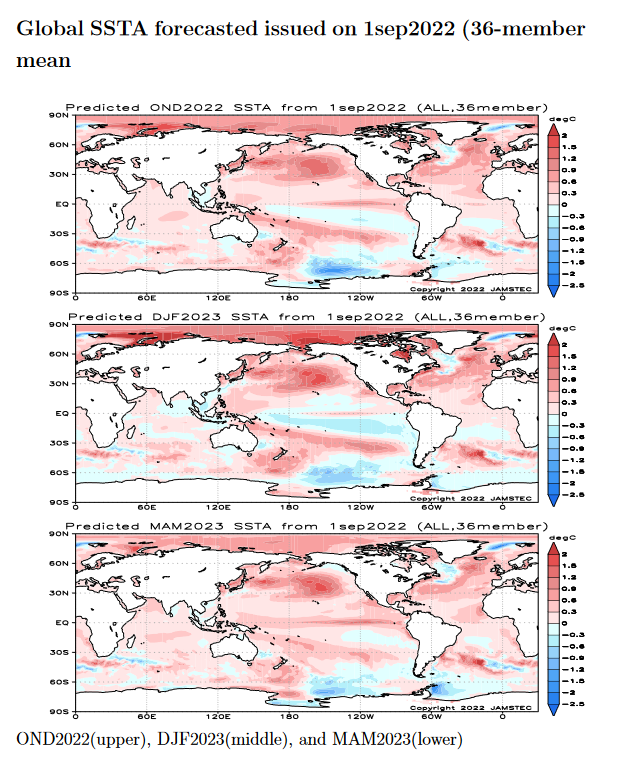
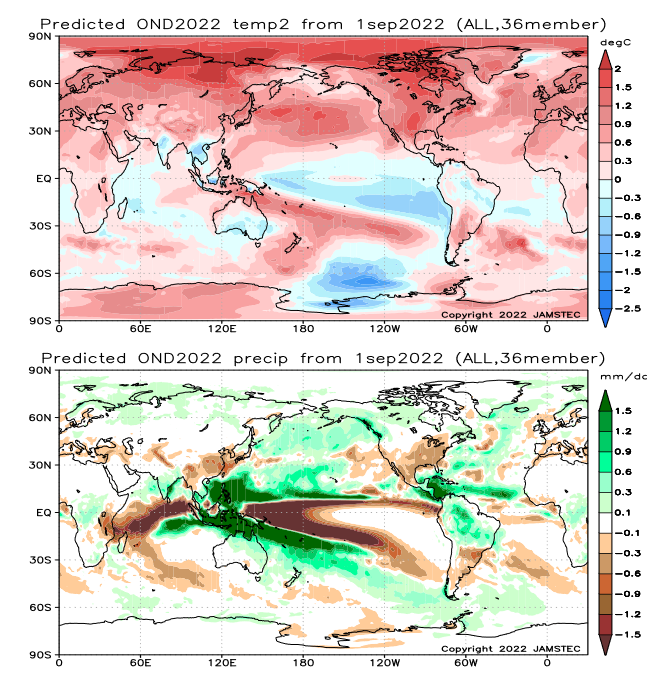
| The OND 2022 forecast does not look correct to me. It should be blue if we are in a La Nina. The DJF 2022-2023 looks ok and the MAM 2023 is consistent with El Nino.
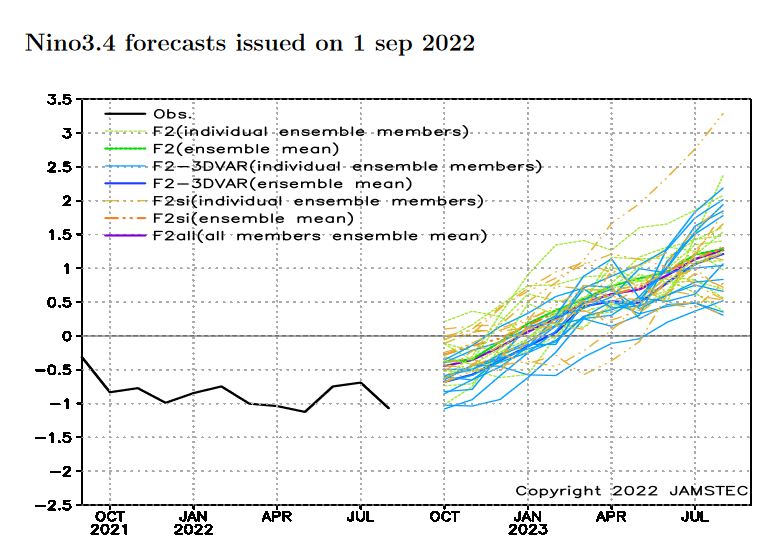
Let’s look at the JAMSTEC Nino 3.4 forecast. What is important is whether the index is above or below the neutral line. There are a number of forecasts shown. I am trying to focus on the thick purple “F2All” line. It seems to stop being a La Nina in the three-month period OND 2022 but is below the Neutral line so it should be blue not pink or red. So I have questions about the above graphic (the SSTA). Does it impact the forecast? I do not know. It could be an error by the graphical artist. We have a way to double-check. Look below at the OND World forecast. It forecasts both land and water and it shows as blue for the water. It shows that we are currently in La Nina. You can look at the October, November and December forecast maps also and they all suggest that the red in the OND SSTA map is a software problem or graphical artist error. |
I will now provide the three short-term monthly forecasts that they have provided me.
First October 2022
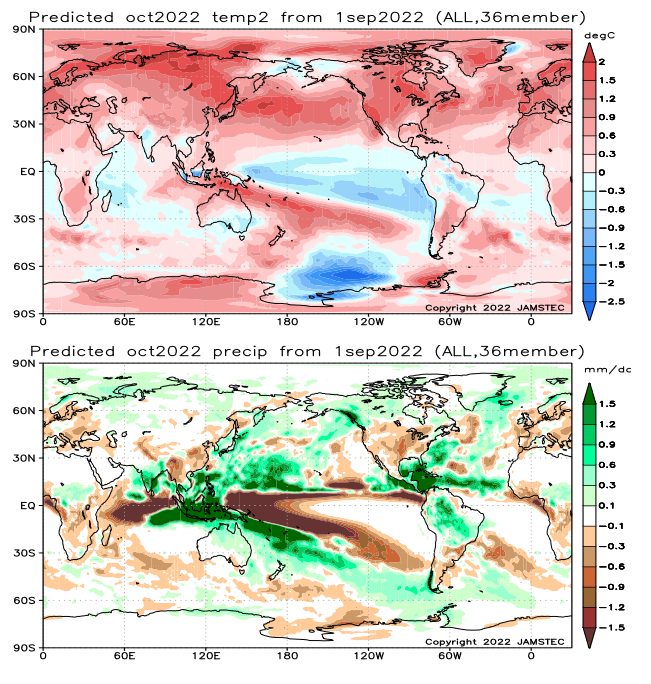
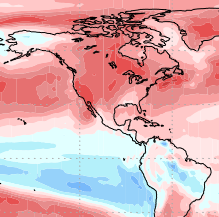
For any of these images, I can snip and enlarge a particular area of interest such as below for October 2022 temperature and precipitation.
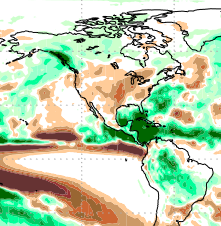
| But if I do that for every map I will end up with a very large number of graphics and If I then try to compare them with the NOAA graphics it gets very complicated. That is especially true now that JAMSTEC is not only providing me with three seasonal forecasts but also individual forecasts for each of the first three months which is more than I receive from NOAA. There is usually a lot of disagreement between NOAA and JAMSTEC some of which relates to their assumptions about ENSO but there are other reasons for the disagreement. I have decided not to do the comparative analysis. But anyone who wants to can do it themselves. You can snip and move what you have snipped into MSPAINT and enlarge it and the images issued by NOAA are in the article I published a few days ago and they can be accessed here https://econcurrents.com/2022/09/17/noaa-updates-its-four-season-outlook-on-september-15-2022-one-more-la-nina-winter/ |
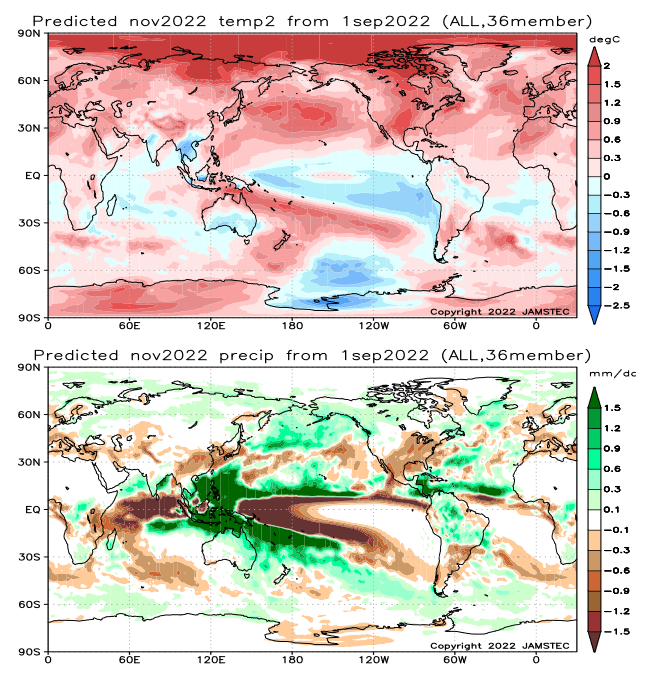
Then November, 2022
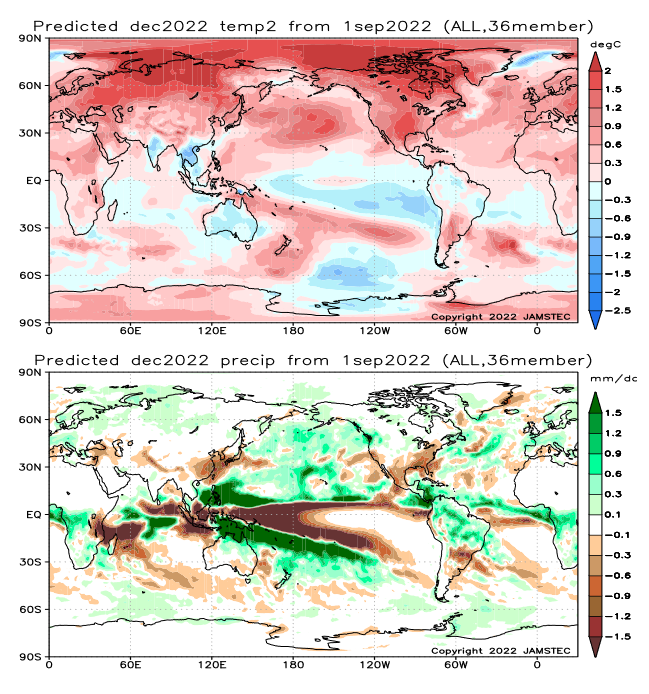
Then December, 2022
Then we shift to the three seasonal forecasts (these are three-month forecasts and this month they do not align perfectly with the meteorological definition of seasons which is a bit different than what most people are used to)
| Notice that DJF seems to overlap OND. That is because JAMSTEC works with Meteorological Seasons. So they provided OND graphics but then switched to DJF and MAM namely Winter and Spring. No problem there. The SSTA for MAM is consistent with El Nino and their NINO 3.4 forecast is also consistent with El Nino for that period. So that is ok but very different than the NOAA forecast. We need to keep all of that in mind. |
Each pair of graphics shows the predicted deviations from Normal but not the probabilities associated with the forecast.
First October/November/December 2022
And again I can extract the North America portion of the World Forecast
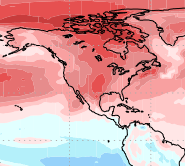
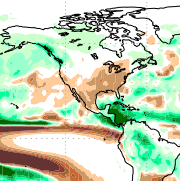
One can interpret this map themselves but this is what JAMSTEC says about it (I extracted the information from their discussion)
–
And December/January/February 2022/2023 (We already discussed the switch to a meteorological season namely Winter)
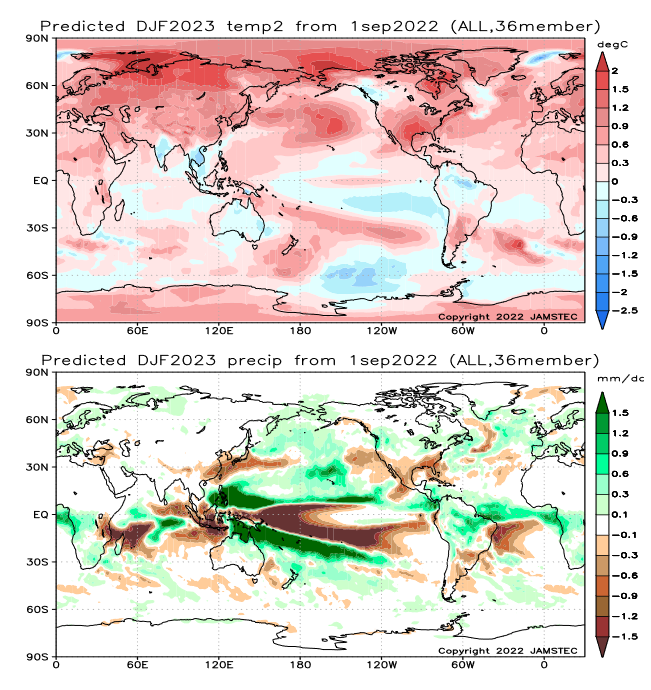
One can interpret this map themselves but this is what JAMSTEC says about it (I extracted the information from their discussion)
In boreal winter (austral summer), the model still predicts that most parts of the globe will experience a warmer-than-normal condition, except for western Canada, the northern part of the South American Continent, Australia, India, most parts of Indochina and Indonesia. In boreal winter (austral summer), a wetter-than-normal condition is predicted for Canada, the northern half of the South American Continent, northern Australia, southeastern Africa, Central Africa, some parts of Europe, and the Philippine. In contrast, most of the U.S.A., La Plata, East Africa, southern Indochina, Indonesia, some parts of Eurasia, and East Asia will experience a drier-than-normal condition.
s regards to the seasonally averaged climate, the model predicts that most of Japan will experience a warmer and drier-than-normal condition in winter.
–
And Finally March/April/May 2023
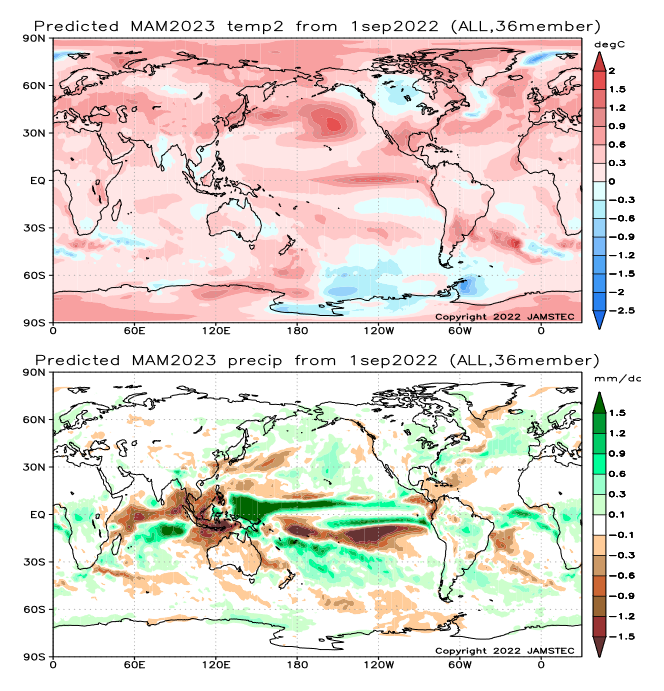
| JAMSTEC usually does not comment on their third Season Forecast. The reliability of longer-term forecasts are less. You can see that part of Southeast Asia and all of the Maritime Continent are dry. https://en.wikipedia.org/wiki/Maritime_Continent Australia is dry. Canada is cool. |
Now we look at the JAMSTEC analysis for the Indian Ocean Dipole.
JAMSTEC IOD Forecast
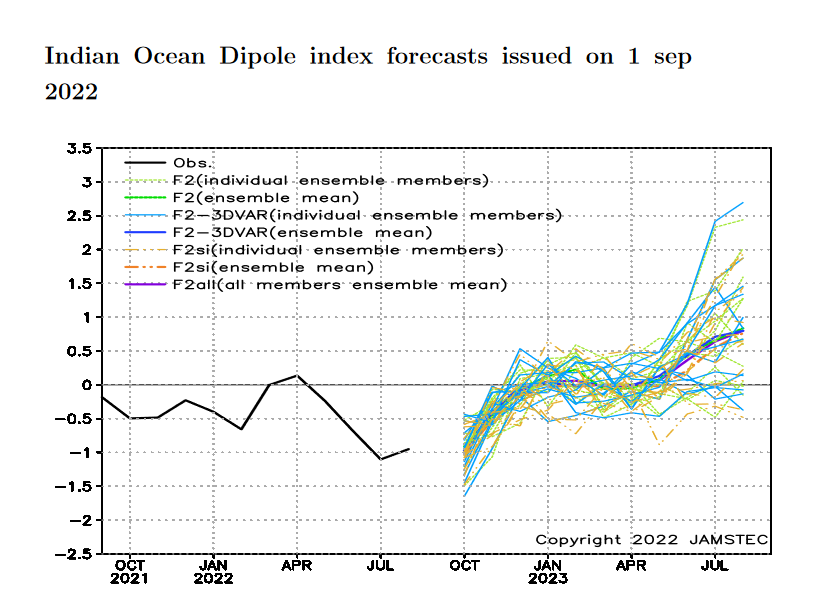
| .JAMSTEC is forecasting a brief IOD negative situation. You can see that on the graphic for October and maybe into November. This impacts nations that border the Indian Ocean. This article https://iaseasy.in/indian-ocean-dipole-positive-negative-and-neutral-iod/ provides some insight but was written when a positive IOD was expected and this is a negative IOD. It covers both positive and negative IOD’s. It did seem to have the expected impact on India and that needs to be explained. |
Where the IOD is measured and how the index is calculated
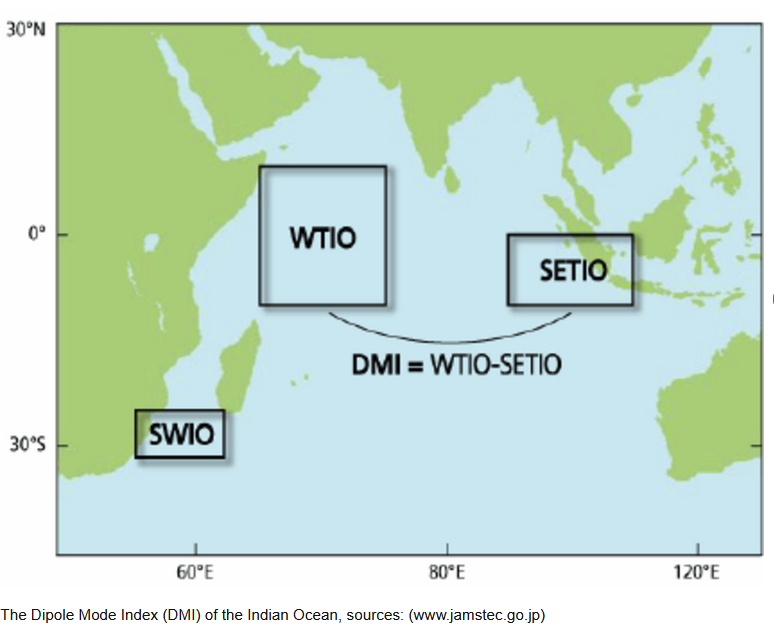
| The index is calculated as the monthly difference between the western (10°S-10°N, 50°-70°E) (WTIO) and eastern Indian Ocean (10°S-0°, 90°-108°E) (SETIO) sea surface temperature departures from average. |
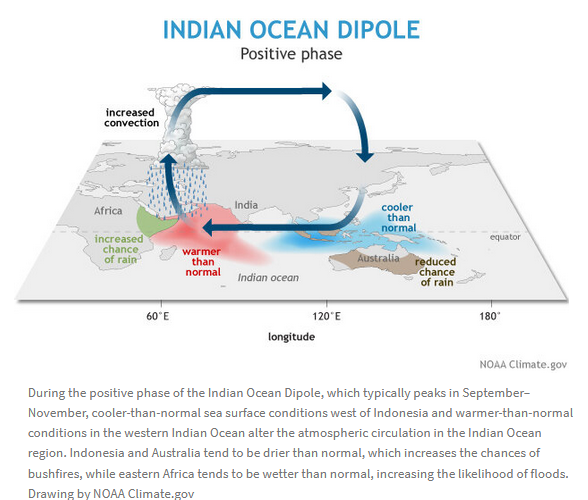
Impact of the IOD on the Walker Circulation
This shows the Walker Circulation for IOD Negative which is predicted.
| It is important to understand the Walker Circulation pattern of where moisture is rising (from warm water) and later falls as precipitation. |
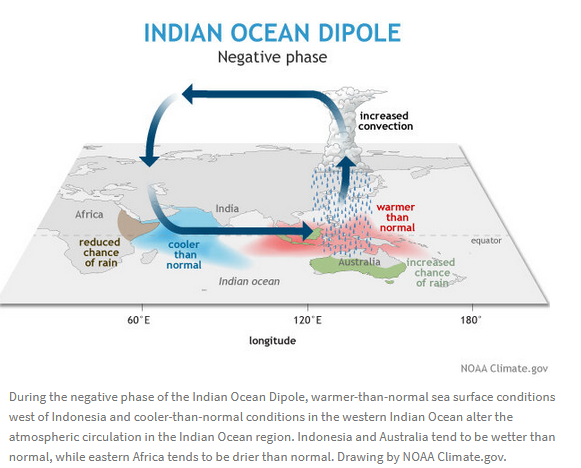
A negative IOD increases the chances of above-average winter and spring rainfall for much of Australia and a poor Monsoon for India. But I do not really seed a poor monsoon for India in the forecast maps.
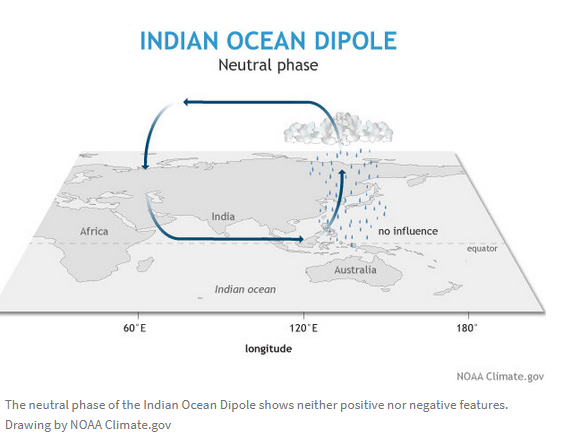
Here is IOD Neutral
Here is IOD Positive
JAMSTEC Discussion accompanying the forecast maps
Here is the short JAMSTEC discussion I received on September 13 but believe to be based on the JAMSTEC September 1, 2022 ENSO forecast. Some of this was also shown with the forecast maps. [I needed to reorganize the discussion a bit to have it correlate better with the images – I think the discussion now agrees with the maps- The reader should keep this in mind]
ENSO forecast:
Observation shows a recovery of the La Niña-like state. The SINTEX-F predicts that the La Niña-like state will decay in boreal autumn, and then the tropical Pacific will return to a neutral state in winter. The model predicts an occurrence of El Niño in the boreal spring of 2023.Indian Ocean forecast:The negative Indian Ocean Dipole continues. The SINTEX-F predicts that the negative Indian Ocean Dipole will persist in autumn, and then decay in winter.Regional forecast:
On a seasonal scale, the SINTEX-F predicts that most parts of the globe will experience a warmer-than-normal condition in October-December average, except for the northern part of the South American Continent, southern Australia, India, and some parts of Indochina and Indonesia.As regards to the seasonally averaged rainfall in October-December average, a drier-than-normal condition is predicted for most parts of the U. S. A., Mexico, La Plata, Sri Lanka, West and East Africa, some parts of Europe, most of China, some parts of Eurasia, and some parts of Indochina. In contrast, southern Alaska, most of Canada, Central America, the northern half of the South American Continent, eastern/northern Australia, India, Central Africa, Northern Europe, some parts of Eurasia, some parts of Indochina, the Philippine, and Indonesia will experience a wetter-than-normal condition. In particular, we notice that Indonesia and Australia (East Africa) may experience extremely wetter (drier) than normal conditions, owing to the negative Indian Ocean Dipole.In boreal winter (austral summer), the model still predicts that most parts of the globe will experience a warmer-than-normal condition, except for western Canada, the northern part of the South American Continent, Australia, India, most parts of Indochina and Indonesia. In boreal winter (austral summer), a wetter-than-normal condition is predicted for Canada, the northern half of the South American Continent, northern Australia, southeastern Africa, Central Africa, some parts of Europe, and the Philippine. In contrast, most of the U.S.A., La Plata, East Africa, southern Indochina, Indonesia, some parts of Eurasia, and East Asia will experience a drier-than-normal condition.As regards to the seasonally averaged climate, the model predicts that most of Japan will experience a warmer and drier-than-normal condition in boreal autumn and winter.
I hope everyone has found this article to be useful and interesting.