Here is what we are paying attention to this evening and the next 48 hours from this afternoon’s NWS Forecast.
...Heavy to excessive rainfall possible across parts of the Great Basin
and Northern Rockies through Wednesday, and into the far northern U.S. on
Thursday...

...Daily rounds of showers and storms likely across Florida...

...Much above normal temperatures for the central U.S., with much below in
parts of the West and the East...
Continuation of the NWS Short Range Forecast (It is updated twice a day and these updates can be found here.
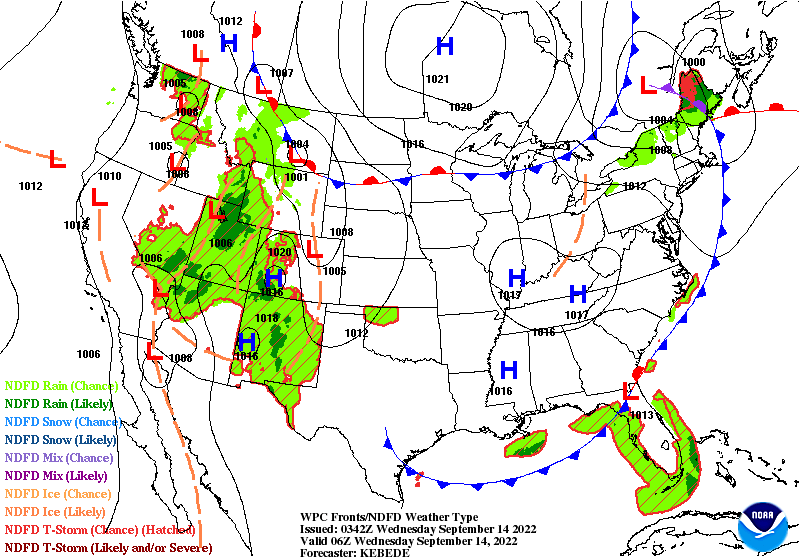
Moisture advection into the Southwest/Great Basin/Intermountain West will
interact with upper level short wave energy to produce widespread showers
and thunderstorms, heavy at times, across the region over the next couple
of days. The biggest concern remains into tonight across parts of southern
Nevada, northwest Arizona, and southwest Utah where WPC highlights a
moderate risk for excessive rainfall. The heavy/excessive rainfall threat
will lift slowly northward tomorrow into eastern Nevada, much of Utah, and
northwest Colorado. Showers and storms may also extend into parts of the
Four Corners region/New Mexico as well as up into the northern Rockies.
The upper level energy will continue into the northern Plains on Thursday
with heavy rainfall likely across northern parts of Minnesota in
conjunction with a warm front lifting into the region as well.

Elsewhere, a front moving through the Northeast this afternoon will
continue to produce showers and thunderstorms ahead of it into tonight,
mainly impacting far northern New England. A lingering stationary front
across Florida and the northern Gulf of Mexico will keep wet and unsettled
weather across the Sunshine state the next few days, with activity
possibly reaching parts of the central and western Gulf Coasts as well.
Out West, ongoing wildfires will continue to produce poor air quality
across the interior Northwest and northern Rockies, with widespread air
quality alerts currently in place. The greatest risk for new fires today
looks to be focused in eastern Wyoming where SPC highlights and elevated
fire weather risk and red flag warnings are in effect as well.

In terms of temperatures across the CONUS, much above average temperatures
will continue across the central Plains/Upper Midwest the next couple of
days, with daytime highs 10 to 20 degrees above normal underneath of
amplified upper level ridging. Upper level troughing over both the Eastern
and Western U.S. will keep temperatures near or below normal for these
regions.
Maps that relate the forecast to geography can be found by clicking Here for Day 1 and Here for Day 2.
Here is a 60-hour animated forecast map that shows how the short-term forecast is expected to play out.
If it needs to be updated click here.
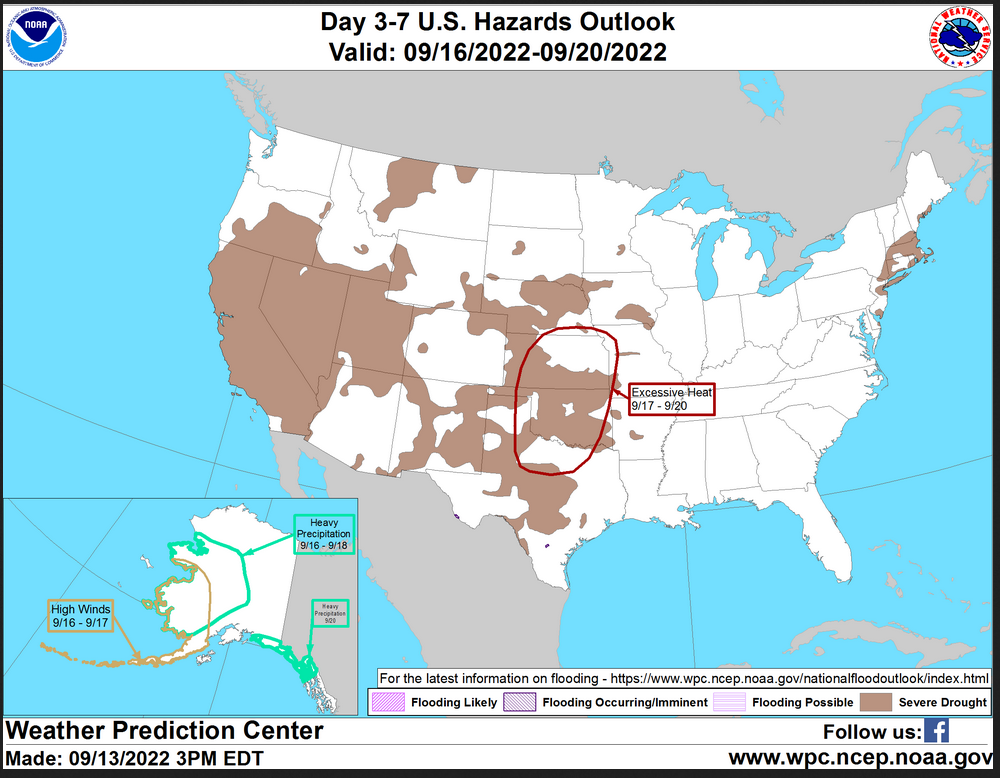
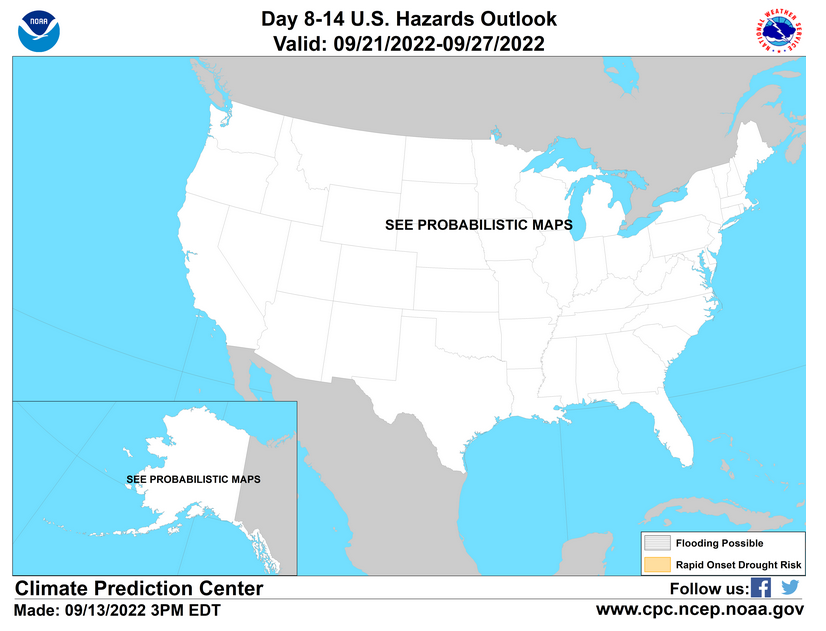
HAZARDS OUTLOOKS
Click here for the latest complete Day 3 -7 Hazards forecast which updates only on weekdays. Once a week probably Monday or Tuesday I will update the images. I provided the link for readers to get daily updates on weekdays. Use your own judgment to decide if you need to update these images.
Worldwide Tropical Forecast

(This graphic updates on Tuesdays) If it has not been updated, you can get the update by clicking here (It is a new approach and my initial reaction is unfavorable)
Detailed Maps and Reports for the Western Atlantic and the Pacific Oceans
Below are three maps that summarize the situation for the Atlantic, Eastern and Central Pacific. Additional information can be accessed by clicking HERE
First the Atlantic
Click to view the forecast map and have access to additional information https://www.nhc .noaa.gov/gtwo.php?basin=atlc&fdays=5
Then Eastern Pacific
Click to view the forecast map and have access to additional information https://www.nhc.noaa.gov/gtwo.php?basin=epac&fdays=5
Then Central Pacific
Click to view the forecast map and have access to additional information https://www.nhc.noaa.gov/gtwo.php?basin=cpac&fdays=5
And the Western Pacific
Click to view the forecast map and have access to additional information https://www.metoc.navy.mil/jtwc/jtwc.html
Some Intermediate-Term Outlooks
Links to “Outlook” maps and discussions for three time periods. Days 6 – 10, Days 8 – 14, and Weeks 3 and 4. An outlook differs from a forecast based on how NOAA uses these terms in that an “outlook” presents information from deviation from normal and the likelihood of these deviations.
You have to click on the links because they do not update automatically and I do not want to have stale images in the article. But it is not difficult to click on a link and you get a large image plus a discussion. On Fridays in a separate article, we will show the images and provide a link in this article that article. But remember what you will see is the images as of Friday. But here you can get the current images simply by clicking on them. Then hit the return arrow at the upper left of your screen to return to the article. You will not find this information easily anywhere else.

Right now you can find these maps here (We show them every Friday there but you can click above and find them).
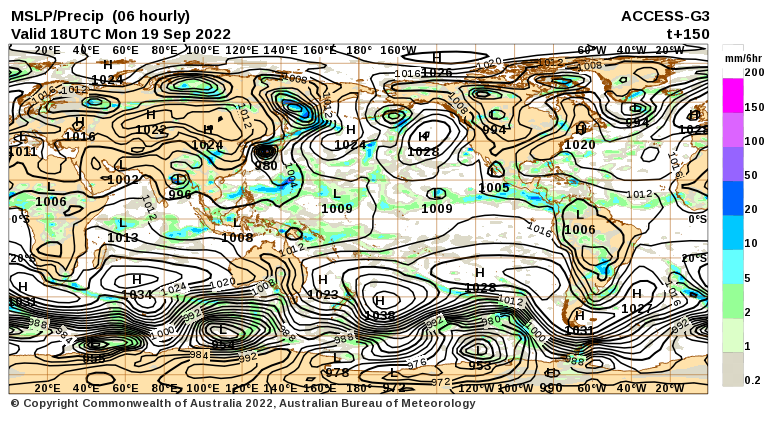
World Forecast for Day 6 (Currently Set for Day 6 but the reader can change that)
World Weather Forecast produced by the Australian Bureau of Meteorology. Unfortunately, I do not know how to extract the control panel and embed it into my report so that you could use the tool within my report. But if you visit it Click Here and you will be able to use the tool to view temperature or many other things for THE WORLD. It can forecast out for a week. Pretty cool. Return to this report by using the “Back Arrow” usually found top left corner of your screen to the left of the URL Box. It may require hitting it a few times depending on how deep you are into the BOM tool. Below are the current worldwide precipitation and air pressure forecasts for six days out. They will not auto-update and right now are current for Day 6. If you want the forecast for a different day Click Here I will try to update this map each day but you have the link so you can access the dashboard and get a wide variety of forecasts.I mostly rely on the reader to interpret world maps. For this map, areas of expected precipitation for the date and time shown are clearly shown. The number of High-Pressure systems shown is called the Wave Number. Maybe I will discuss WN someday. But it shows how many Rossby Waves there are around the World. Sometimes they are hard to count. Counting Low-Pressure systems should provide the same WN. Rossby Waves are the way the temperature distribution of the Planet remains in balance. It is basically the science of fluid dynamics. It can be very helpful in predicting the movement of weather patterns. You can snip an area of interest and move it into MS Paint and enlarge it.
Month to Date Information
Month to date Temperature can be found at https://hprcc.unl.edu/products/maps/acis/MonthTDeptUS.png
Month to date Precipitation can be found at https://hprcc.unl.edu/products/maps/acis/MonthPNormUS.png
