Here is what we are paying attention to this morning and the next 48 hours from this morning’s NWS Forecast.
...Hazardous weather associated with Hurricane Kay to begin entering
southern California and parts of the Desert Southwest on Friday...

...Dangerous heat continues throughout central and northern California
through the end of the week, with well above average temperatures building
into the Pacific Northwest by the weekend...

...Critical Fire Weather conditions forecast throughout portions of the
Intermountain West and Central Plains...

...Unsettled weather and flash flood chances forecast over parts of the
Southeast and eastern Gulf Coast...
Continuation of the NWS Short Range Forecast (It is updated twice a day and these updates can be found here.
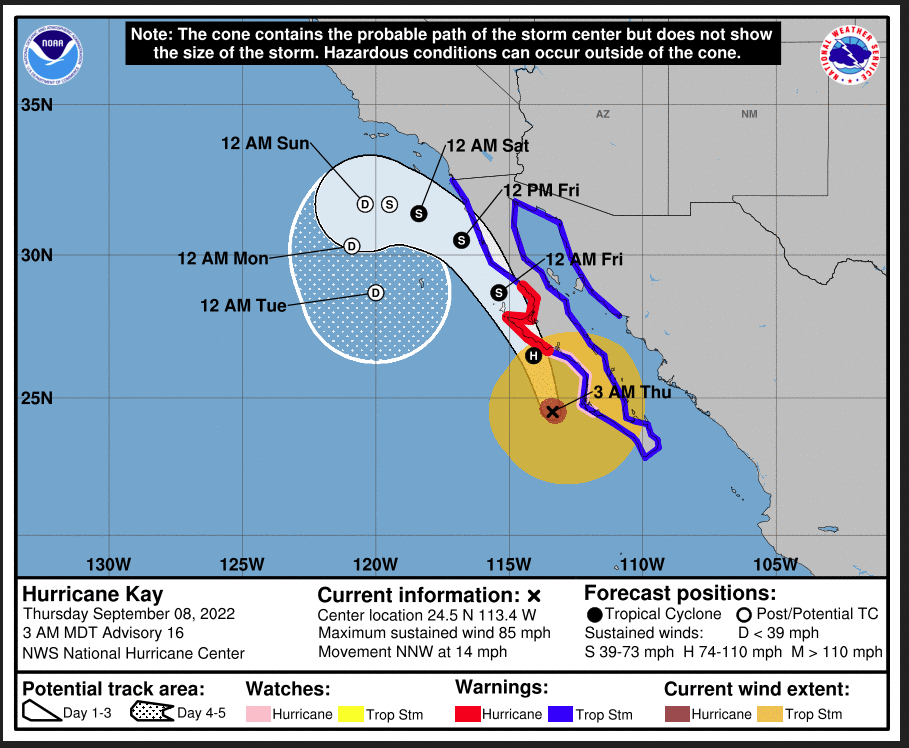
Hurricane Kay currently churns off the coast of Baja California and
continues to track north-northwest along the Pacific coastline, with
gradual weakening expected to occur as Kay treks northward over cooler
waters. However, impacts are still likely throughout parts of the Desert
Southwest and southern California as a surge of tropical moisture slides
northward. Rainfall amounts potentially adding up to around 6 inches
throughout the mountainous terrain of southern California will likely lead
to areas of flash and small stream flooding. Additionally, heavy rain is
possible over parts of southwest Arizona between Friday night and Saturday
morning. Moisture is expected to reach farther north along the southern
California coastline and reach the greater Los Angeles region by Friday
night as well. A Moderate Risk (level 3/4) of Excessive Rainfall is in
effect for Friday over portions of southern California and far southwest
Arizona, with a larger Slight Risk (level 2/4) encompassing more of
southern California, western Arizona, and far southern Nevada by Saturday.
In addition to the heavy rain threat, gusty winds are possible on Friday
across far southern California. In fact, before rain onset the high winds
could create increasing fire danger. Residents throughout these regions
are urged to plan for dangerous driving conditions and heed warnings
issued by local forecast offices.

Dangerous heat also continues to impact the Golden State as high
temperatures are once again forecast to reach well into the triple digits
both today and Friday, particularly over interior valley regions. The
upper-level ridge responsible for this week's heat wave is fortunately
dissipating and will allow for cooler weather to enter the region by this
weekend, but offshore flow will allow for scorching heat to stick around
for a few more days and eventually spread northward along western Oregon
and Washington. Excessive Heat Warnings remain in effect for much of
California and southern Nevada. For the Intermountain West, central
Rockies, and central Plains one additional day of well above average
temperatures are forecast until a powerful cold front ushers in cooler and
even below average temperatures. Highs today are forecast to reach into
the upper 90s throughout the central Great Basin/Rockies, with triple
digits possible throughout the central High Plains. The above average
temperatures combined with low relative humidity and gusty winds ahead of
the cold front will allow for conditions supportive of new wildfires to
form and existing fires to spread uncontrollably. SPC has issued a
Critical Fire Weather area for today over central Idaho, as well as
portions of central Nebraska and southeast South Dakota. Red Flag Warnings
have also been issued from Idaho to the central Plains, as well as
throughout the Pacific Northwest, where elevated fire weather conditions
exist on Friday.

For the Southeast and Gulf Coast States, a strengthening upper-level low
over the north-central Gulf of Mexico will help funnel deep tropical
moisture into the Southeast and eastern Gulf Coast over the next few days.
A stationary boundary extending along the Gulf Coast will provide a focus
for developing thunderstorms to tap into the increasing moisture content
and potentially lead to numerous downpours. As a result, flash flooding is
possible each day through the beginning of the weekend between the central
Gulf Coast and coastal South Carolina. A slightly higher risk for flash
flooding exists across the Southeast coast today, which is where a Slight
Risk of Excessive Rainfall has been issued. As moisture begins to stream
farther inland on Friday, heavy rainfall chances are likely to spread
north toward the southern Appalachians before reaching into western North
Carolina and Upstate South Carolina by Saturday. In total, widespread
rainfall amounts by this weekend may add up to 2 to 4 inches, with locally
higher totals possible where thunderstorms repeat over similar locations.

Elsewhere, an advancing cold front may lead to scattered thunderstorms
over the Upper Midwest and into northeast Wyoming today. The main threat
with these storms are likely to be associated with isolated damaging winds
gusts. The powerful cold front will bring well below average temperatures
to the northern and central Plains on Friday and Saturday, with highs only
reaching into the 50s and 60s. The cold airmass may also support light
snow across parts of the northern Rockies residing above 10000 feet.
Maps that relate the forecast to geography can be found by clicking Here for Day 1 and Here for Day 2.
Here is a 60-hour animated forecast map that shows how the short-term forecast is expected to play out.
If it needs to be updated click here.
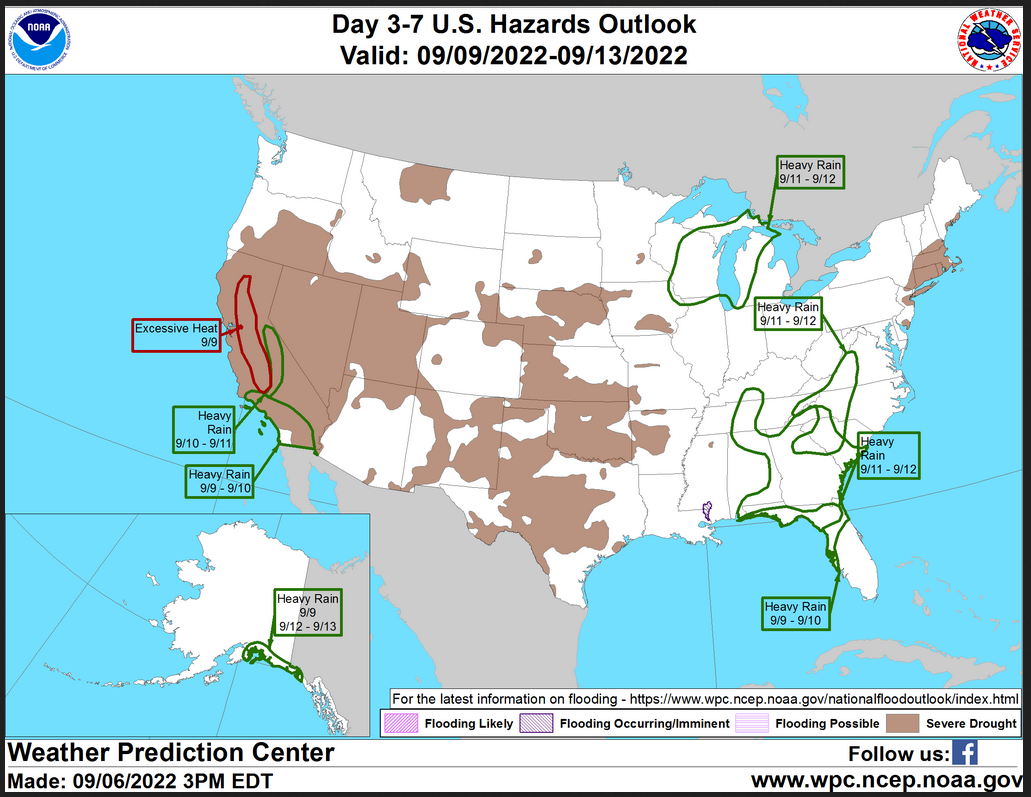
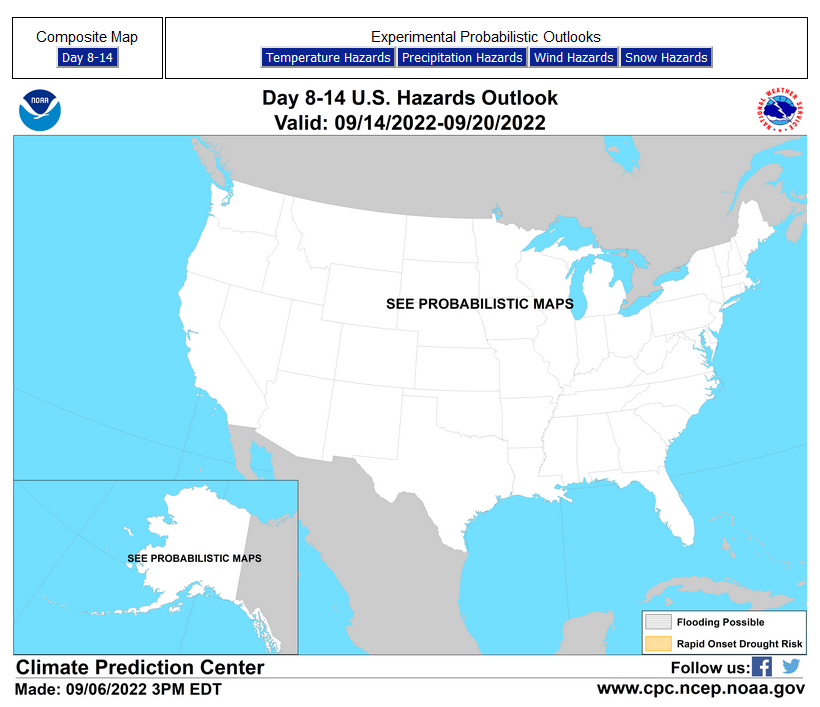
HAZARDS OUTLOOKS
Click he re for the latest complete Day 3 -7 Hazards forecast which updates only on weekdays. Once a week probably Monday or Tuesday I will update the images. I provided the link for readers to get daily updates on weekdays. Use your own judgment to decide if you need to update these images.
Worldwide Tropical Forecast
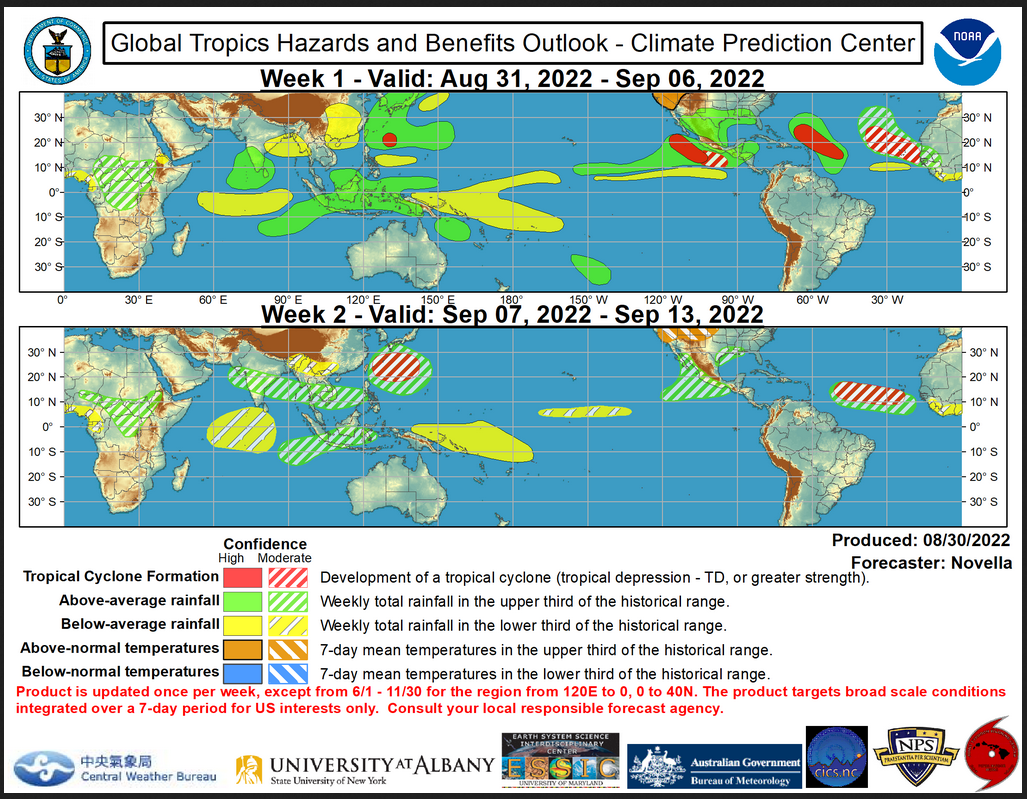
(This graphic updates on Tuesdays) If it has not been updated, you can get the update by clicking here
Detailed Maps and Reports for the Western Atlantic and the Pacific Oceans
Below are three maps that summarize the situation for the Atlantic, Eastern and Central Pacific. Additional information can be accessed by clicking HERE
First the Atlantic
Click to view the forecast map and have access to additional information https://www.nhc.noaa.gov/gtwo.php?basin=atlc&fdays=5
Then Eastern Pacific
Click to view the forecast map and have access to additional information https://www.nhc.noaa.gov/gtwo.php?basin=epac&fdays=5
Then Central Pacific
Click to view the forecast map and have access to additional information https://www.nhc.noaa.gov/gtwo.php?basin=cpac&fdays=5
And the Western Pacific
Click to view the forecast map and have access to additional information https://www.metoc.navy.mil/jtwc/jtwc.html
Some Intermediate-Term Outlooks
Links to “Outlook” maps and discussions for three time periods. Days 6 – 10, Days 8 – 14, and Weeks 3 and 4. An outlook differs from a forecast based on how NOAA uses these terms in that an “outlook” presents information from deviation from normal and the likelihood of these deviations.
You have to click on the links because they do not update automatically and I do not want to have stale images in the article. But it is not difficult to click on a link and you get a large image plus a discussion. On Fridays in a separate article, we will show the images and provide a link in this article that article. But remember what you will see is the images as of Friday. But here you can get the current images simply by clicking on them. Then hit the return arrow at the upper left of your screen to return to the article. You will not find this information easily anywhere else.

Right now you can find these maps here (We show them every Friday there but you can click above and find them).
World Forecast for Day 6 (Currently Set for Day 6 but the reader can change that)
World Weather Forecast produced by the Australian Bureau of Meteorology. Unfortunately, I do not know how to extract the control panel and embed it into my report so that you could use the tool within my report. But if you visit it Clic k Here and you will be able to use the tool to view temperature or many other things for THE WORLD. It can forecast out for a week. Pretty cool. Return to this report by using the “Back Arrow” usually found top left corner of your screen to the left of the URL Box. It may require hitting it a few times depending on how deep you are into the BOM tool. Below are the current worldwide precipitation and air pressure forecasts for six days out. They will not auto-update and right now are current for Day 6. If you want the forecast for a different day Click Here I will try to update this map each day but you have the link so you can access the dashboard and get a wide variety of forecasts.I mostly rely on the reader to interpret world maps. For this map, areas of expected precipitation for the date and time shown are clearly shown. The number of High-Pressure systems shown is called the Wave Number. Maybe I will discuss WN someday. But it shows how many Rossby Waves there are around the World. Sometimes they are hard to count. Counting Low-Pressure systems should provide the same WN. Rossby Waves are the way the temperature distribution of the Planet remains in balance. It is basically the science of fluid dynamics. It can be very helpful in predicting the movement of weather patterns. You can snip an area of interest and move it into MS Paint and enlarge it.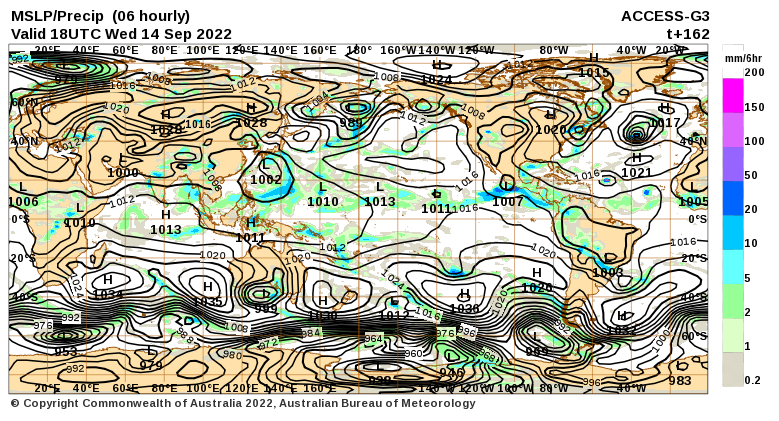 Month to Date Information
Month to date Temperature can be found at https://hprcc.unl.edu/products/maps/acis/MonthTDeptUS.png
Month to date Precipitation can be found at https://hprcc.unl.edu/products/maps/acis/MonthPNormUS.png