Here is what we are paying attention to tonight and the next 48 hours from this evening’s NWS Forecast.
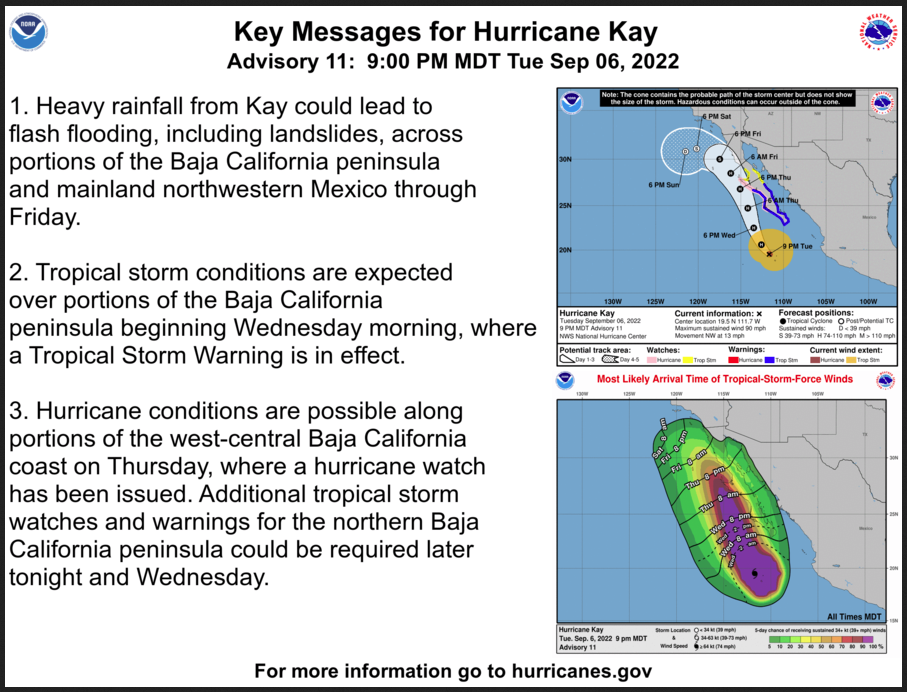
...Over 50 million residents are under either Excessive Heat Warnings or
Heat Advisories across the western third of the Lower 48...

...Critical fire weather over parts of the northern High Plains on
Wednesday...

...Unsettled weather and scattered flash flood chances linger over the
Mid-Atlantic and Southeast; Watching Hurricane Kay for potential impacts
in the Southwest late week...
Continuation of the NWS Short Range Forecast (It is updated twice a day and these updates can be found here.
An upper level ridge of high pressure over the western U.S. continues to
support an extensive heat dome up and down the West Coast. Following
another day of record heat on Tuesday from California to the central High
Plains, expect sizzling temperatures to stick around through mid-week.
Numerous daily record high temps are likely to be broken from the northern
Rockies and High Plains on south to southern California. The hottest
temperatures are anticipated to be in central and southern California
where daily max temps will soar as high as 110 degrees. Wednesday's
hottest temperatures compared to normal are expected to setup in the Snake
River Valley and Northern High Plains where high temperature departures
range between 20-30 degrees above normal. In addition to the stifling
daytime high temps, nighttime lows will not provide much relief as minimum
temperature departures also range between 15-30 degrees above normal. Some
relief from the searing heat finally arrives late Wednesday night into
Thursday as a cold front dives south from western Canada. 24-hour
temperature swings could be as dramatic as 20-30 degrees on Thursday in
contrast to Wednesday's oppressive heat in parts of northern Montana. The
frontal passage, however, will result in blustery winds across the
northern High Plains and northern Rockies. The combination of strong
winds, low humidity levels, and dry fuels supports the potential for
enhanced fire weather risks. In fact, the SPC has issued a Critical Risk
for fire weather in northern Montana on Wednesday with a large Elevated
Risk that spans from the Columbia River basin to eastern Montana.
Unfortunately for the West Coast, excessively hot conditions are likely to
persist into Thursday, but finally cool down to more seasonally warm
levels by the weekend.

In terms of precipitation, scattered thunderstorms continue to dot the
Southeast U.S. with lingering showers along the Mid-Atlantic coast this
afternoon. A pair of Slight Risks for Excessive Rainfall remain in place
for the Northeast coast and in the Upper Ohio Valley where there is a
heightened threat for flash flooding. There are still other areas of heavy
showers and thunderstorms as far south as the Lower Rio Grande Valley and
throughout the Lower Mississippi Valley. By Wednesday, thunderstorms will
continue to flare up from the Mid-Atlantic to the Gulf Coast due to a
frontal boundary slowly tracking across the Southeast and a pair of upper
level disturbances tracking through the Mid-Atlantic and Mid-South.
Locally heavy rainfall rates are possible within intense thunderstorms and
may result in flash flooding in these regions. As high pressure builds in
from the north, the front makes its way off the coast by Thursday leading
to drier conditions along the Mid-Atlantic coast. However, a wave of low
pressure in the Gulf of Mexico will track along the aforementioned frontal
boundary and keep unsettled weather in the forecast across the Southeast.
Elsewhere, a cold front racing across the North Central U.S. is set to
produce strong-to-severe storms across the Upper Mississippi Valley. SPC
has issued a Marginal Risk for severe weather for portions of the
Minnesota Arrowhead, northern Wisconsin, and Michigan's Upper Peninsula.
Lastly, there is the potential for Hurricane Kay to bring heavy rain and
high wind impacts to parts of southern California and the Desert
Southwest. Please visit the National Hurricane Center's website for the
latest track forecast and information.
Maps that relate the forecast to geography can be found by clicking Here for Day 1 and Here for Day 2.
Here is a 60-hour animated forecast map that shows how the short-term forecast is expected to play out.
If it needs to be updated click here.
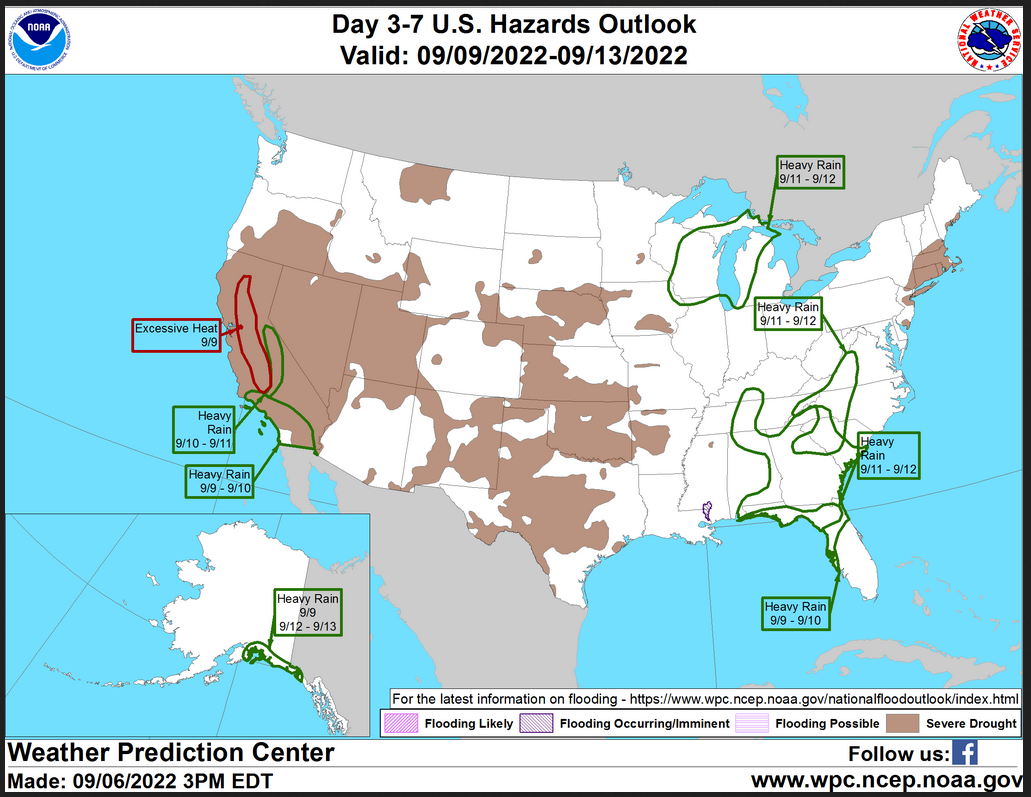
HAZARDS OUTLOOKS
Click he re for the latest complete Day 3 -7 Hazards forecast which updates only on weekdays. Once a week probably Monday or Tuesday I will update the images. I provided the link for readers to get daily updates on weekdays. Use your own judgment to decide if you need to update these images.
Worldwide Tropical Forecast
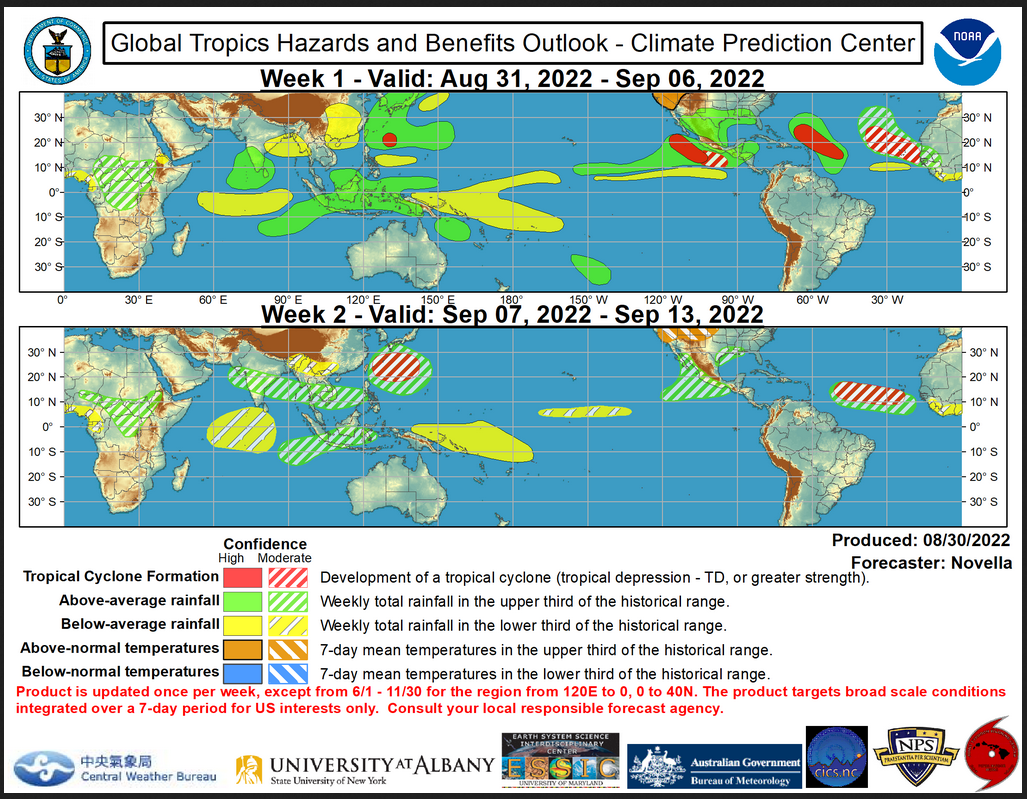
(This graphic updates on Tuesdays) If it has not been updated, you can get the update by clicking here
Detailed Maps and Reports for the Western Atlantic and the Pacific Oceans
Below are three maps that summarize the situation for the Atlantic, Eastern and Central Pacific. Additional information can be accessed by clicking HERE
First the Atlantic
Click to view the forecast map and have access to additional information https://www.nhc.noaa.gov/gtwo.php?basin=atlc&fdays=5
Then Eastern Pacific
Click to view the forecast map and have access to additional information https://www.nhc.noaa.gov/gtwo.php?basin=epac&fdays=5
Then Central Pacific
Click to view the forecast map and have access to additional information https://www.nhc.noaa.gov/gtwo.php?basin=cpac&fdays=5
And the Western Pacific
Click to view the forecast map and have access to additional information https://www.metoc.navy.mil/jtwc/jtwc.html
Some Intermediate-Term Outlooks
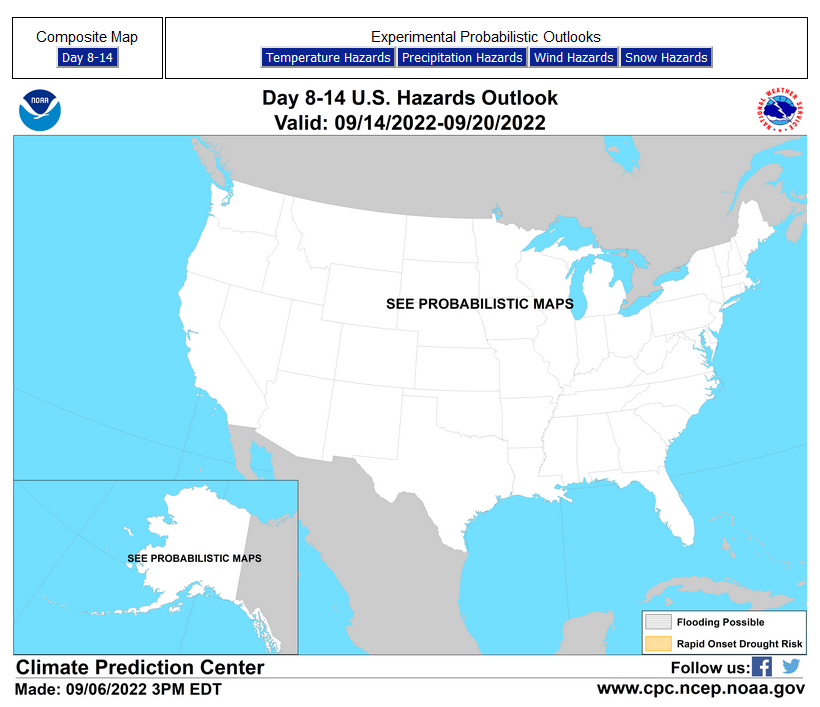
Links to “Outlook” maps and discussions for three time periods. Days 6 – 10, Days 8 – 14, and Weeks 3 and 4. An outlook differs from a forecast based on how NOAA uses these terms in that an “outlook” presents information from deviation from normal and the likelihood of these deviations.
You have to click on the links because they do not update automatically and I do not want to have stale images in the article. But it is not difficult to click on a link and you get a large image plus a discussion. On Fridays in a separate article, we will show the images and provide a link in this article that article. But remember what you will see is the images as of Friday. But here you can get the current images simply by clicking on them. Then hit the return arrow at the upper left of your screen to return to the article. You will not find this information easily anywhere else.

Right now you can find these maps here (We show them every Friday there but you can click above and find them).
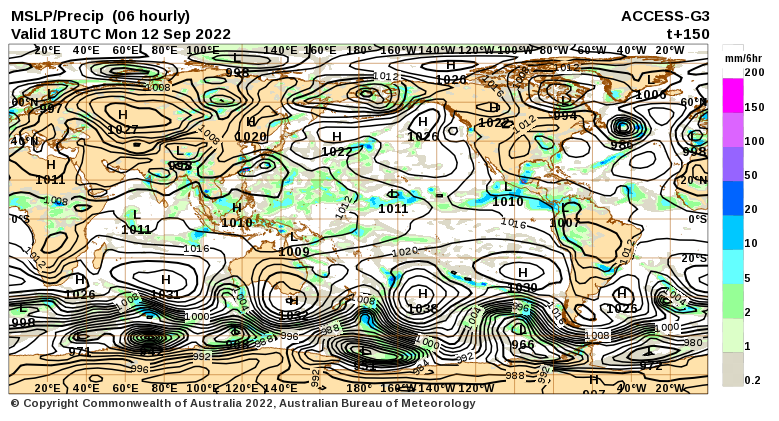
World Forecast for Day 6 (Currently Set for Day 6 but the reader can change that)
World Weather Forecast produced by the Australian Bureau of Meteorology. Unfortunately, I do not know how to extract the control panel and embed it into my report so that you could use the tool within my report. But if you visit it Click Here and you will be able to use the tool to view temperature or many other things for THE WORLD. It can forecast out for a week. Pretty cool. Return to this report by using the “Back Arrow” usually found top left corner of your screen to the left of the URL Box. It may require hitting it a few times depending on how deep you are into the BOM tool. Below are the current worldwide precipitation and air pressure forecasts for six days out. They will not auto-update and right now are current for Day 6. If you want the forecast for a different day Click Here I will try to update this map each day but you have the link so you can access the dashboard and get a wide variety of forecasts.I mostly rely on the reader to interpret world maps. For this map, areas of expected precipitation for the date and time shown are clearly shown. The number of High-Pressure systems shown is called the Wave Number. Maybe I will discuss WN someday. But it shows how many Rossby Waves there are around the World. Sometimes they are hard to count. Counting Low-Pressure systems should provide the same WN. Rossby Waves are the way the temperature distribution of the Planet remains in balance. It is basically the science of fluid dynamics. It can be very helpful in predicting the movement of weather patterns. You can snip an area of interest and move it into MS Paint and enlarge it.
Month to Date Information
Month to date Temperature can be found at https://hprcc.unl.edu/products/maps/acis/MonthTDeptUS.png
Month to date Precipitation can be found at https://hprcc.unl.edu/products/maps/acis/MonthPNormUS.png
