Updated at 7 pm Saturday, September 3, 2022 to include a comparison with the Monthly Outlook Issued on August 31, 2022
Southern Tier to be wet; the Northwest starts warm but the warm anomaly rapidly moves to the East with the Northwest experiencing some cold air intrusion.
NOAA updates many of its weather outlooks daily or even more frequently and in many cases issues a discussion with those outlooks. We provide a daily report which focuses on the shorter-term predictions but has links to all the partial-month outlooks. One of the reports issued by NOAA only gets updated on Fridays and since this covers weeks 3 and 4 it is very important. The discussion that gets issued with this week 3-4 NOAA report is often where possible changes to the weather pattern are first identified.
So we have decided to issue a special report on Fridays in which for a subset of the information we show the actual forecast maps not just provide the links. This makes it easier for the reader. We will also include at the end of the article the other information from the daily article
When the Week 3-4 Outlook is issued on Friday, we have a 28-day view of the future. It is important to recognize that the forecasts do not always work out as predicted. But in the article, there are links to obtain updated forecasts. This is important because it appears that changes are happening and the current view of the next 28 days differs substantially from the Monthly Outlook issued just a few days ago.

| Announcement: We now publish a daily weather report that addresses both short-term and intermediate-term weather issues including tropical events and you can find it at econcurrents.com. We actually include the daily weather report in this article and will do so every time we publish this article. But on other days you can find the daily weather report which we refer to as a 48-hour plus forecast simply by going to econcurrents.com. You will be able to find it.
When you click on a link, to return to this article just hit the return arrow at the upper left corner of your screen. This message is mainly for future reference as this article covers most of what you need to know. The links to information on tropical events are in the Daily Report and also in this article but the maps are not shown so you have to click on the links. We update this article every week but some may refer to it more than a week after it is published and tropical events can develop rapidly so if you are interested in tropical events simply click on the map that applies to the area of the ocean where you have an interest. |
What NOAA is predicting for the next 28 days.

We will start with the short-term – It is up to date as of today. If you look at this article after today you can click the links to update (plus you will end up with a lot of additional information)
| Temperature (Maximum Anomaly) for the next five days | Precipitation (Five days of cumulative precipitation) |
| https://www.wpc.ncep.noaa.gov/medr/me dr_mean.shtml | https://www.wpc.ncep.noaa.gov/qpf/day1-7.shtml |
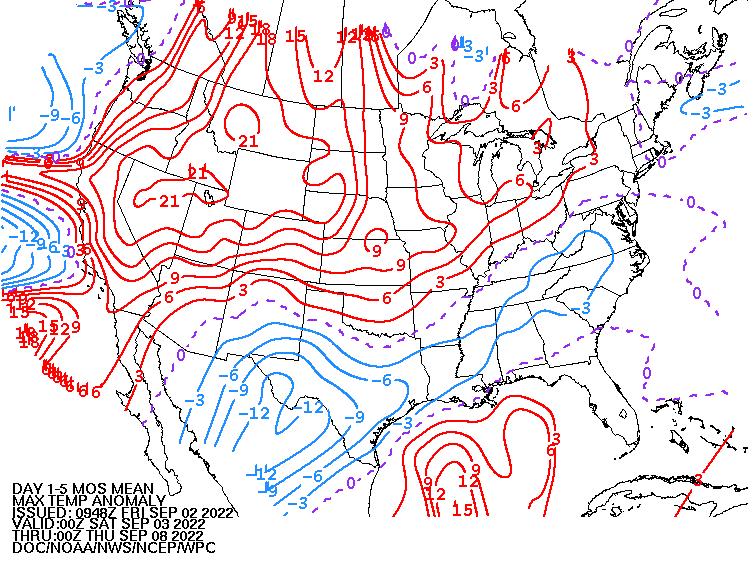
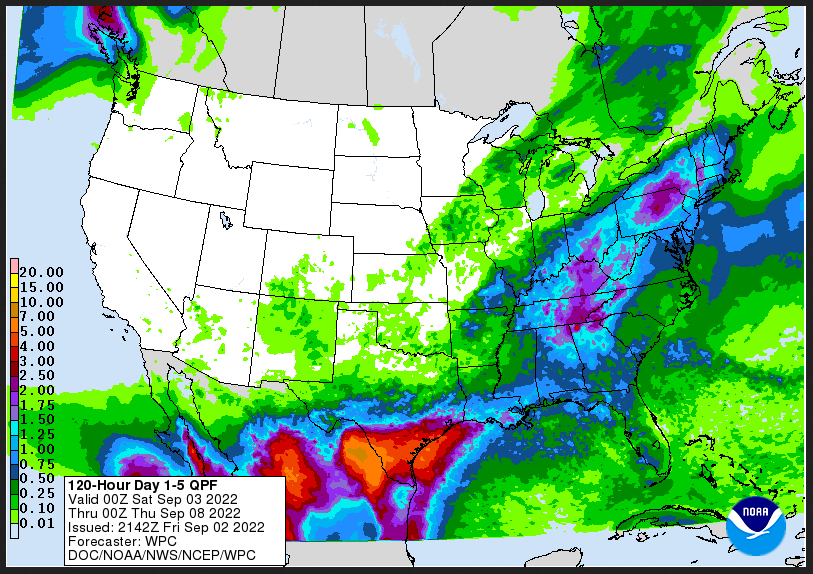
| Most of the warm temperature anomalies are in the Northwest. The precipitation is mostly in the Eastern half of CONUS. The Monsoon seems to have withdrawn into Mexico but that is probably temporary. |
Now we look at “Outlook” maps for three time periods. Days 6 – 10, Days 8 – 14, and Weeks 3 and 4. An outlook differs from a forecast based on how NOAA uses these terms in that an “outlook” presents information as deviation from normal and the likelihood of these deviations.
I have provided the maps so you do not need to click to get them. But they do not update daily. But you can get the current images simply by clicking on the links provided. Then hit the return arrow at the upper left of your screen to return to the article. There is no need to do that right away since what is published today is up to date. The Week 3 – 4 Outlook only updates on Fridays.
Below are the links to obtain updates and additional information.
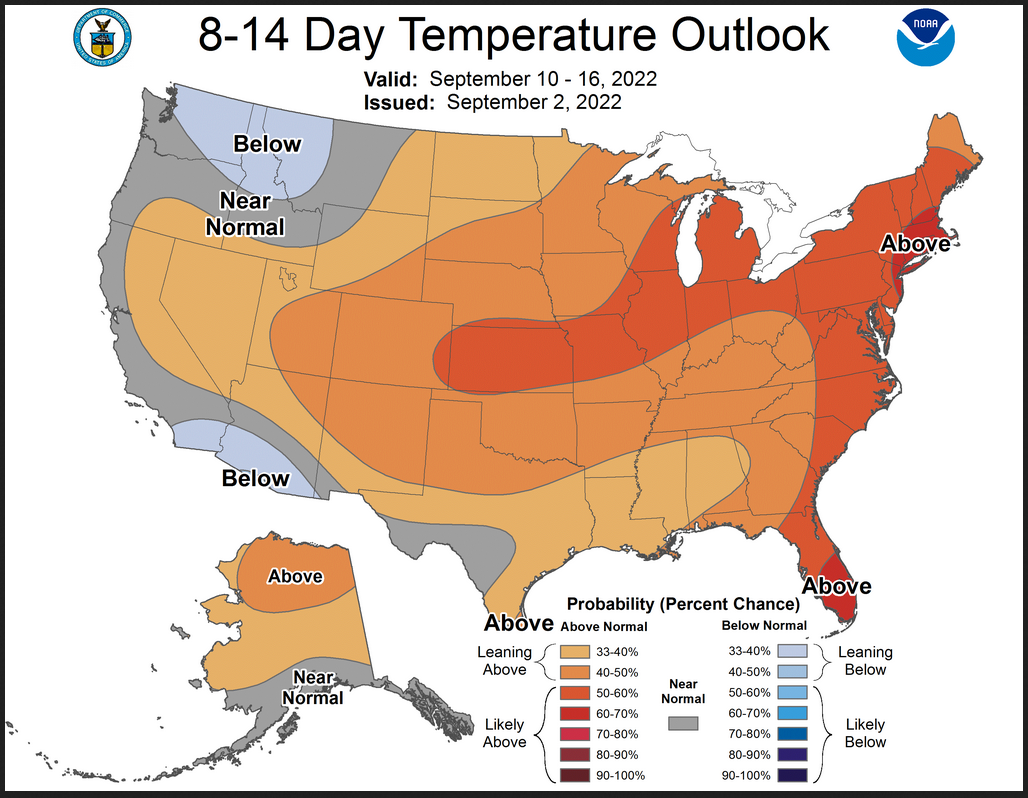
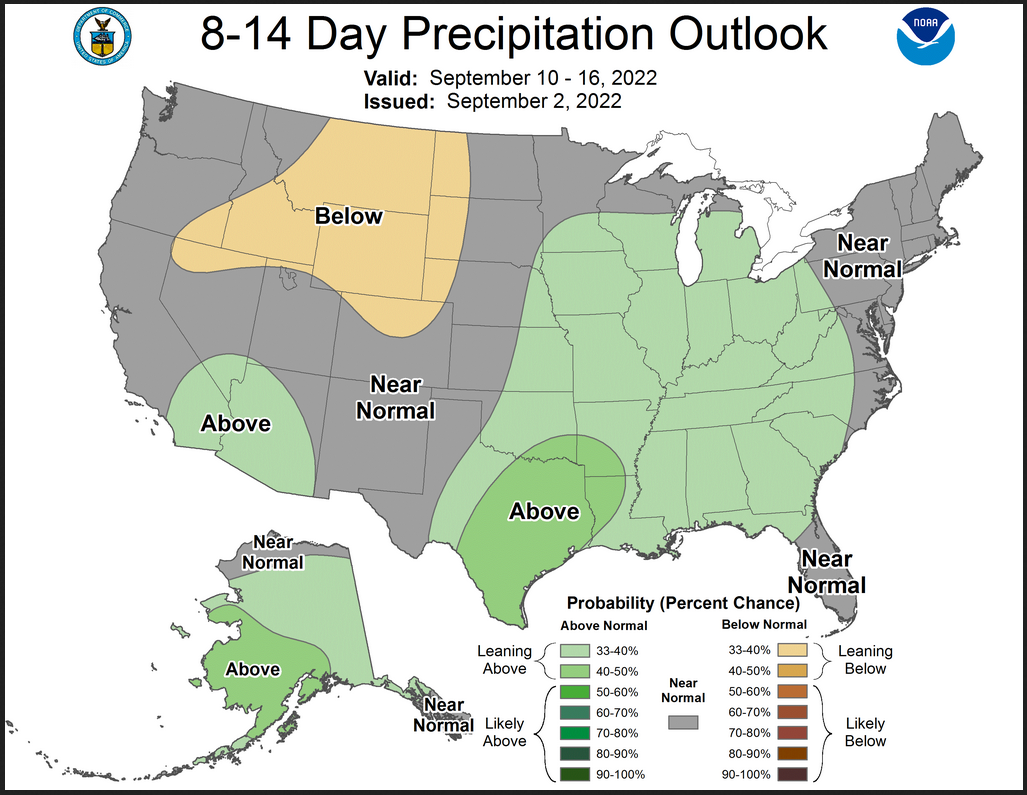
| The warm area has changed location a bit. It is more in the Northeast than Northwest but that can change. The precipitation is still along the Southern Tier but focused more to the east. |
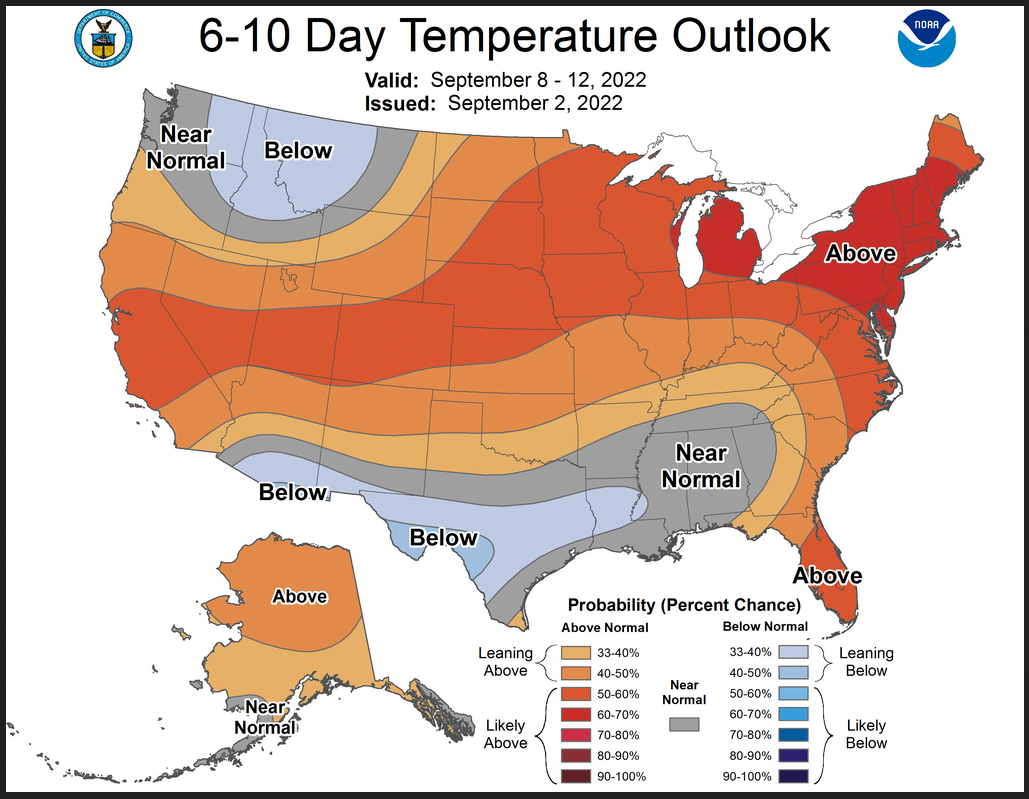
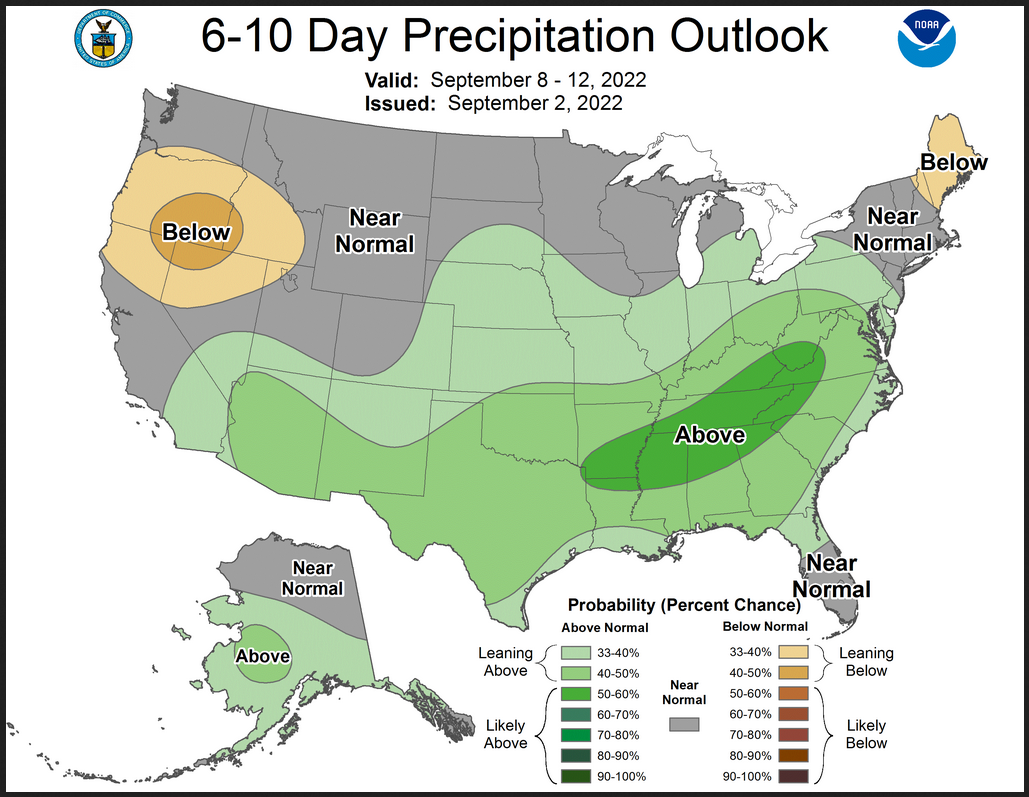
| North-South divide re temperature and precipitation anomalies has been replaced with a West-East divide. |
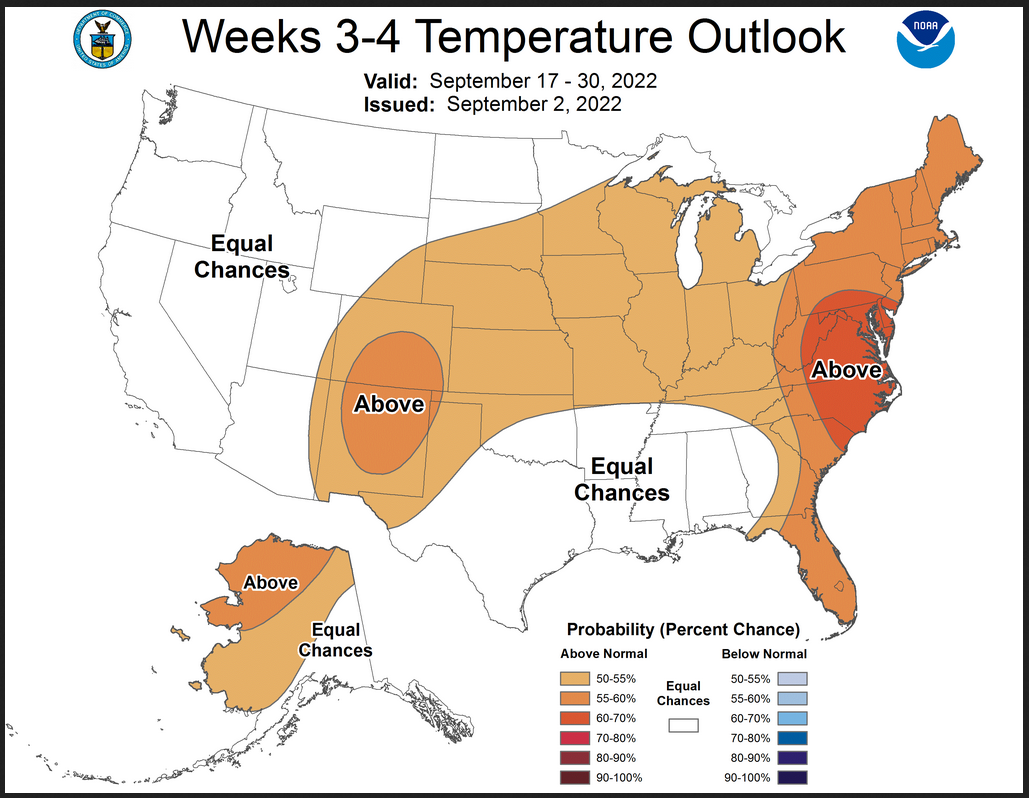
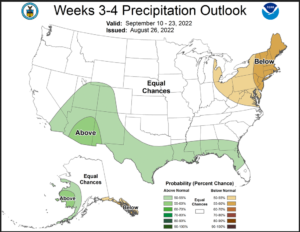
Now we address Weeks 3 and 4. This is a time frame that is very important. It is half of the 28-Day forecast period. That is why we include the discussion that accompanies the maps.

–
Last week Outlook This week Outlook
–
Of course we are talking about forecasts made at different times covering two different but overlaping two-week periods but the Monsoon seems to have gone away as far as Arizona and New Mexico are concerned. It did not look right in the monthly forecast on last week’s week 3 – 4 forecast and this may not be correct either but I suspect that it is. But there is still a large wet anomaly. –Prognostic Discussion for Week 3-4 Temperature and Experimental Precipitation Outlooks
NWS Climate Prediction Center College Park MD
300PM EDT Fri Sep 02 2022
Week 3-4 Forecast Discussion Valid Sat Sep 17 2022-Fri Sep 30 2022
La Niña conditions continue to prevail across the tropical Pacific with below average sea surface temperatures (SST). The intraseasonal signal associated with the Madden Julian Oscillation (MJO) has weakened over the past week. At this time, dynamical model forecasts of the RMM indices do not indicate an enhancement of MJO-related convection before the start of the current outlook period. While the tropical forcings and their potential impacts on extratropical sensible weather remain weak at this time, we are approaching the season in which any emerging signals may have more influence on subseasonal forecasts over CONUS and Alaska. Extratropical signals such as the North Atlantic Oscillation are currently negative but are anticipated to weaken toward a neutral phase by the end of Week-2. For this Week 3-4 Outlook, the temperature and precipitation outlooks are based primarily on dynamical model guidance as well as considerations for decadal trends and the evolution of the Week-2 patterns.
Good agreement exists among dynamical models with regard to the large-scale structure of the anomalous 500-hPa height fields. The models consistently depict a wavetrain-like signal of positive height anomalies over the North Pacific and Great Lakes regions with negative height anomalies over the Pacific Northwest. The model solutions differ primarily with respect to the circulation across Alaska, where the ECMWF solution favors troughing while the GEFS solution indicates weakly positive heights. Troughing in the Pacific Northwest is primarily a Week-3 signal and positive height anomalies are forecast for that region in Week-4. Therefore, the uncertainty in the timing of that pattern change will have implications for the temperature forecast for the west coast.
With the anticipated anomalous ridging, the temperature outlook for the Week 3-4 period tilts toward above normal probabilities across the Central Plains, Midwest and East Coast of the CONUS with highest probabilities for the mid-Atlantic region. Equal Chances (EC) of above or below normal temperatures are predicted for the Gulf region due to inconsistent guidance from the dynamical models. EC is also indicated for much of the western portions of the CONUS. Model guidance mostly agreed on a cold signal for the Pacific Northwest through California; however, that signal is associated with the overlying troughing that is confined to Week-3 and temperatures tilt above normal for Week-4. The uncertainty in the transition of that signal results in the EC forecast. For Alaska, enhanced probabilities for above normal temperatures are indicated for the North Slope due to strong model agreement.
The precipitation outlook for the Week 3-4 period is largely reflective of weak and conflicting dynamical model signals with EC carved out for much of the CONUS. Above normal precipitation is favored for Texas and the southern Plains where model agreement is strong. A weak but consistent dry signal is forecast for the upper Great Lakes under the aforementioned anomalous ridging. Enhanced precipitation probabilities are indicated along the southern Alaska coast and Panhandle under weak onshore flow while EC is indicated for the remainder of the state .
Near normal SSTs are observed around much of Hawaii with slightly elevated temperatures toward the northwestern islands. Dynamical models from the SubX MME consistently favor above normal temperatures with probabilities slightly lower for Hilo. However, uncertainty is much higher for the precipitation outlook due to lack of model agreement, and EC is forecast across the islands.-
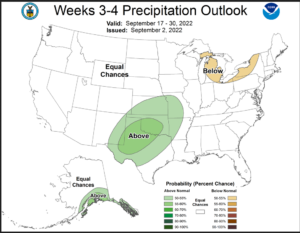
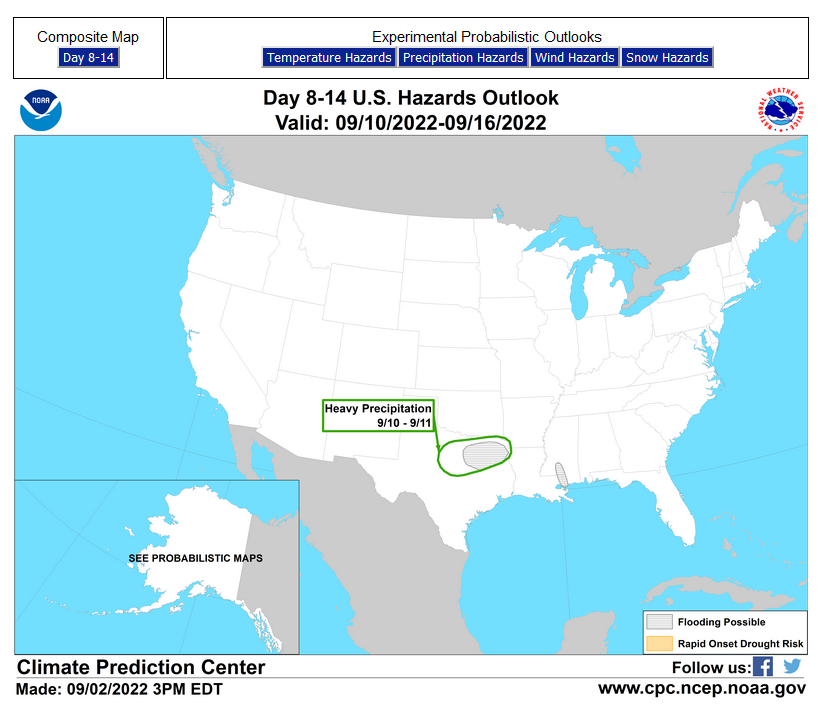
| The extremes are shown on the maps and described in the text. It is important to note that the Week 3 -4 Outlook is prepared by a different team than the 6 -10 and 8 – 14 day Outlooks. |
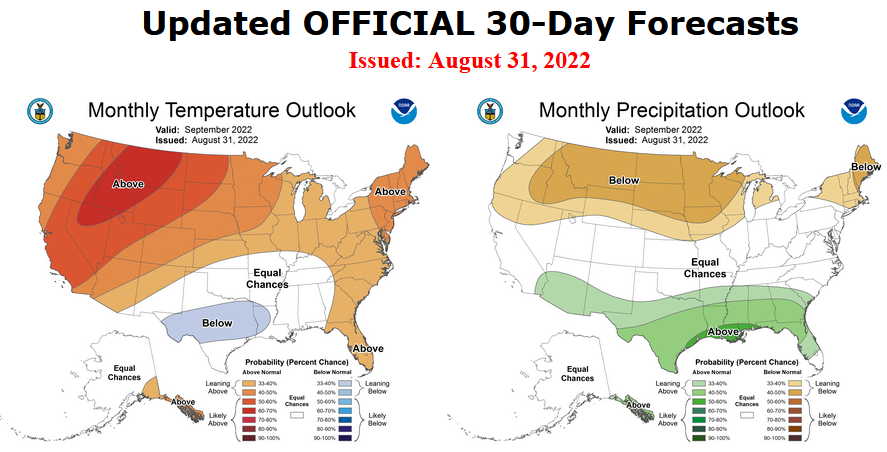
Reviewing the previously issued Outlook for September that was issued on August 31, 2022
–
–
| When we publish our 28-day Outlook at the end of the month we wonder if the sum (concatenation) of the partial-month outlooks equals the Monthly Outlook recently issued. Friday was September 2 so we wonder if things have changed since the Monthly Outlook was issued on August 31, 2022. I have not organized this article in the best way to make that comparison but it does seem that the Temperature Outlook is different and the Precipitation Outlook may also be somewhat different. But this article would get too long if I went into detail but readers can do their own comparisons. I personally would pay more attention to this 28-Day Outlook (and we have two days of actual data and there are 30 days in September). So this article is basically an Outlook for the Month of September. |
Now switching over to Part II of this article which is our regular 48-Hr Forecast which also includes links for tropical updates.
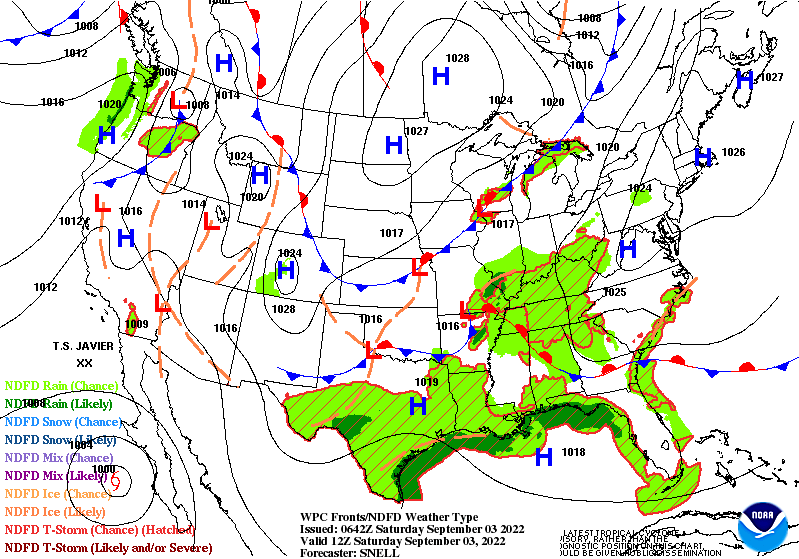
Here is what we are paying attention to tonight and the next 48 hours from this evening’s NWS Forecast.
(It is updated twice a day and these updates can be found here.
...There is a Slight Risk of excessive rainfall over multiple locations
from parts of Northeast/Lower Great Lakes to the Western Gulf Coast
through Monday morning, Labor Day...

...Excessive Heat Warning and Heat Advisories over parts of the West
Coast...

...Critical to Elevated fire weather over parts of the Northwest to
Northern High Plains...

Upper-level low and weak fronts will aid in producing showers and
thunderstorms with heavy rain over parts of the Ohio Valley/Northeast to
the Southeast to Western Gulf Coast. Therefore, the WPC has issued a
Slight Risk of excessive rainfall over parts of Ohio/Tennessee Valleys,
Lower Great Lakes/Northeast, and Central/Western Gulf Coast through Monday
morning, Labor Day. The associated heavy rain will create mainly localized
areas of flash flooding, with urban areas, roads, and small streams the
most vulnerable.

The threat of excessive rainfall moves eastward to the Eastern
Ohio/Tennessee Valleys and Southern Appalachians and develops over parts
of the Lower Great Lakes/Northeast on Sunday. The threat of excessive
rainfall decreases to a Marginal Risk over the Eastern Ohio Valley and the
Central/Southern Appalachians on Monday. Also, the Slight Risk of
excessive rainfall is limited to the Western Gulf Coast by Monday.

Furthermore, monsoonal moisture and upper-level energy will produce
diurnal areas of showers and thunderstorms from parts of Southeastern
California, Southwest, and Central/Southern Rockies through Saturday
evening, with heavy rain possible. Therefore, the WPC has issued a
Marginal Risk of excessive rainfall over parts of the Southeastern
California, Southwest, and Central/Southern Rockies through Sunday
morning. The associated heavy rain will create localized areas of flash
flooding, affecting areas that experience rapid runoff with heavy rain.
However, the showers and thunderstorms will end by late evening on
Saturday.

Secondly, an upper-level ridge over parts of California and into the
Northern will remain over the area through Monday. Therefore, excessive
Heat Warnings are over most of California into parts of far western
Arizona/southern Nevada through Monday. High temperatures will be in the
100 to 110 degrees in some places, with nighttime lows in the 80s. In
addition, relatively high dew points along the U. S./Mexican border also
aid in the experience of high heat. Moreover, a few locations will have
record high low temperatures contributing to areas not cooling off
overnight, which will also contribute to the effects of heat over parts of
the region.

There is a Critical Risk of fire weather over parts of the Northern
Intermountain Region/Great Basin through Sunday morning. Likewise, there
is an Elevated Risk of fire weather over parts of Northeastern California,
Great Basin, Northern Intermountain Region, Northern Rockies, and Northern
Plains on Sunday. The fire weather threat has prompted Red Flag Warnings
over most of the region.
Maps that relate the forecast to geography can be found by clicking Here for Day 1 and Here for Day 2.
Here is a 60-hour animated forecast map that shows how the short-term forecast is expected to play out.
If it needs to be updated click here.
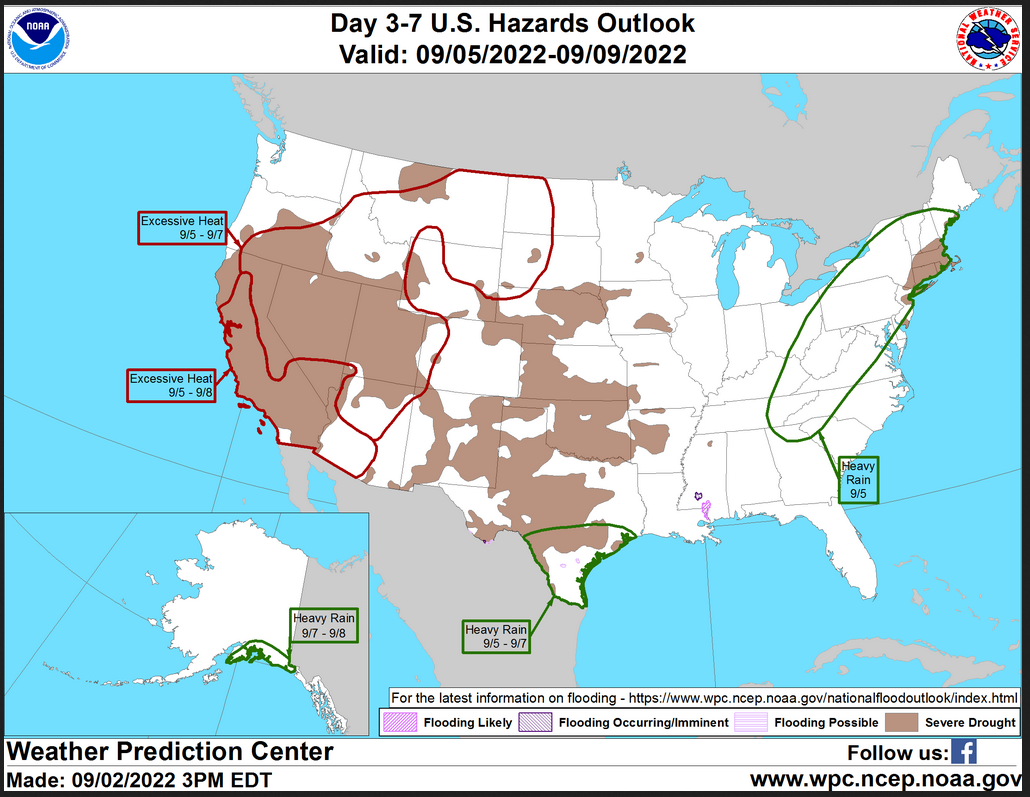
HAZARDS OUTLOOKS
Click h ere for the latest complete Day 3 -7 Hazards forecast which updates only on weekdays. Once a week probably Monday or Tuesday I will update the images. I provided the link for readers to get daily updates on weekdays. Use your own judgment to decide if you need to update these images.
Worldwide Tropical Forecast
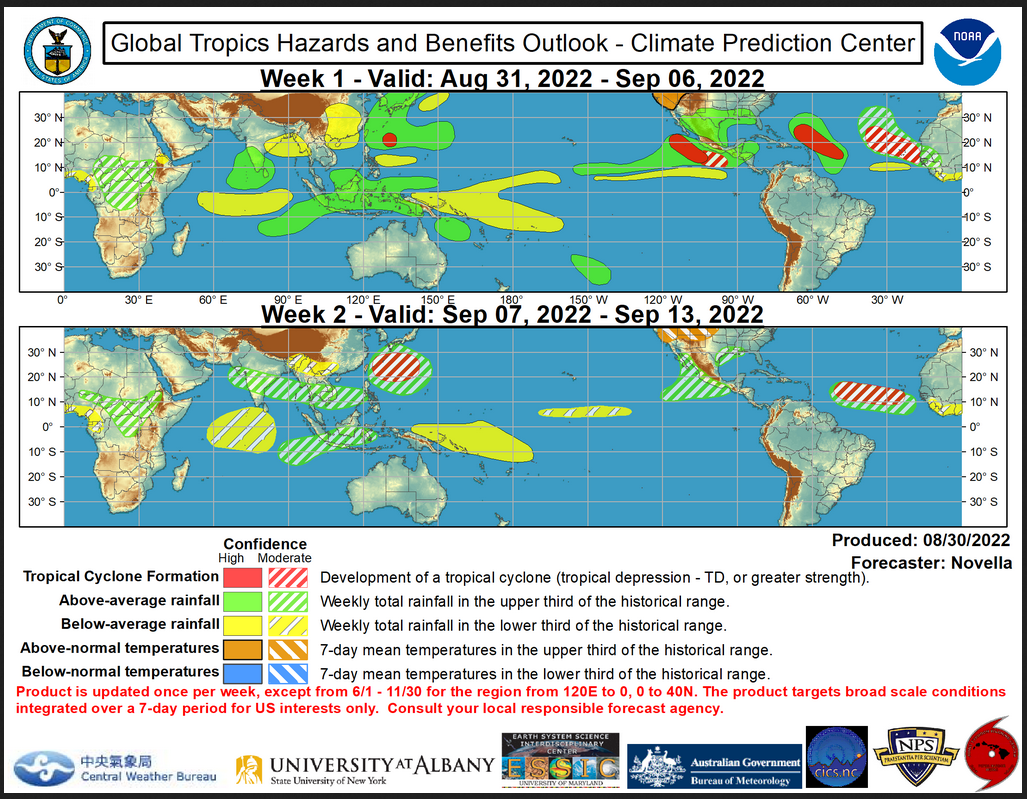
(This graphic updates on Tuesdays) If it has not been updated, you can get the update by clicking here
Detailed Maps and Reports for the Western Atlantic and the Pacific Oceans
Below are three maps that summarize the situation for the Atlantic, Eastern and Central Pacific. Additional information can be accessed by clicking HERE
First the Atlantic
Click to view the forecast map and have access to additional information https://www.nhc.noaa.gov/gtwo.php?basin=atlc&fdays=5
Then Eastern Pacific
Click to view the forecast map and have access to additional information https://www.nhc.noaa.gov/gtwo.php?basin=epac&fdays=5
Then Central Pacific
Click to view the forecast map and have access to additional information https://www.nhc.noaa.gov/gtwo.php?basin=cpac&fdays=5
And the Western Pacific
Click to view the forecast map and have access to additional information https://www.metoc.navy.mil/jtwc/jtwc.html
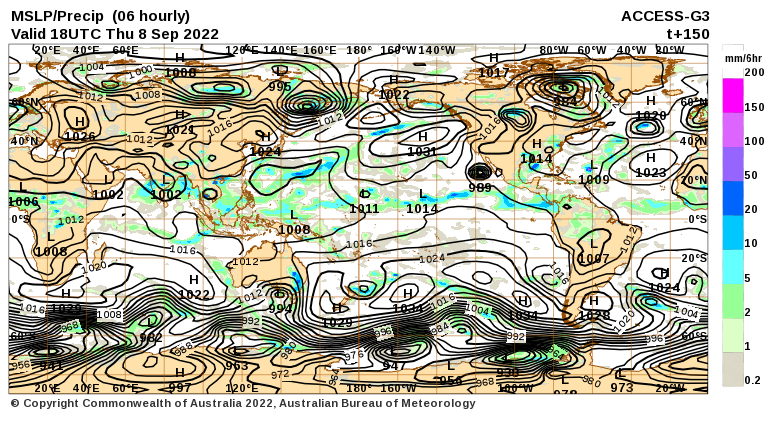
World Forecast for Day 6 (Currently Set for Day 6 but the reader can change that)
World Weather Forecast produced by the Australian Bureau of Meteorology. Unfortunately, I do not know how to extract the control panel and embed it into my report so that you could use the tool within my report. But if you visit it Click Here and you will be able to use the tool to view temperature or many other things for THE WORLD. It can forecast out for a week. Pretty cool. Return to this report by using the “Back Arrow” usually found top left corner of your screen to the left of the URL Box. It may require hitting it a few times depending on how deep you are into the BOM tool. Below are the current worldwide precipitation and air pressure forecasts for six days out. They will not auto-update and right now are current for Day 6. If you want the forecast for a different day Click Here I will try to update this map each day but you have the link so you can access the dashboard and get a wide variety of forecasts.I mostly rely on the reader to interpret world maps. For this map, areas of expected precipitation for the date and time shown are clearly shown. The number of High-Pressure systems shown is called the Wave Number. Maybe I will discuss WN someday. But it shows how many Rossby Waves there are around the World. Sometimes they are hard to count. Counting Low-Pressure systems should provide the same WN. Rossby Waves are the way the temperature distribution of the Planet remains in balance. It is basically the science of fluid dynamics. It can be very helpful in predicting the movement of weather patterns. You can snip an area of interest and move it into MS Paint and enlarge it.
Month to Date Information
Month to date Temperature can be found at https://hprcc.unl.edu/products/maps/acis/MonthTDeptUS.png
Month to date Precipitation can be found at https://hprcc.unl.edu/products/maps/acis/MonthPNormUS.png
