Wildland Fire Risk Maps updated at 10:04 pm EDT on September 1, 2022
Short-term improvement in drought for September. It is more than previously forecast.
At the end of every month, NOAA updates their Outlook for the following month which in this case is September. They also issue a Drought Outlook for the following month. We are reporting on that tonight.
There have been some significant changes in the Outlook for September and these are addressed in the NOAA Discussion so it is well worth reading. We highlighted some of the important changes within the NOAA Discussion.
Of significant interest is the Drought Outlook for September. It is again a big improvement but unfortunately, it probably is a one-month event. We have also included four months of Wildland Fire Potential Outlooks and also a map showing the year-to-date precipitation in the West. We also included a Monsoon Update.

Here is the updated Outlook for September
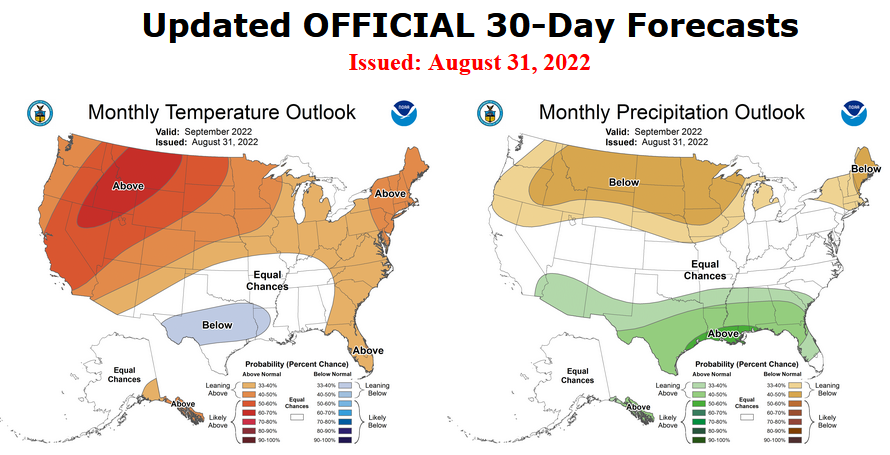
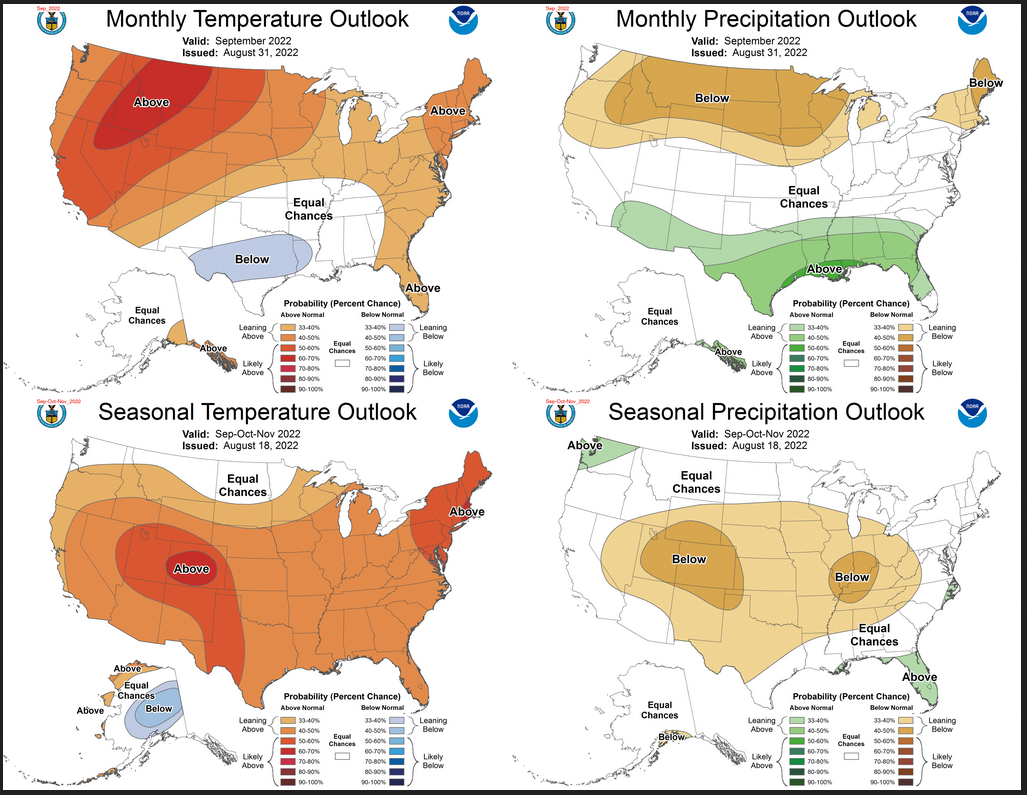
Combination of the Updated Outlook for September and Three-Month Outlook
–
| Most of the difference has to do with the North American Monsoon which for September makes the area most impacted by the Monsoon wetter and cooler than normal. The three-month map suggests that the above normal characteristic of this Monsoon will not extend beyond September. You can also see the shift in the focus of the extreme heat. |
There are some reversals in the new forecast for September relative to the three-month forecast. By a reversal we mean a change from wet to dry or warm to cool. Most of the changes are from Wet/dry/warm/cool to neutral or the reverse. But there are some significant reversals.
| For both temperature and precipitation, if you assume the colors in the maps are assigned correctly, it is a simple algebra equation to solve the month two/three anomaly probability for a given location = (3XThree-Month Probability – Month One Probability)/2*. So you can derive the month two/three outlook this way. You can do that calculation easily for where you live or for the entire map. |
It is important to remember that the September Outlook was updated on August 31 and the three-month Outlook was issued on August 18. So we always wonder if a change in the one-month outlook suggests that the three-month outlook would need to also be adjusted. I think that in this case, the answer is a qualified“yes”. The stronger than expected Monsoon could impact the three-month outlook and more than slightly.
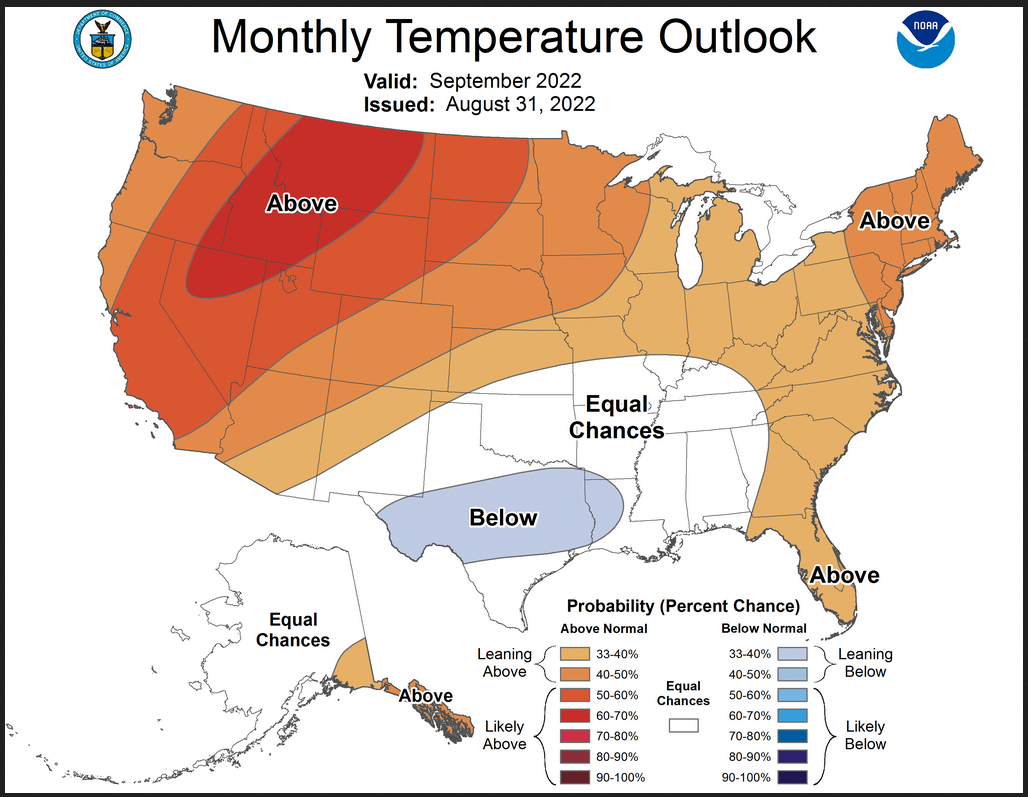
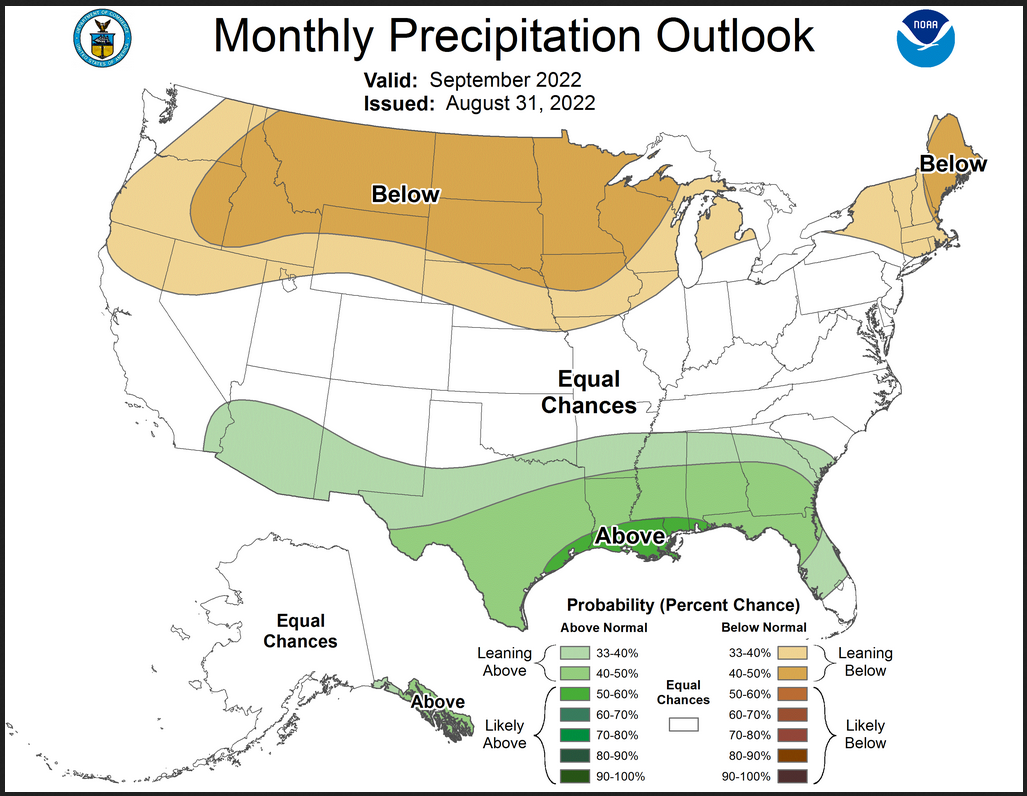
Here are larger versions of the Temperature and Precipitation Outlook maps
NOAA Discussion (I have shown certain important points in bold type)
30-DAY OUTLOOK DISCUSSION FOR SEPTEMBER 2022
The current state of the El Niño Southern Oscillation (ENSO) remains in the negative phase with the latest weekly observed Niño 3.4 Index value standing at -0.9 degrees Celsius. Meanwhile, the magnitude of the Real-time Multivariate (RMM) based Madden Julian Oscillation (MJO) index has increased during the past week over the Indian Ocean, but is forecast to gradually weaken as it propagates eastward across the Indian Ocean and the Maritime Continent during the next two weeks. Composites from this combined ENSO/MJO state for the month of September depict anomalous 500-hPa mean troughing over the southeastern Contiguous United States (CONUS) and over the Gulf of Alaska. Near to above normal 500-hPa heights are depicted across much of the western and northern CONUS as well as over the Alaeutians. However, as we close out the month of August, short term dynamical model guidance is increasingly relied upon with the official short and medium range outlooks from the Weather Prediction Center (WPC), 8-14 Day Outlooks from the Climate Prediction Center (CPC), and Weeks 3-4 Outlooks from CPC forming the backbone of the updated September 2022 outlooks. Dynamical model guidance from the Climate Forecast System Version 2 (CFSv2), the Global Forecast System (GFS), the European Centre for Medium Range Weather Forecasts (ECMWF), and Environment and Climate Change Canada (ECCC) were utilized to supplement the official outlooks. These inputs predict strong anomalous ridging over the western CONUS and Northern Plains during the beginning of the month. Cyclonic flow is depicted across much of Alaska and troughing or a weakness in subtropical ridging is forecast across much of the eastern and south-central CONUS. By mid-month, above normal heights are forecast to overspread most of the northern CONUS and a slight tilt toward below normal heights is expected across most of the Southern Tier. Cyclonic flow forecast across Alaska early in the month and is generally predicted to weaken and retrograde across western parts of the state as time progresses. The latest CPC Week 3-4 Outlook indicated the potential for increased troughing for the northwestern CONUS toward the middle or latter parts of September with near to above normal heights favored across most of the remainder of the forecast domain.
The updated September temperature outlook indicates increased probabilities of above normal temperatures across much of the western and northern CONUS as well as along the Eastern Seaboard. The greatest confidence for above normal temperatures is across the northern Intermountain West and High Plains, where probabilities exceed 60 percent. This represents a northward shift in the most favored area of above normal temperatures relative to the mid-month outlook, due to the likelihood for strong, anomalous ridging over the western CONUS to start the month. Conversely, increased probabilities of below normal temperatures are indicated across the south-central CONUS, as a weakness in subtropical ridging and enhanced moisture are likely for this region during much of the month. A weak tilt toward above normal temperatures is indicated for southeastern Alaska, as troughing is forecast to weaken and retrograde across the state, promoting advection of milder air ahead of this weakening trough. Above normal sea surface temperatures (SSTs) also contributed to enhancing probabilities of above normal temperatures across the Alaska Panhandle.
The updated September 2022 precipitation outlook favors above normal precipitation across most of the Southern Tier of the CONUS due to predicted weaknesses in subtropical ridging, near to below normal heights, and potential influxes of tropical moisture. Conversely, below normal precipitation is likely across much of the northern CONUS as above normal heights are forecast to overspread the Northern Tier as the month progresses. Additionally, predicted strong anomalous ridging early in the month contributed to the tilt toward below normal precipitation across much of the Northern Rockies, Northern Plains, and Upper Mississippi Valley. Increased probabilities of above normal precipitation are indicated for the Alaska Panhandle, ahead of weakening cyclonic flow predicted upstream.
Drought Outlook
Here is the newly issued Drought Outlook for September 2022
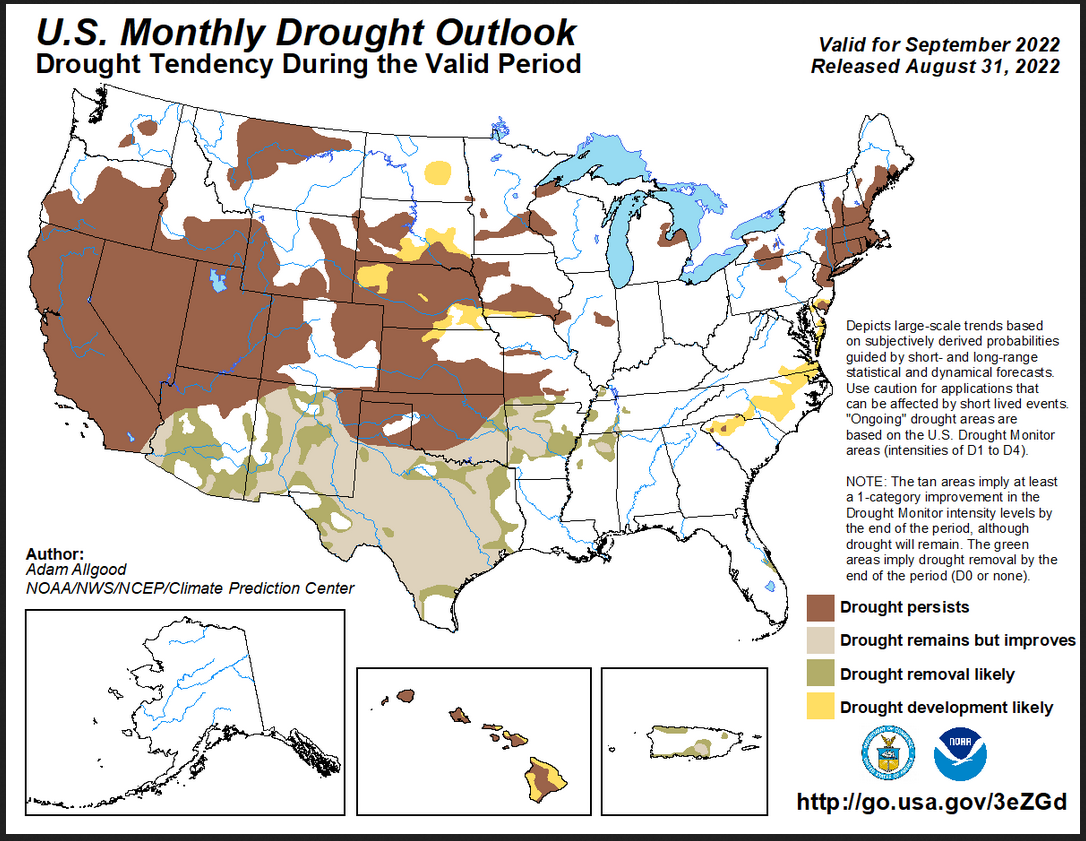
–
| You can see where the Monsoon will improve the drought situation and where drought development is likely. The summary and detailed discussions that accompany this graphic can be accessed here https://www.cpc.ncep.noaa.gov/products/expert_assessment/mdo_summary.php |
Possible Tropical Events
Worldwide Tropical Forecast
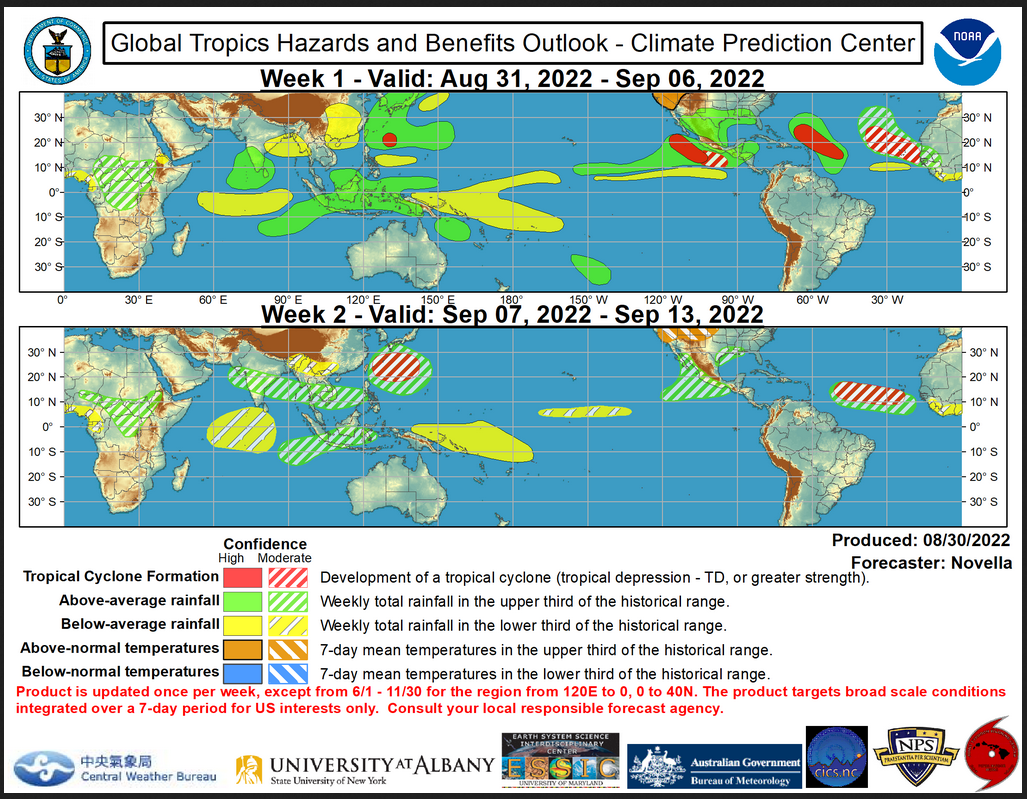
–
| Notice the above-normal precipitation predicted for the area bordering the Gulf of Mexico. When this graphic updates the situation may look different. You can track this in the Daily 48-hour and Intermediate-Term Outlook we publish daily. This graphic is showing two weeks out of the month. There are plans to have this graphic show weeks 2 and 3 rather than 1 and 2. |
To update this forecast (which updates on Tuesdays) click here https://i0.wp.com/www.cpc.ncep.noaa.gov/products/precip/CWlink/ghazards/images/gth_small.png?resize=1100%2C850&ssl=1
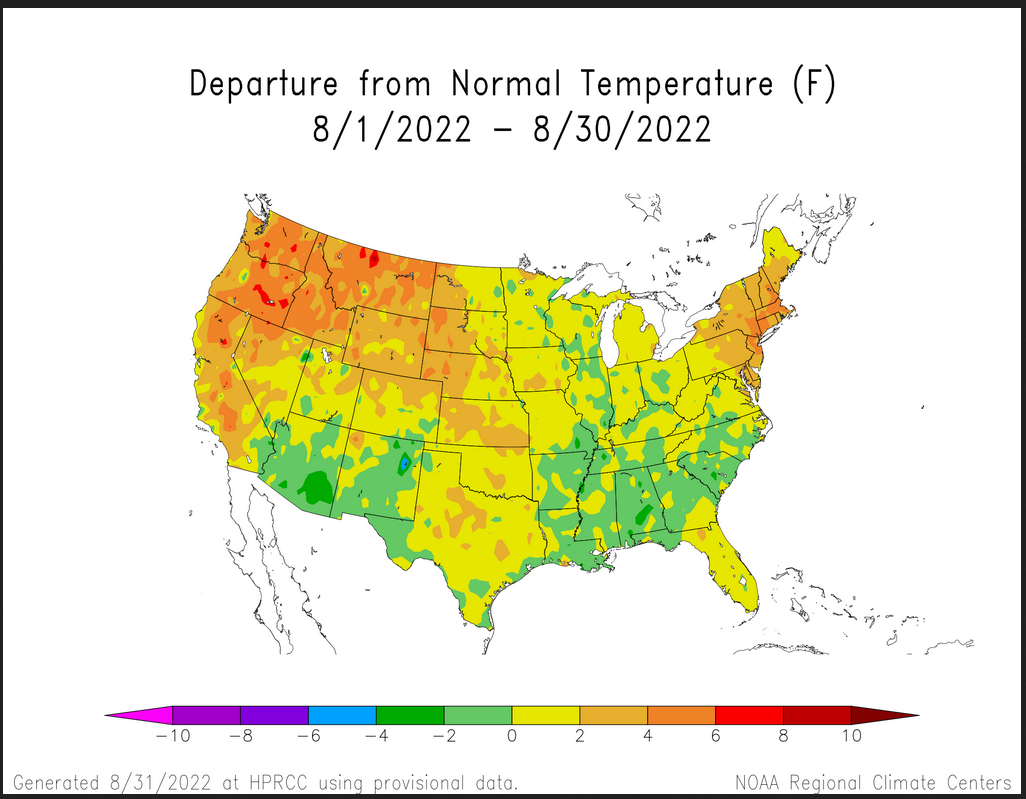
Tracking Temperature and Precipitation as the month proceeds
Month-to-date Temperature as the current month evolves can be found at https://hprcc.unl.edu/products/maps/acis/MonthTDeptUS.png
Looking back at August this is what we have observed.
Month-to-date Precipitation as the current month evolves can be found at https://hprcc.unl.edu/pro ducts/maps/acis/MonthPNormUS.png
Looking back at August this is what we observed.

Southwest Monsoon Update.
I am providing the links as the situation changes from day to day. Plus there are a lot of maps and graphics to look at so this would slow down your computer and not everyone is interested.
Arizona
Just click on this link https://cals.arizona.edu/climate/misc/monsoon/az_monsoon.html
New Mexico
Just click on this link https://cals.arizona.edu/climate/misc/monsoon/nm_monsoon.html
Overall Southwest (so this covers the entire area)
Just click on this link https://cals.arizona.edu/climate/misc/SWMonsoonMaps/current/swus_monsoon.html
No Podcast this month: sorry.
Fire Outlook: Current and Forecast

Updates to the major fire situation can be found by clicking here https://fsapps.nwcg.gov/afm/index.php
Now looking at the wildland fire potential outlooks
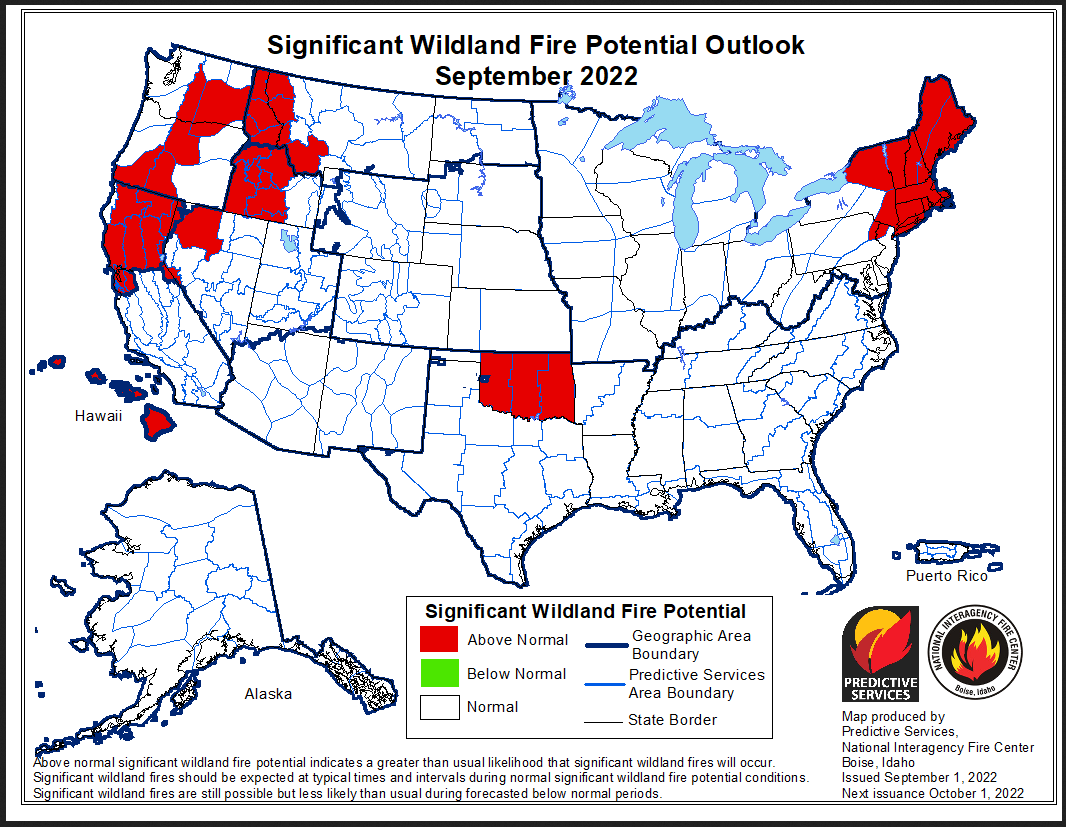
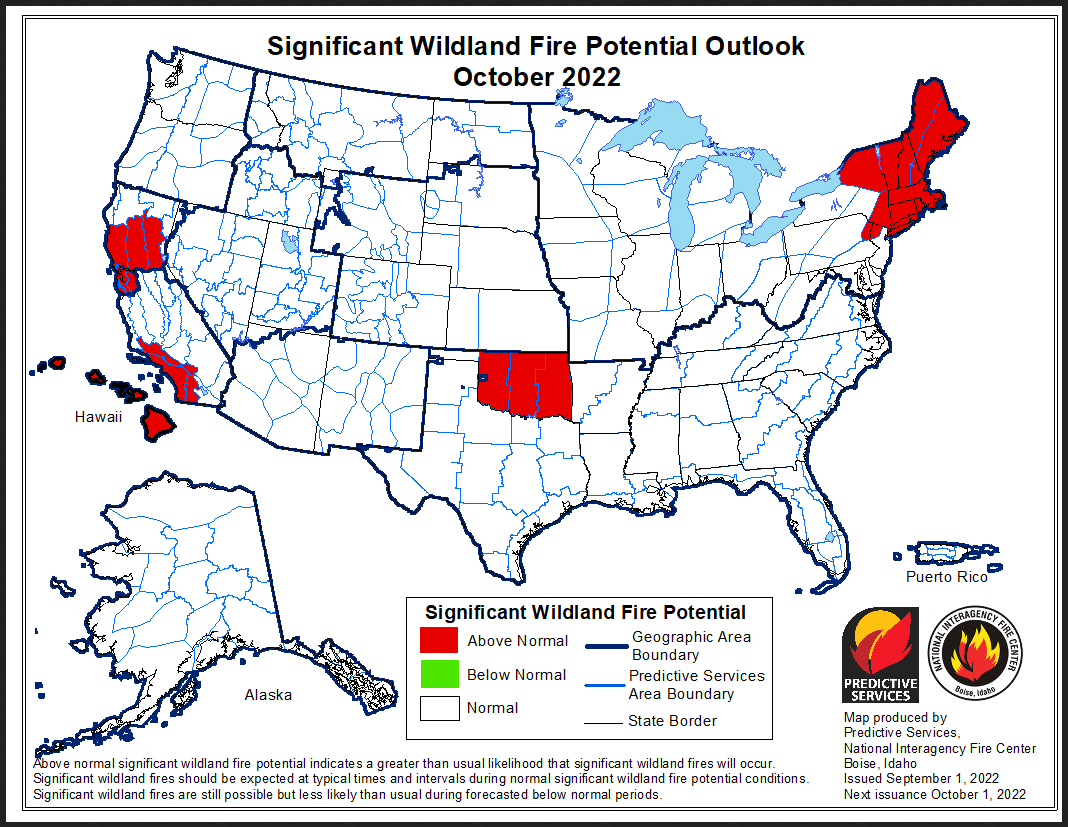
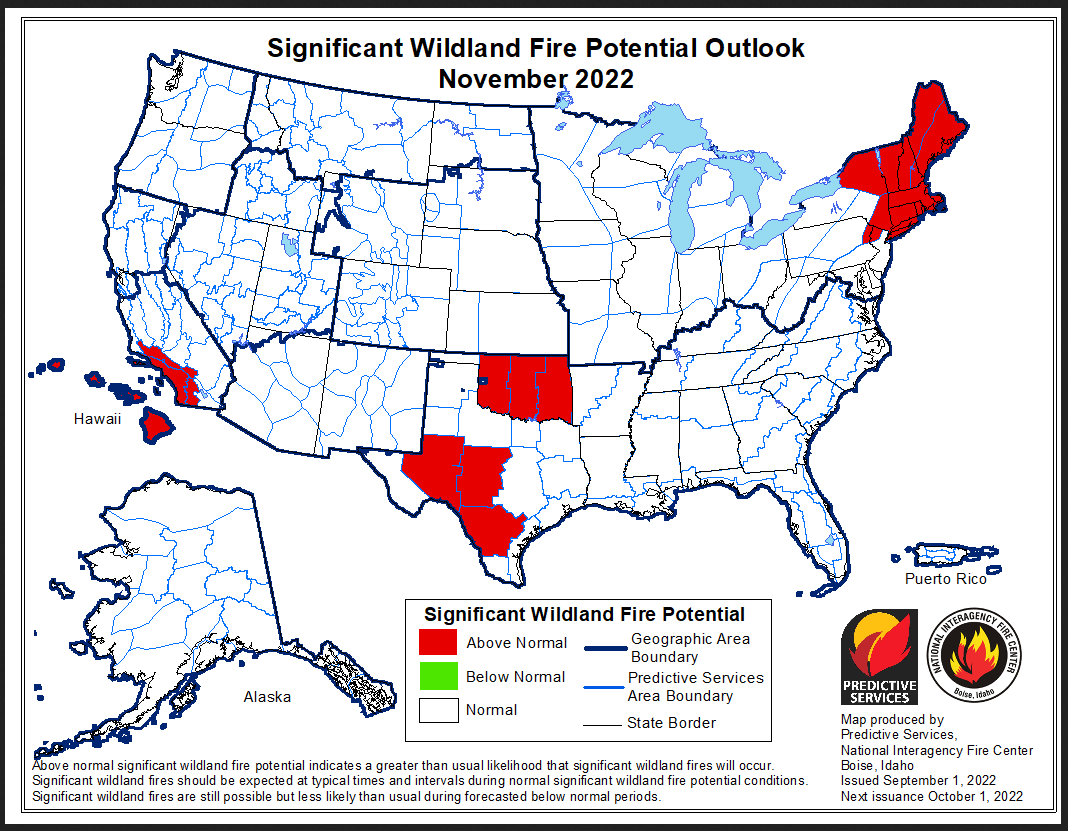
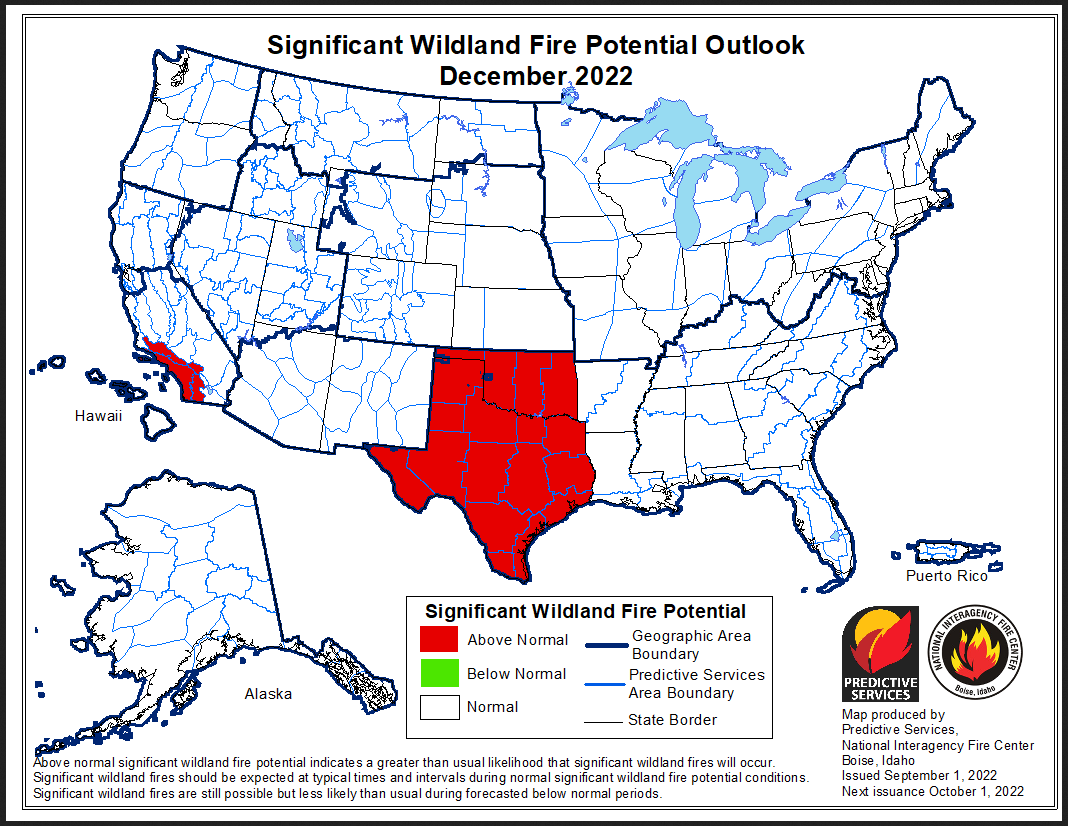
I have updated the above maps. If you read this article a month from now, you can update these graphics by clicking here https://www.nifc.gov
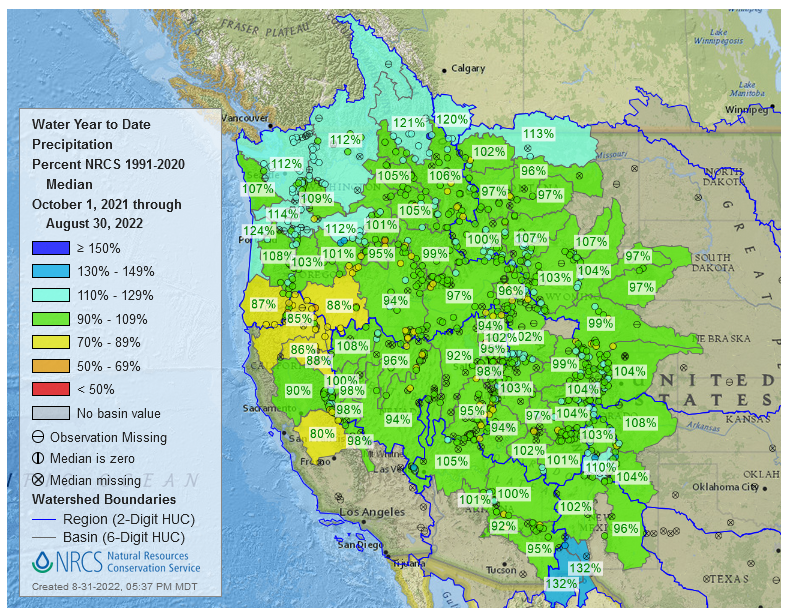
Water-Year to Date Precipitation
Water year-to-date precipitation can be found by clicking here https://www.nrcs.usda.gov/wps/portal/wcc/home/ I provided a map current as of August 30, 2022
–
| I have some questions about the above graphic. It seems too wet. Compare it to the state rankings we published recently. But we do not have the state rankings for August yet nor of course year-to-date through August so we will have to take a look at this when we have that data. Please remember the water year starts on October 1 of the prior calendar year. It has been more a question of heat rather than a shortage of precipitation. |
| I hope you found this article interesting and useful |