Usually, I compare the JAMSTEC forecast with the NOAA forecast after NOAA Issues its Seasonal Outlook. But this month, JAMSTEC was very early so I thought I would share it with everyone early. But I did not get around to doing it until now. NOAA calls their predictions an outlook but JAMSTEC calls their predictions a forecast. I am going to show the JAMSTEC forecasts by month and by season and some of the indices they use in their model. They make world forecasts and for any readers who do not realize it, the U.S. is part of the world so it is covered by a world forecast.
I like the JAMSTEC forecast because the U.S. is part of the world and our weather is not independent of the worldwide weather pattern. In fact, most of U.S. weather originates in the Pacific Ocean and the Pacific Ocean is where Japan is located. In fact, Japan and the US jointly manage the monitoring system along the Equator that helps predict the phases of ENSO. So one of the reasons I include worldwide forecasts in articles is to encourage the understanding of worldwide weather patterns. It is not that the U.S. does not cooperate with other nations with respect to weather forecasts as it does. But to view weather forecasts on the Internet or TV you would not easily notice that. The U.S. media pays hardly any attention to what other meteorological agencies predict.

For Introductory purposes, I will again describe what JAMSTEC is.
JAMSTEC | Japan Agency for Marine-Earth Science and Technology

It is not a huge organization like NOAA but it does a lot of things much of which are related to ocean research. It is not the weather forecasting agency for JAPAN but issues this worldwide forecast as part of its research program. Some information on their model can be found by clicking Here
I will begin with the three short-term monthly forecasts that they have provided me.
First September 2022
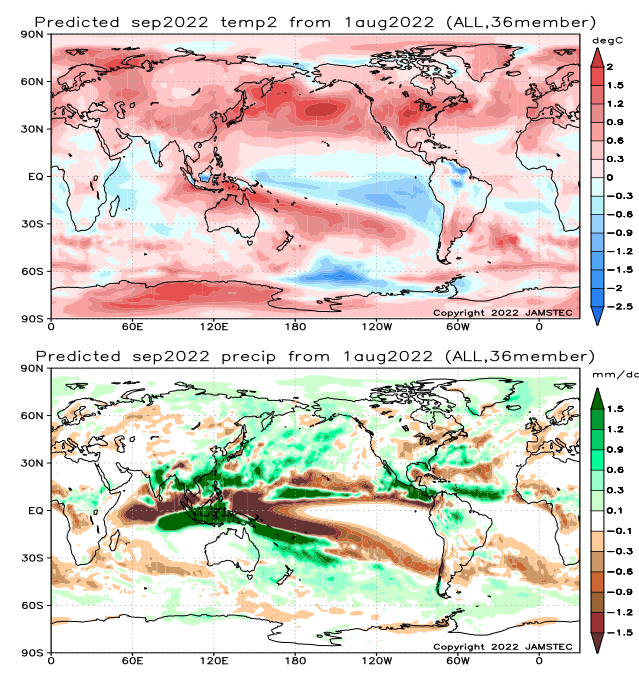
For any of these images, I can snip and enlarge a particular area of interest such as below for September 2022 precipitation.
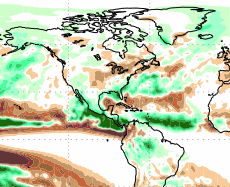
| But if I do that I end up with a very large number of graphics and If I then try to compare them with the NOAA graphics it gets very complicated. That is especially true now that JAMSTEC is not only providing me with three seasonal forecasts but also individual forecasts for each of the first three months which is more than I receive from NOAA. There is usually a lot of disagreement between NOAA and JAMSTEC some of which relates to their assumptions about ENSO but there are other reasons for the disagreement. I have decided not to do the comparative analysis. But anyone who wants to can do it themselves. You can snip and move what you have snipped into MSPAINT and enlarge it and the images issued by NOAA are in the article I published a few days ago and they can be accessed here https://econcurrents.com/2022/08/20/noaa-issues-four-season-outlook-on-august-18-2022/ |
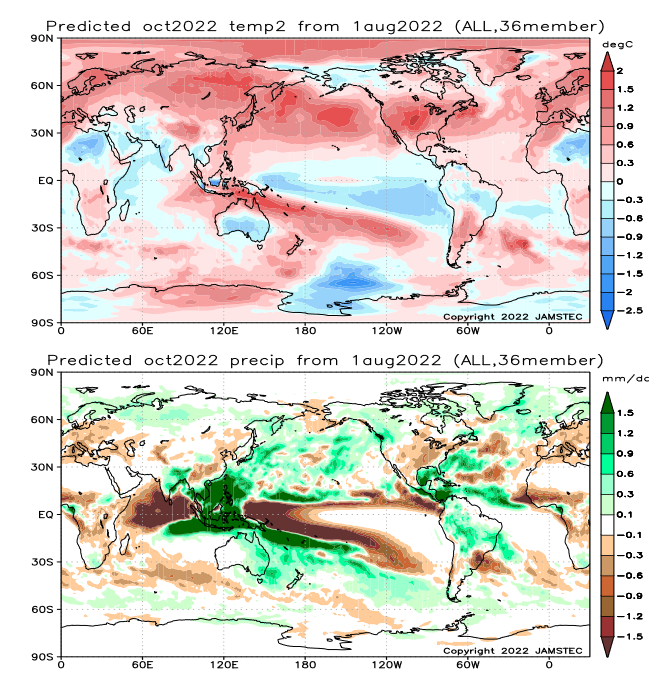
Then October, 2022
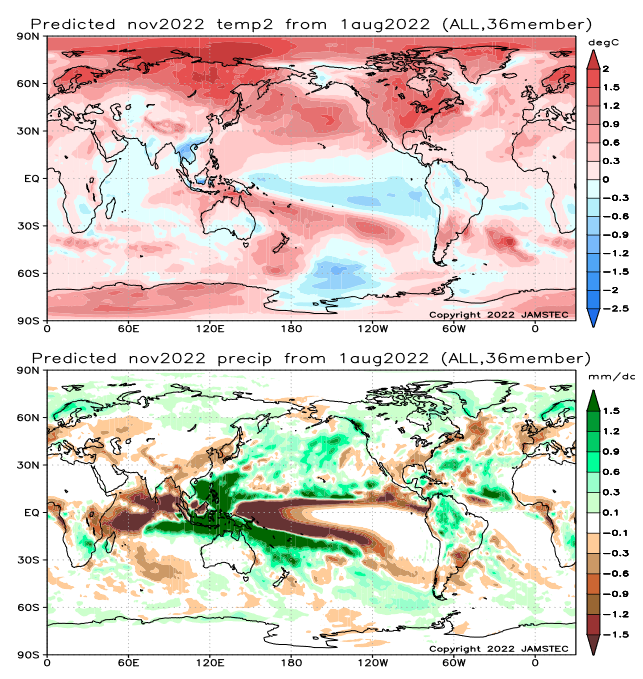
Then November, 2022
Then we shift to the three seasonal forecasts (these are three-month forecasts and this month they align with the meteorological definition of seasons which is a bit different than what most people are used to)
But first I want to look at the forecasts for sea surface temperatures.
We start with the forecast of Sea Surface Temperature Anomalies (SSTA). Later I will show the indices that were part of the process of preparing the following forecasts.
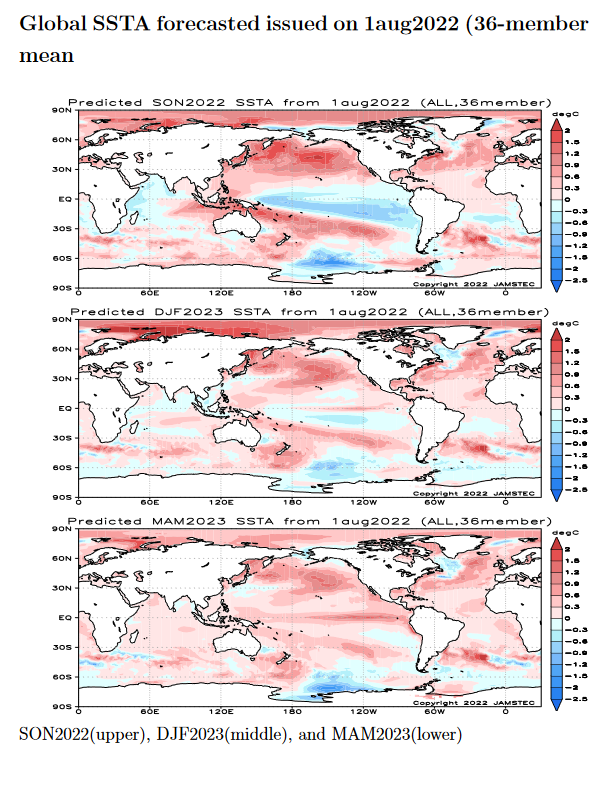
| Look along the Eastern Pacific along the Equator from 170W to 120W. “Red” shows warmer than normal and “Blue” shows cooler than normal. You can see the La Nina in the SON part of the graphic. It is no longer in the DJF 2022/2023 graphic and the MAM part of the graphic shows El Nino. This is a forecast of a more aggressive transition than predicted by NOAA. If correct, It has profound implications. |
Now back to the seasonal forecasts of Temperature and Precipitation. It shows predicted deviations from Normal but not the probabilities associated with the forecast.
First September/October/November 2022
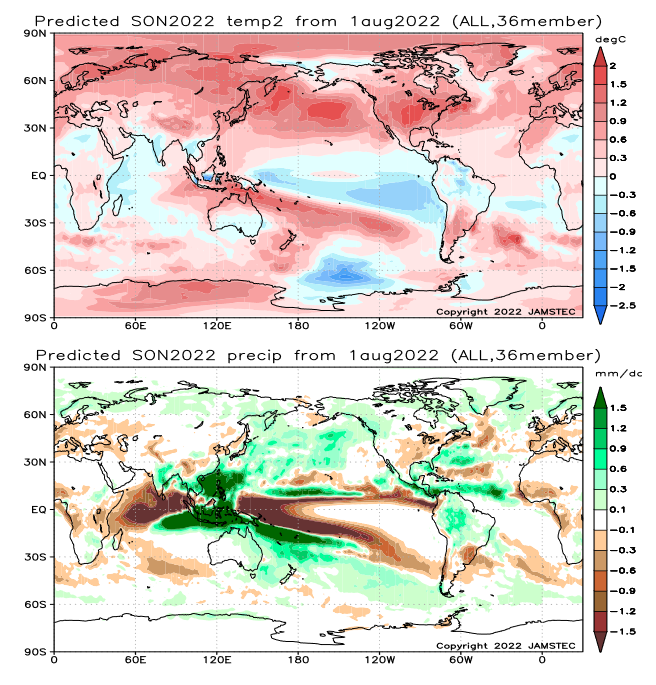
One can interpret this map themselves but this is what JAMSTEC says about it (I extracted the information from their discussion)
–
On a seasonal scale, the SINTEX-F predicts that most parts of the globe will experience a warmer-than-normal condition in boreal autumn (austral spring), except for northern part of the South American Continent, southern Australia, northern Africa, East Africa, India, and some parts of Indochina and Indonesia. As regards to the seasonally averaged rainfall in boreal autumn (austral spring), a drier-than-normal condition is predicted for most parts of the U. S. A., La Plata, Chile, Sri Lanka, West/Central/East Africa, most part of Europe, some part of China, some part of the Eurasia, and some part of Indochina. In contrast, southern Alaska, most part of Canada, Central America, northern part of the South American Continent, eastern Australia, India, Northern Europe, some part of Eurasia, some part of Indochina, Philippine, and Indonesia will experience a wetter-than-normal condition. In particular, we notice that Indonesia and Australia (East Africa) may experience extremely wetter (drier) than normal conditions, owing to the strong negative Indian Ocean Dipole. As regards to the seasonally averaged climate, the model predicts that most parts of Japan will experience a warmer and drier-than-normal condition in boreal autumn and winter.
–
And December/January/February 2022/2023
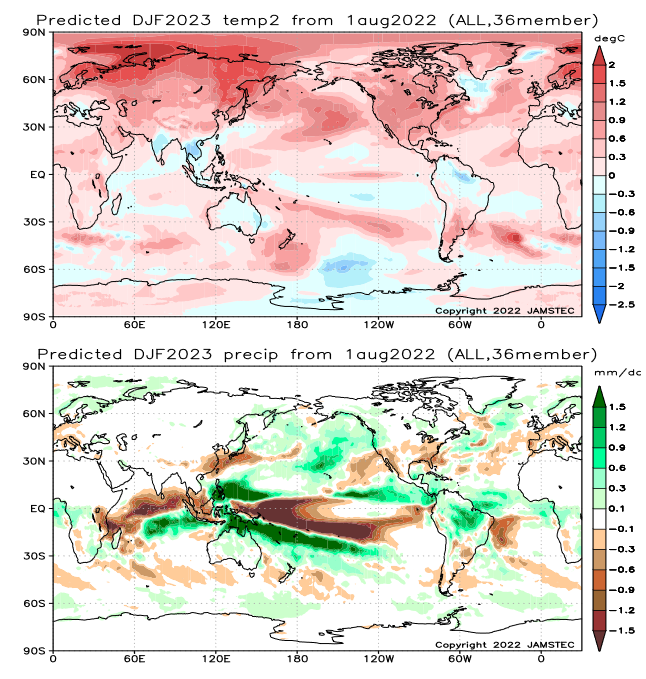
One can interpret this map themselves but this is what JAMSTEC says about it (I extracted the information from their discussion)
In boreal winter (austral summer), the model still predicts that most parts of the globe will experience a warmer-than-normal condition, except for northern part of the South American Continent, Australia, India, most parts of Indochina and Indonesia. In boreal winter (austral summer), a wetter-than-normal condition is predicted for western Canada, northern part of the South American Continent, Australia, southeastern Africa, Central Africa, Northern Europe, and Philippine. In contrast, most parts of the U.S.A., La Plata, East Africa, Sri Lanka, southern Indochina, Indonesia, some part of western Europe, East Asia will experience a drier-than-normal condition. As regards to the seasonally averaged climate, the model predicts that most parts of Japan will experience a warmer and drier-than-normal condition in boreal autumn and winter.
–
And Finally March/April/May 2023
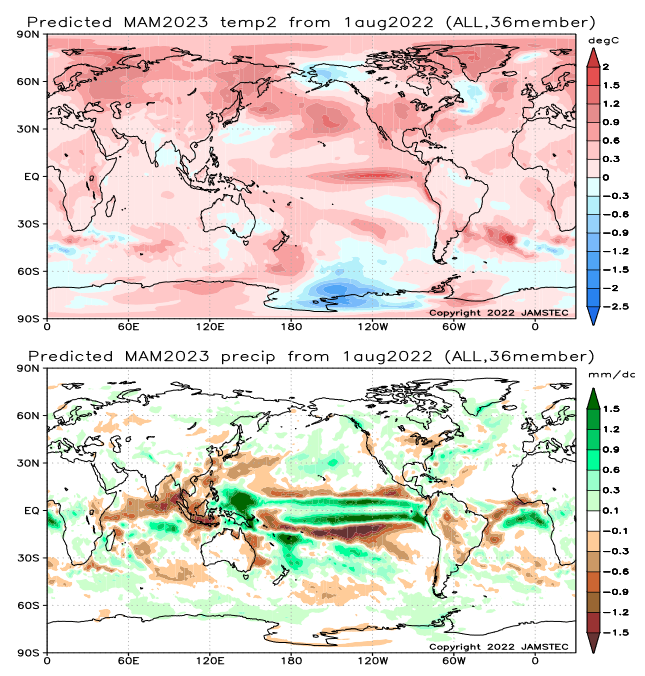
| JAMSTEC usually does not comment on their third Season Forecast. The reliability of longer-term forecasts are less. You can see that Southeast Asia and the Maritime Continent are dry. https://en.wikipedia.org/wiki/Maritime_Continent If there is drought in North America, it is in a different location than we have seen the last three years. |
Now we look at the ENSO assumptions used.
The forecasts of certain indices is Interesting. I am not showing all of the JAMSTEC Indices but the ones that have the greatest impact on CONUS weather and also the IOD which impacts a lot of nations bordering the Indian Ocean.
One specific part of the Equatorial Pacific is called Nino 3.4 and below is the recent record of that area stated as a single index and to the right are the various model runs of the JAMSTEC Nino 3.4 forecast model. There is a lot of scatter but the general direction for most of the model runs is similar and if you have no better idea on how to interpret a bunch of model runs, you take the mean and that is shown although the color-coding leaves something to be desired.
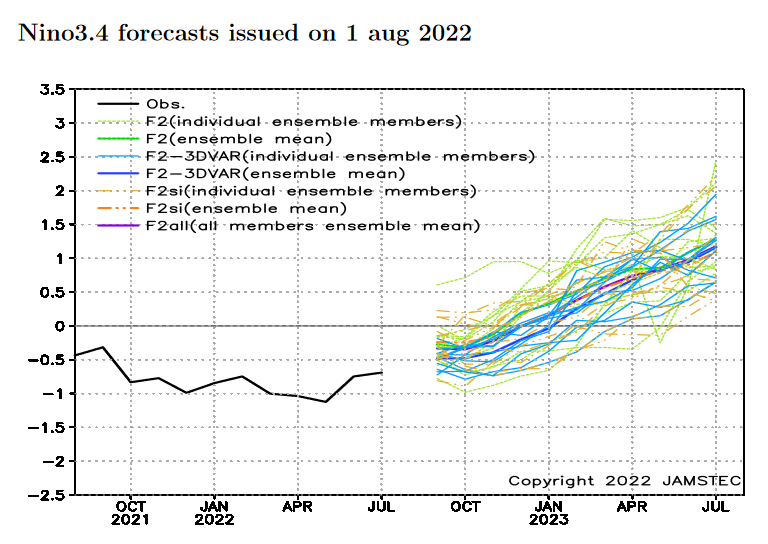
| JAMSTEC shows La Nina ending by October and they also forecast El Nino for 2023. -0.5C to +0.5C is ENSO Neutral. Lower than -0.5C is La Nina and warmer than +0.5C is El Nino. There is also an atmospheric component necessary to confirm the water temperature measurement forecast shown here. But it is not currently possible to forecast that. This shows La Nina ending very soon (by October) unlike the perspective of NOAA. |
JAMSTEC has a separate model to forecast what they call a Modoki. I have discussed this many times and for now, let’s just say they look for sea surface temperature anomalies that are farther west than normal for a standard El Nino or La Nina. This model shows a slower exit of La Nina or perhaps I should say a more gradual change within the ENSO Neutral Phase.
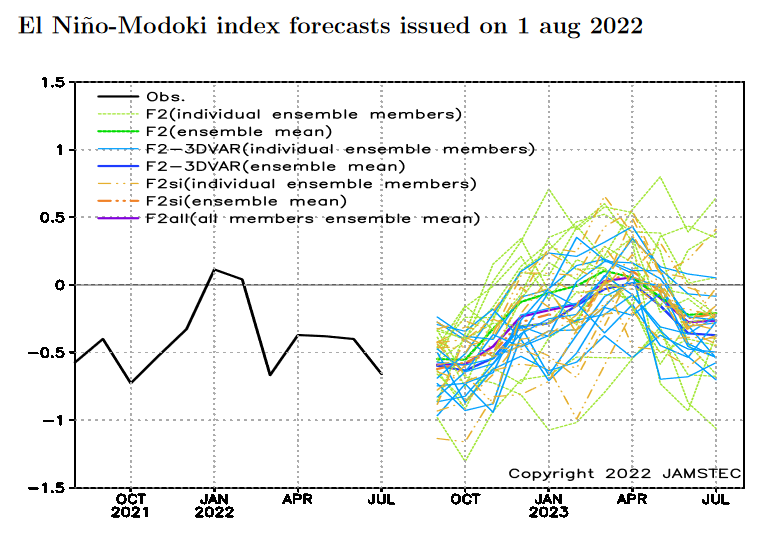
The standard JAMSTEC model is interesting because it almost seems to be forecasting a transition to El Nino (Nino 3.4 temperature anomaly reaching and exceeding +0.5C). The Modoki model is confusing to me as I do not see it really showing the La Nina becoming more of a Modoki type before it fades away but it also does not suggest the formation of an El Nino. These are busy graphics as they show a lot of information from different runs of the SINTEX model. F2 means it is the newer version, not F1. The 3DVAR is the new feature where the temperature of the various depths of the oceans is incorporated into the model. “si” stands for their new sea ice model. What we are interested in is the mean of the various runs and the tighter the distribution the more confidence we would have with the result. The standard Nino 3.4 forecast looks good based on those criteria. The Modoki forecast is not as tight but you still can see what the overall pattern is.
JAMSTEC IOD Forecast
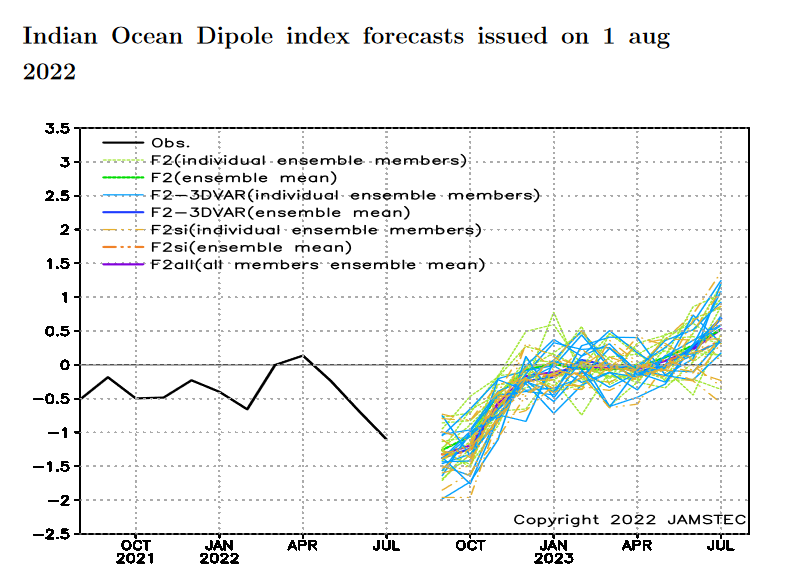
| .JAMSTEC is forecasting a brief IOD negative situation. You can see that on the graphic for August through October and maybe into November. This impacts mostly India and Australia but all nations that border the Indian Ocean. This article https://iaseasy.in/indian-ocean-dipole-positive-negative-and-neutral-iod/ provides some insight but was written when a positive IOD was expected and this is a negative IOD which is generally good for Australia but bad for India. It covers both positive and negative IOD’s. |
Where the IOD is measured and how the index is calculated
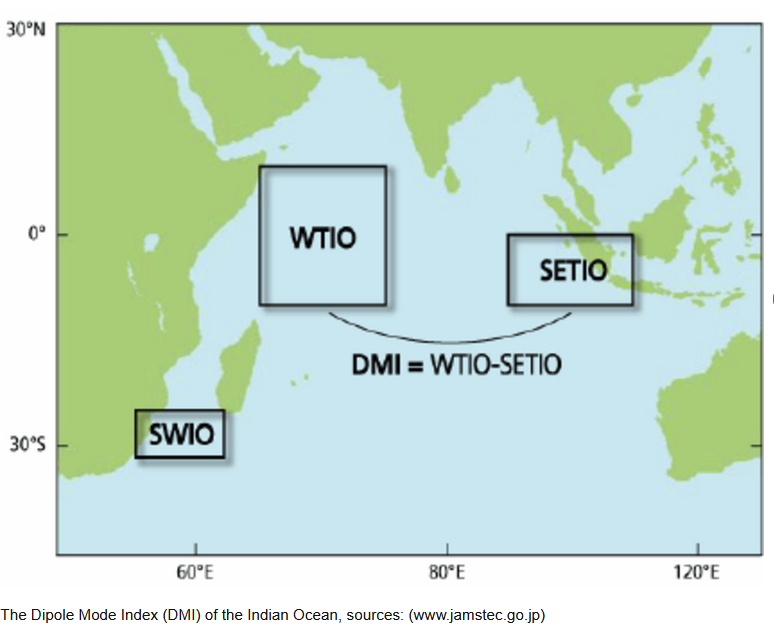
| The index is calculated as the monthly difference between the western (10°S-10°N, 50°-70°E) (WTIO) and eastern Indian Ocean (10°S-0°, 90°-108°E) (SETIO) sea surface temperature departures from average. |
Impact of the IOD on the Walker Circulation
This shows the Walker Circulation for IOD Negative which is predicted.
| It is important to understand the Walker Circulation pattern of where moisture is rising (from warm water) and later falls as precipitation. |
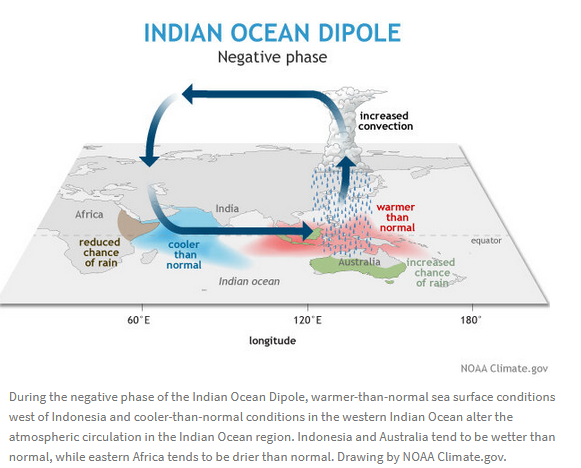
A negative IOD increases the chances of above-average winter and spring rainfall for much of Australia and a poor Monsoon for India. But I do not really seed a poor monsoon for India in the forecast maps.
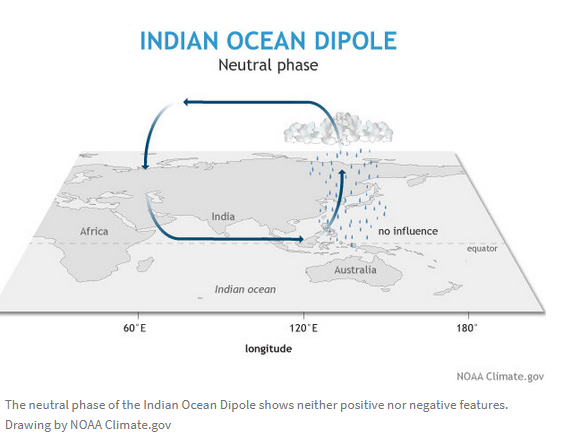
Here is IOD Neutral
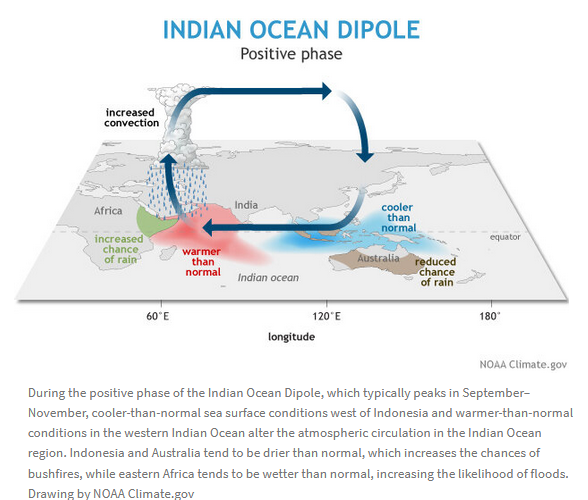
Here is IOD Positive
JAMSTEC Discussion accompanying the forecast maps
Here is the short JAMSTEC discussion I received on August 9 but believe to be based on the JAMSTEC August 1, 2022 ENSO forecast. Some of this was also shown with the forecast maps.
ENSO forecast:
Observation shows weakening of the La Niña-like state. The SINTEX-F predicts that the La Niña-like state will decay in boreal autumn, and then the tropical Pacific will return to a neutral-state in winter. The model predicts an occurrence of El Niño in the boreal spring of 2023.
Indian Ocean forecast:
The negative Indian Ocean Dipole continues to evolve. The SINTEX-F predicts that the negative Indian Ocean Dipole will further develop in boreal summer, mature in autumn, and then decay in winter. About 30% of ensemble members predict occurrence of an extreme negative Indian Ocean Dipole when the dipole index is below -1.5ºC.
Regional forecast:
On a seasonal scale, the SINTEX-F predicts that most parts of the globe will experience a warmer-than-normal condition in boreal autumn (austral spring), except for northern part of the South American Continent, southern Australia, northern Africa, East Africa, India, and some parts of Indochina and Indonesia. In boreal winter (austral summer), the model still predicts that most parts of the globe will experience a warmer-than-normal condition, except for northern part of the South American Continent, Australia, India, most parts of Indochina and Indonesia.
As regards to the seasonally averaged rainfall in boreal autumn (austral spring), a drier-than-normal condition is predicted for most parts of the U. S. A., La Plata, Chile, Sri Lanka, West/Central/East Africa, most part of Europe, some part of China, some part of the Eurasia, and some part of Indochina. In contrast, southern Alaska, most part of Canada, Central America, northern part of the South American Continent, eastern Australia, India, Northern Europe, some part of Eurasia, some part of Indochina, Philippine, and Indonesia will experience a wetter-than-normal condition. In particular, we notice that Indonesia and Australia (East Africa) may experience extremely wetter (drier) than normal conditions, owing to the strong negative Indian Ocean Dipole. In boreal winter (austral summer), a wetter-than-normal condition is predicted for western Canada, northern part of the South American Continent, Australia, southeastern Africa, Central Africa, Northern Europe, and Philippine. In contrast, most parts of the U.S.A., La Plata, East Africa, Sri Lanka, southern Indochina, Indonesia, some part of western Europe, East Asia will experience a drier-than-normal condition.
As regards to the seasonally averaged climate, the model predicts that most parts of Japan will experience a warmer and drier-than-normal condition in boreal autumn and winter.
I hope everyone has found this article to be useful and interesting. –