Here is what we are paying attention to this evening and the next 48 hours from this evening’s NWS Forecast.
...Monsoonal showers and storms will keep a slight risk of excessive
rainfall over parts of the central Rockies to the Four Corners region for
the next couple of days...

...A low pressure wave will likely bring heavy to excessive rainfall
across the mid to lower Mississippi Valley through Wednesday...

...A tropical low pressure system could bring additional heavy downpours
up the Rio Grande Valley into southwestern Texas through tonight into
Tuesday...

...A slight risk of severe thunderstorms is forecast for parts of the
Mid-Atlantic through this evening...

...Heat Advisories remain in effect for parts of the southern Plains/lower
Mississippi Valley into this evening as heat intensifies over the interior
West Coast over the next couple of days...

...A coastal storm could impact parts of New England later on Wednesday...
Continuation of the NWS Short Range Forecast (It is updated twice a day and these updates can be found here.
A front slowly dipping southward through the mid-South and down the East
Coast will be the focus of addition showers and thunderstorms.  As a low
pressure wave over the central Plains interacts with the front, the chance
of heavy rain will increase across Iowa into Missouri tonight before
spreading southward through Missouri on Tuesday where areas of flooding
will be possible.  By Wednesday, the mid-Mississippi and Tennessee Valleys
will likely see heavy rain, which will spread into the interior Gulf Coast
states later that day as the low pressure wave continues to dip to the
south.

Meanwhile, tropical downpours associated with a tropical low pressure
system is moving across southern Texas and into the lower Rio Grande
Valley.  As the center of tropical low appears to continue tracking
west-northwest not far from the Texas-Mexican border, additional heavy
rain could spread further up the Rio Grande Valley tonight and into
western Texas on Tuesday.  Meanwhile, monsoonal showers and thunderstorms
are expected to continue from the central Rockies into the Four Corners
region, where a slight risk of excessive rainfall is forecast for the next
couple of days.  The tropical moisture from the tropical low could cross
the southern borders of New Mexico and Arizona on Wednesday to raise the
threat of excessive rainfall there.  Farther north, the threat of heavy
rain is forecast to slowly decrease as drier air filters in behind a cold
front.

Farther east, showers and thunderstorms along the eastern extent of the
front could become severe over parts of the Mid-Atlantic through tonight.

Meanwhile, upper-level ridging over the central Plains will contribute to
more heat for the next couple of days.  The hottest temperatures into the
lower 100's are forecast to shift southward further into the southern
Plains as the aforementioned low pressure wave pushes southward.
Meanwhile, upper-level ridging will build into the Great Basin on Tuesday,
allowing temperatures to rise into the mid-to-upper hundreds over interior
California, prompting heat advisories and excessive heat warnings to be
issued for the Sacramento and San Joaquin Valleys, as well as the parts of
the interior Pacific Northwest.

Last but not least, a coastal storm could intensify quickly on Wednesday
off the New England coast.  There is still quite a bit of uncertainty
regarding the intensity and track of this cyclone.  Potential exists for
parts of New England to witness increasing wind and rain later on
Wednesday should the storm intensify rapidly and track closer toward New
England.  It appears Maine will be the likeliest location of seeing
impacts from this storm.
Maps that relate the forecast to geography can be found by clicking Here for Day 1 and Here for Day 2.
Here is a 60-hour animated forecast map that shows how the short-term forecast is expected to play out.

If it needs to be updated click her e.
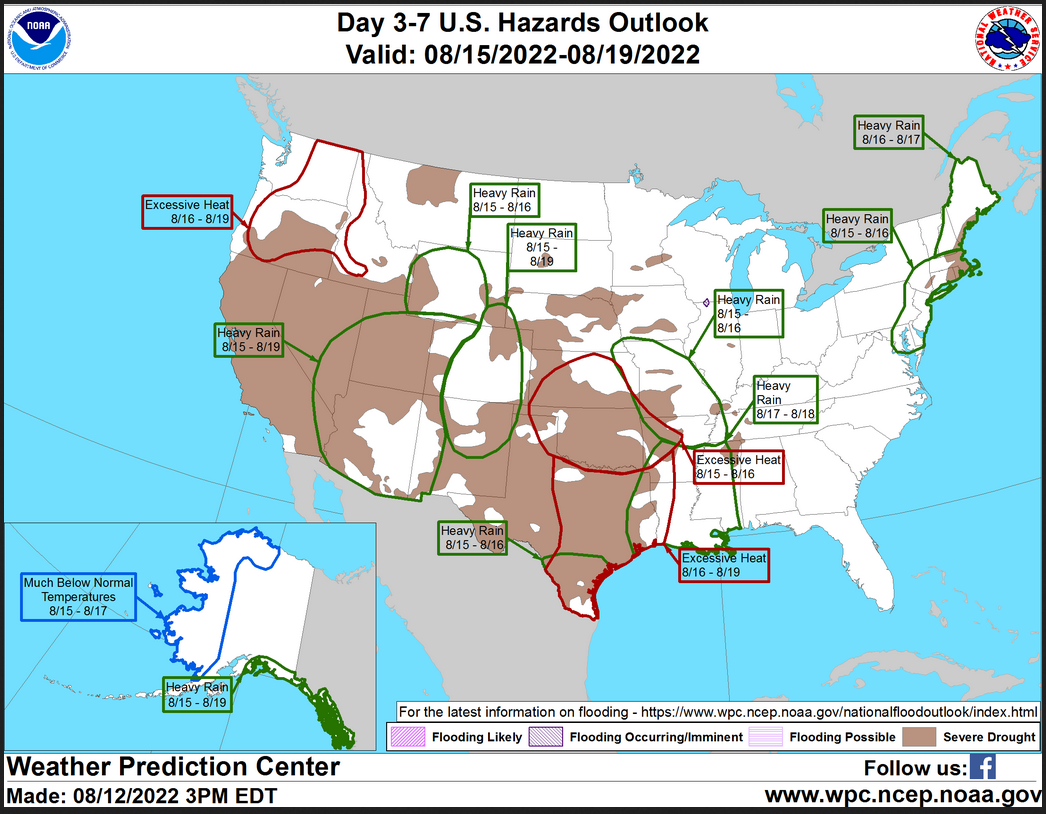
HAZARDS OUTLOOKS
Click here for the latest complete Day 3 -7 Hazards forecast which updates only on weekdays. Once a week probably Monday or Tuesday I will update the images. I provided the link for readers to get daily updates on weekdays. Use your own judgment to decide if you need to update these images.
Worldwide Tropical Forecast

(This graphic updates on Tuesdays) If it has not been updated, you can get the update by clicking he re
Detailed Maps and Reports for the Western Atlantic and the Pacific Oceans
Below are three maps that summarize the situation for the Atlantic, Eastern and Central Pacific. Additional information can be accessed by clicking HERE
First the Atlantic
Click to view the forecast map and have access to additional information https://www.nhc.noaa.gov/gtwo.php?basin=atlc&fdays=5
Then Eastern Pacific
Click to view the forecast map and have access to additional information https://www.nhc.noaa.gov/gtwo.php?basin=epac&fdays=5
Then Central Pacific
Click to view the forecast map and have access to additional information https://www.nhc.noaa.gov/gtwo.php?basin=cpac&fdays=5
And the Western Pacific
Click to view the forecast map and have access to additional information https://www.metoc.navy.mil/jtwc/jtwc.html
Some Intermediate-Term Outlooks
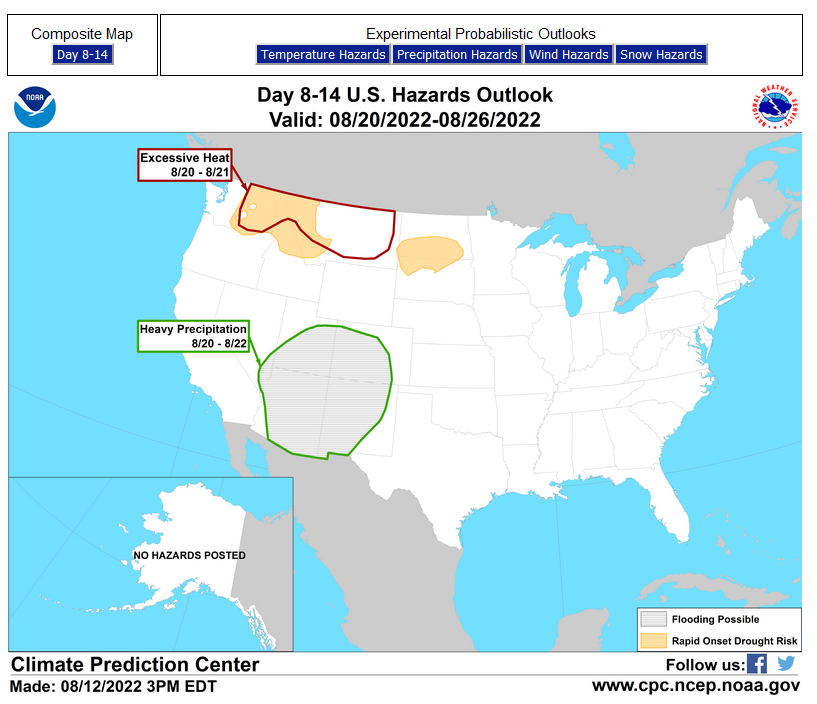
Links to “Outlook” maps and discussions for three time periods. Days 6 – 10, Days 8 – 14, and Weeks 3 and 4. An outlook differs from a forecast based on how NOAA uses these terms in that an “outlook” presents information from deviation from normal and the likelihood of these deviations.
You have to click on the links because they do not update automatically and I do not want to have stale images in the article. But it is not difficult to click on a link and you get a large image plus a discussion. On Fridays in a separate article, we will show the images and provide a link in this article that article. But remember what you will see is the images as of Friday. But here you can get the current images simply by clicking on them. Then hit the return arrow at the upper left of your screen to return to the article. You will not find this information easily anywhere else.

Right now you can find these maps here (We show them every Friday there but you can click above and find them).
World Forecast for Day 6 (Currently Set for Day 6 but the reader can change that)
World Weather Forecast produced by the Australian Bureau of Meteorology. Unfortunately, I do not know how to extract the control panel and embed it into my report so that you could use the tool within my report. But if you visit it Click Here and you will be able to use the tool to view temperature or many other things for THE WORLD. It can forecast out for a week. Pretty cool. Return to this report by using the “Back Arrow” usually found top left corner of your screen to the left of the URL Box. It may require hitting it a few times depending on how deep you are into the BOM tool. Below are the current worldwide precipitation and air pressure forecasts for six days out. They will not auto-update and right now are current for Day 6. If you want the forecast for a different day Click Here I will try to update this map each day but you have the link so you can access the dashboard and get a wide variety of forecasts.
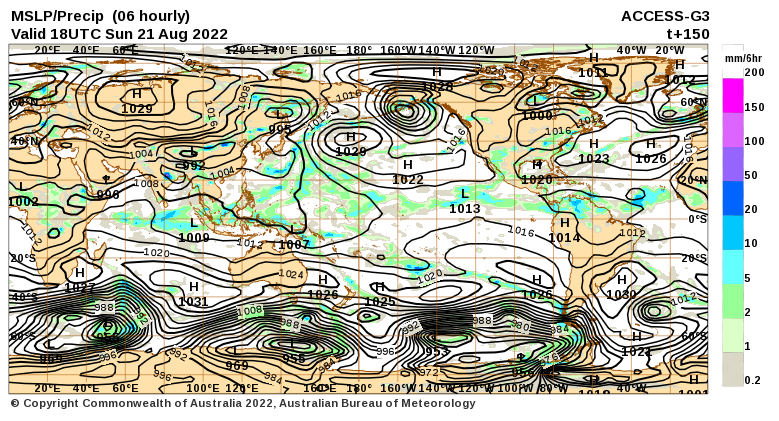 I mostly rely on the reader to interpret world maps. For this map, areas of expected precipitation for the date and time shown are clearly shown.
The number of High-Pressure systems shown is called the Wave Number. Maybe I will discuss WN someday. But it shows how many Rossby Waves there are around the World. Sometimes they are hard to count. Counting Low-Pressure systems should provide the same WN. Rossby Waves are the way the temperature distribution of the Planet remains in balance. It is basically the science of fluid dynamics. It can be very helpful in predicting the movement of weather patterns.
Month to Date Information
Month to date Temperature can be found at https://hprcc.unl.edu/products/maps/acis/MonthTDeptUS.png
Month to date Precipitation can be found at https://hprcc.unl.edu/products/maps/acis/MonthPNormUS.png