Northern Tier from Great Lakes West Predicted to be Hot and Dry
NOAA updates many of their weather outlooks and in many cases issues a discussion with those outlooks. On Fridays, they issue a week 3 – 4 outlook which is farther out than the typical 10-day forecast and the discussion is excellent. So we have decided to issue a weekly special report on Fridays.
When the Week 3-4 Outlook is issued, we have a 28-day view of the future. It is important to recognize that the forecasts do not always work out as predicted. But in the article, there are links to obtain updated forecasts. Since we are publishing this article on Sunday we only have a 26-day view of the future. Sorry about that.
We have also taken a look at the state temperature and precipitation rankings for July and Year to Date (YTD). It is not a surprise that they differ. We provided that information in a recent article but thought it useful to repeat it here for those who did not happen to read the other article. There is value in relating the future outlook to the prior month and to the YTD.

| Announcement: We now publish a daily weather report that addresses both short-term and intermediate-term weather issues including tropical events and you can find it at econcurrents.com. To return to this article just hit the return arrow at the upper left corner on your screen. This message is mainly for future reference as this article covers most of what you need to know other than tropical events. I do not include those in this article as generally, it is not possible to predict them out to 28 days. The links to information on tropical events are in the Daily Report. |
What NOAA is predicting for the next 28 days.

We will start with the short-term – It is up to date as of today. If you look at this article after today you can click the links to update (plus you will end up with a lot of additional information)
| Temperature (Maximum Anomaly) for the next five days | Precipitation (Five days of cumulative precipitation) |
| https://www.wpc.ncep.noaa.gov/medr/me dr_mean.shtml | https://www.wpc.ncep.noaa.gov/qpf/day1-7.shtml |
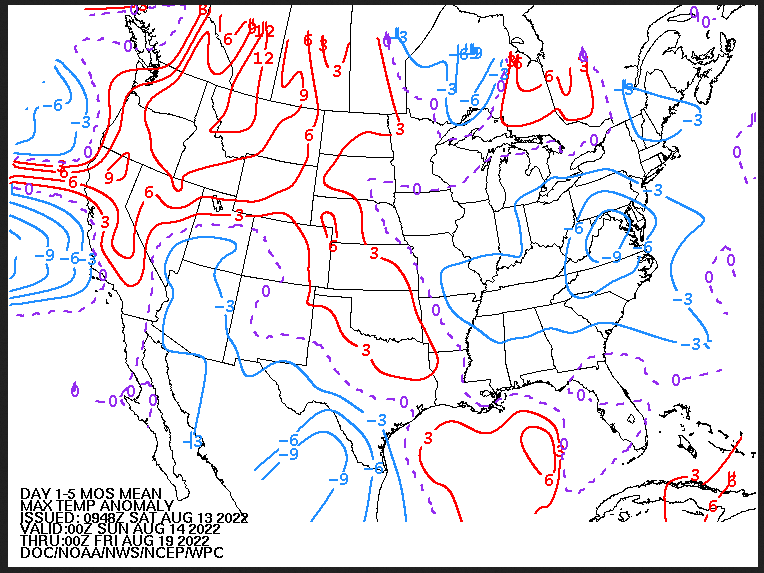
| Most of the warm temperature anomalies are in the Northwest. The cool anomalies center on Virginia. |
Now we look at “Outlook” maps for three time periods. Days 6 – 10, Days 8 – 14, and Weeks 3 and 4. An outlook differs from a forecast based on how NOAA uses these terms in that an “outlook” presents information as deviation from normal and the likelihood of these deviations.
I have provided the maps so you do not need to click to get them. But they do not update daily. But you can get the current images simply by clicking on the links provided. Then hit the return arrow at the upper left of your screen to return to the article. There is no need to do that right away since what is published today is up to date.
Below are the links to obtain updates and additional information.
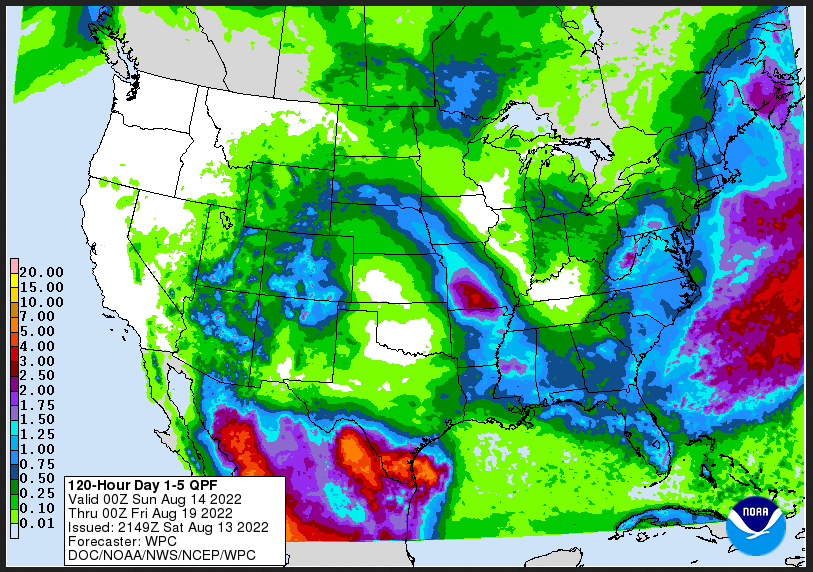
| The Monsoon is focused on Four Corners and extends to the East Coast. The Northern Tier focused on Montana is dry. |
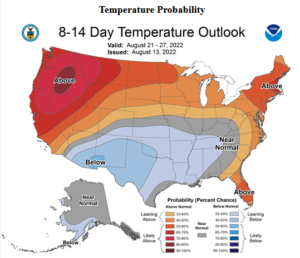
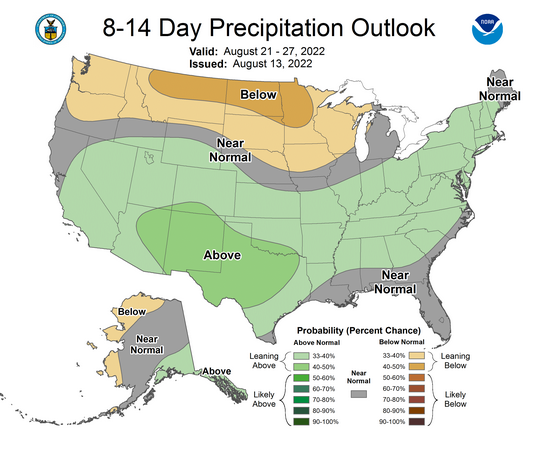
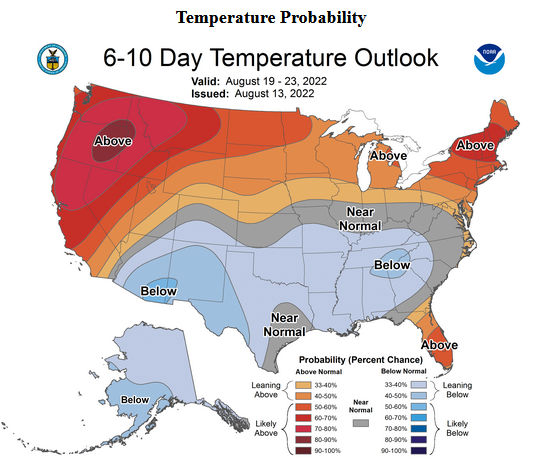
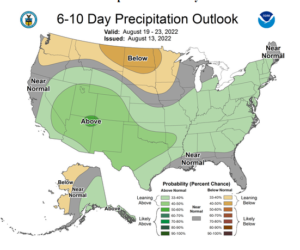
| North/South Divide for Temperature and Precipitation. |
Now we address Weeks 3 and 4. This is a time frame that is very important. It is half of the 28-Day forecast period. That is why we include the discussion that accompanies the maps.
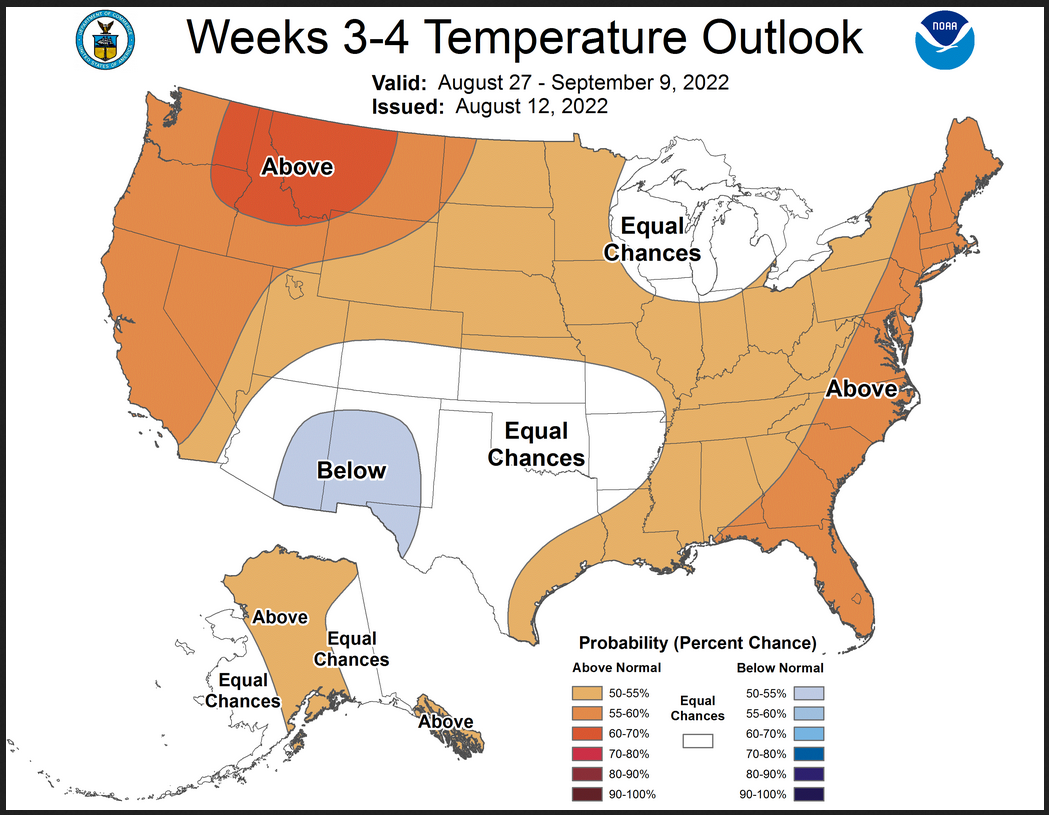
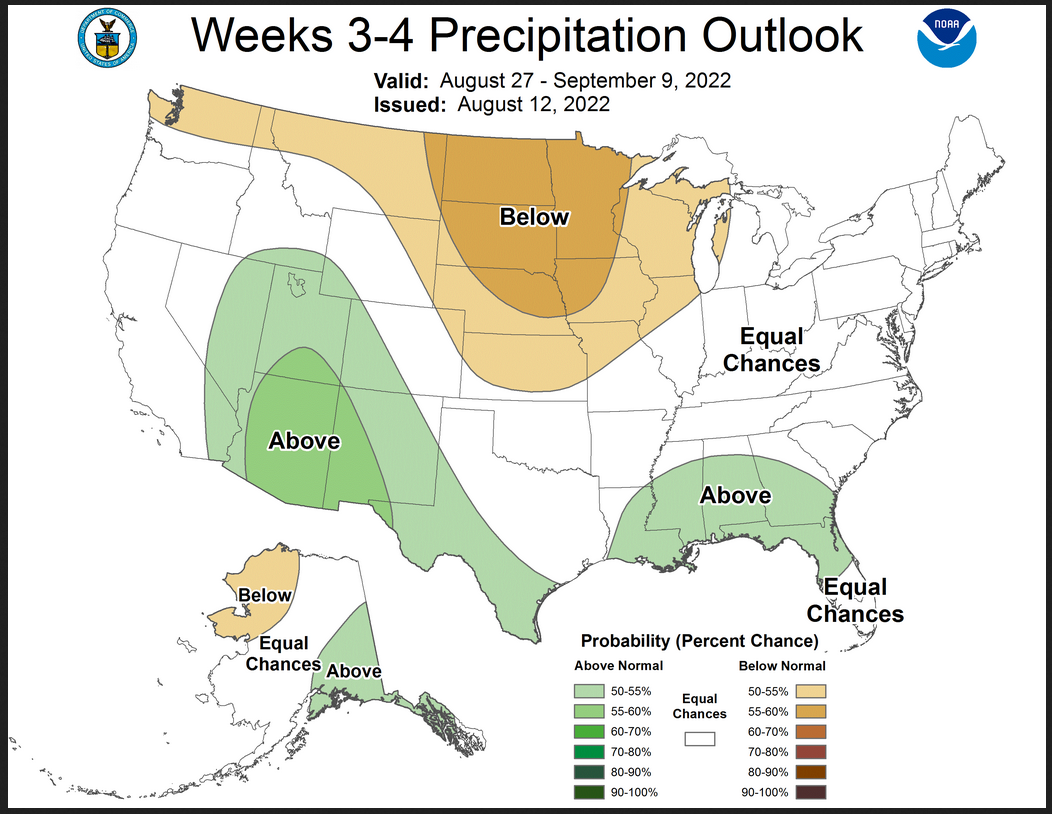
Prognostic Discussion for Week 3-4 Temperature and Experimental Precipitation Outlooks
NWS Climate Prediction Center College Park MD
300PM EDT Fri Aug 12 2022
Week 3-4 Forecast Discussion Valid Sat Aug 27 2022-Fri Sep 09 2022
Dynamical model forecasts of the Realtime Multivariate Madden Julian Oscillation (RMM) index were mixed at the beginning of the week, with forecasts from the Climate Forecast System version 2 (CFSv2) and Bureau of Meteorology (BOM) indicating weak but coherent eastward propagation in mid-August. However, more recent forecasts from the Global Ensemble Forecast System version 12 (GEFSv12) remain within the unit circle with uncertainty into the week 3-4 period. The active La Niña has more influence on the Week 3-4 temperature and precipitation Outlooks than the Madden Julian Oscillation (MJO). Antecedent soil moisture conditions, dynamical model forecasts of week 3-4 500-hPa heights, temperature, and precipitation, persistence from week 2 forecasts, as well as dynamical model trends are considered in addition to potential La Niña impacts.
Predictions of anomalous 500-hPa heights from the European Centre for Medium-Range Weather Forecasts (ECMWF) and the 4-member CFSv2 models for the week 3-4 period depict troughing over the western coast of Alaska and parts of the Aleutians. The GEFSv12 model favors neutral 500-hPa anomalies for the mean week 3-4 period, but depicts troughing in week 3 that diminishes by week 4. Persisting from week 2 forecasts, dynamical models generally agree on ridging over the northern contiguous United States (CONUS). The ECMWF and GEFSv12 models forecast a region of stronger positive 500-hPa anomalies over the Northwest. The 4-member CFSv2 500 hPa height forecast is an outlier and depicts troughing over the Great Lakes. 500-hPa heights are forecast to be near normal over the southern CONUS.
Consistent with the forecasted ridging over the northern CONUS, particularly over the Northwest, enhanced above normal temperature probabilities are forecast for the region stretching from the western CONUS to the Great Lakes. Probabilities of above normal temperature reaching 60-70 percent are indicated for eastern Washington and Oregon to Montana beneath strong anomalous ridging. Elevated probabilities of above normal temperature are also indicated for the Northeast and the Southeast, where decadal trends support a tilt toward above normal temperatures, along with consistent dynamical model forecasts. Weakly enhanced probabilities of below normal temperatures are favored for the Desert Southwest given dynamical model forecasts of a robust monsoon. Equal-chances (EC) for above- and below-normal temperatures are indicated for parts of the Southern Plains through parts of the Tennessee Valley where dynamical models showed conflicting signals. EC is also indicated over the Great Lakes due to anomalously cool Lake Superior temperatures and a weak height pattern. Over Alaska, EC is favored for the western part of the state and the Aleutians given forecasted inconsistent dynamical model temperature forecasts, as well as uncertainty in the location and timing of the forecasted troughing. Elevated probabilities of above normal temperature are indicated over central Alaska given dynamical model certainty, but EC is favored over the eastern parts of Alaska as increased probabilities for above normal precipitation are expected to moderate temperatures for this region.
Downstream of forecasted ridging over the northern CONUS along with regions of low soil moisture supports a tilt toward below median precipitation over the region stretching from Washington to the Great Lakes, and southward into the Central Plains. The highest probabilities are depicted over parts of the Northern Plains and Upper Mississippi Valley given model consistency amongst CFSv2, ECMWF, GEFSv12, and the Japan Meteorological Agency (JMA) model which favor below median precipitation. Models remain in agreement on robust and widespread monsoon over the Desert Southwest that reaches as far northward as parts of southern Idaho. Dynamical models also indicate weakly enhanced probabilities of above median precipitation over the Gulf States under neutral 500 hPa height anomalies and elevated soil moisture anomalies. This is in contrast to what might be expected during an active La Niña, which favors a tilt toward below normal probabilities over parts of the Ozarks, thus EC is maintained northward of the Gulf States. EC is also maintained over the East Coast where dynamical model signals are weak or inconsistent. Dynamical models generally agree on a tilt toward below median precipitation over northwestern Alaska associated with forecasted 500-hPa troughing, while models agree on above median precipitation over southeastern Mainland Alaska and parts of the Alaska Panhandle.
Above-average sea surface temperatures in the vicinity of Hawaii, as well as the Subseasonal Prediction Experiment (SubX) multi-model ensemble (MME) probabilistic temperature forecast favor above average temperatures over Hawaii during Week 3-4. The highest probabilities of above normal temperatures in the SubX MME are over northern parts of Hawaii. Below median precipitation is favored for Honolulu and Lihue given a tilt toward below normal probabilities in SubX models, but EC is favored over the remaining islands given inconsistent model signals.
| The extremes are shown on the maps and described in the text. |
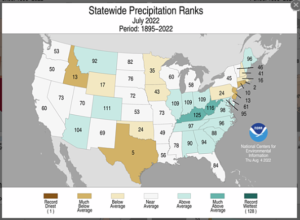
Looking back at July, 2022 and YTD.
The state rankings show where for each state, their July weather on the left and their year-to-date (YTD) weather on the right fits within their 128-year modern set of data which is considered the most reliable. They are color-coded to make them easier to read.
| July 2022 | Year to Date 2022 |
|
|
|
|
|
|
|
|
|
|
|
|
|
|
|
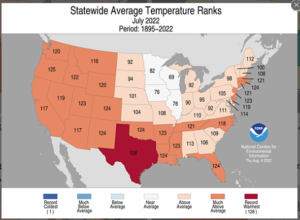
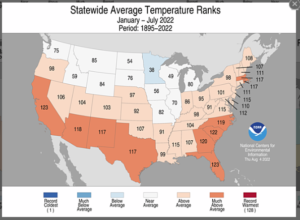
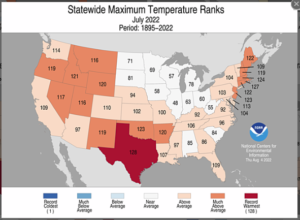
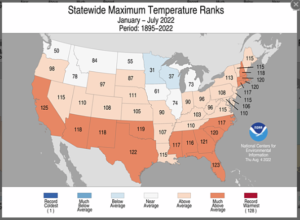
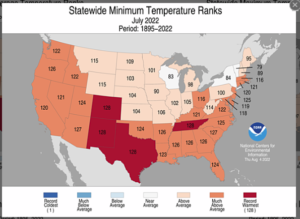
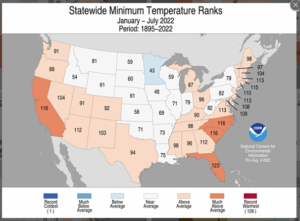
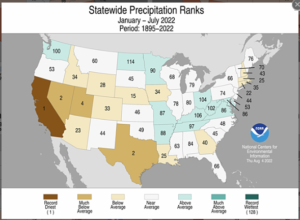
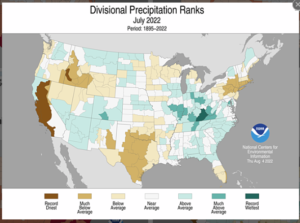
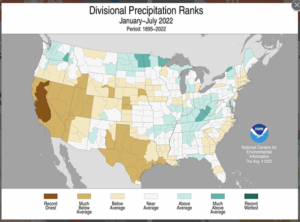
| The July minimum temperatures are interesting. Along the southern tier, these were among the warmest and for a few states the warmest in modern history. YTD, California has had the driest year in modern history. The Climate Division Maps provide more information with respect to where in each state the lows and highs were. |