Here is what we are paying attention to this evening and the next 48 hours from this evening’s NWS Forecast.
...Heavy rain and flash flooding threat continues from the Ohio Valley
into the Mid-Atlantic and along the Gulf Coast...

...Monsoonal storms and the potential for flooding to continue for
portions of the Southwest into the Great Basin and Rockies...

...Above-normal temperatures are expected from the northern Intermountain
West into the northern and central Plains, while much of the East begins
to cool down through late in the week...
Continuation of the NWS Short Range Forecast (It is updated twice a day and these updates can be found here.
A slow-moving surface front currently extends from the Mid-Atlantic
region, back through the Ohio Valley, and into the lower Mississippi
Valley and southern Plains.  As the front continues to sag slowly south
through the evening, very moist air ahead of the front will support
showers and thunderstorms capable of producing heavy rainfall.  This
potential for heavy rainfall includes areas in the Ohio Valley and central
Appalachians that have been recently impacted by very heavy rainfall
amounts and flooding.  Flood Watches have been posted and are expected to
remain in effect into this evening for areas stretching from central
Kentucky and eastern Tennessee into the Mid-Atlantic region.  Showers and
storms are forecast to continue across parts of the region into tomorrow
before a secondary cold front sweeps across the region by late in the
week.  In addition to drier weather, this front is expected to bring
seasonal to below-average temperatures into much of the eastern-third of
the Lower 48 by Friday.

However, it is expected to remain moist and unsettled along the Gulf Coast
over the next week days.  Ample moisture and weak winds are expected to
support slow-moving storms capable of producing heavy rain.  The threat is
forecast to continue through late in the week as the front settling in
from the north stalls across the region.

In the West, southerly winds sandwiched between low pressure positioned
off of the Pacific Northwest coast and high pressure anchored over the
Rockies and High Plains will support ample moisture spreading north from
the Southwest into portions of the Great Basin and Rockies.  This will
fuel daily shower and thunderstorm activity and the potential for
localized flooding.

Above-normal temperatures are forecast to persist from the northern
Intermountain West and northern Rockies, while the heat also builds east
out across the northern and central Plains through Friday.
Maps that relate the forecast to geography can be found by clicking Here for Day 1 and Here for Day 2.
Here is a 60-hour animated forecast map that shows how the short-term forecast is expected to play out.
If it needs to be updated click here.
HAZARDS OUTLOOKS
Click h ere for the latest complete Day 3 -7 Hazards forecast which updates only on weekdays. Once a week probably Monday or Tuesday I will update the images. I provided the link for readers to get daily updates on weekdays. Use your own judgment to decide if you need to update these images.


Worldwide Tropical Forecast

(This graphic updates on Tuesdays) If it has not been updated, you can get the update by clicking he re
Detailed Maps and Reports for the Western Atlantic and the Pacific Oceans
Below are three maps that summarize the situation for the Atlantic, Eastern and Central Pacific. Additional information can be accessed by clicking HERE
First the Atlantic
Click to view the forecast map and have access to additional information https://www.nhc.noaa.gov/gtwo.php?basin=atlc&fdays=5
Then Eastern Pacific
Click to view the forecast map and have access to additional information https://www.nhc.noaa.gov/gtwo.php?basin=epac&fdays=5
Then Central Pacific
Click to view the forecast map and have access to additional information https://www.nhc.noaa.gov/gtwo.php?basin=cpac&fdays=5
And the Western Pacific
Click to view the forecast map and have access to additional information https://www.metoc.navy.mil/jtwc/jtwc.html
Some Intermediate-Term Outlooks
Links to “Outlook” maps and discussions for three time periods. Days 6 – 10, Days 8 – 14, and Weeks 3 and 4. An outlook differs from a forecast based on how NOAA uses these terms in that an “outlook” presents information from deviation from normal and the likelihood of these deviations.
You have to click on the links because they do not update automatically and I do not want to have stale images in the article. But it is not difficult to click on a link and you get a large image plus a discussion. On Fridays in a separate article, we will show the images and provide a link in this article that article. But remember what you will see is the images as of Friday. But here you can get the current images simply by clicking on them. Then hit the return arrow at the upper left of your screen to return to the article. You will not find this information easily anywhere else.

Right now you can find these maps here (We show them every Friday there but you can click above and find them).
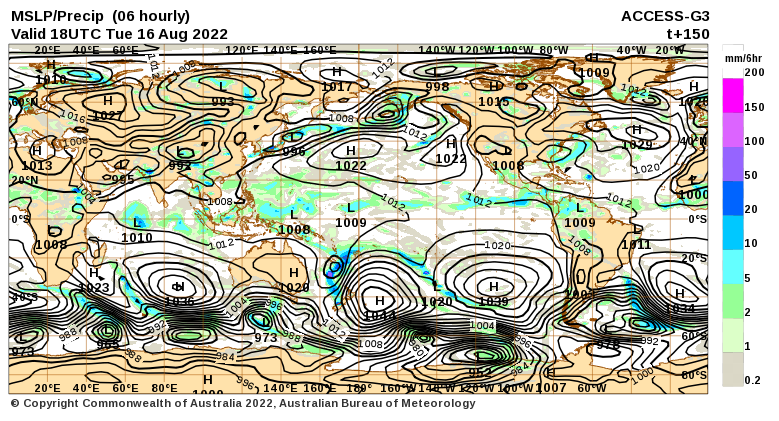
World Forecast for Day 6 (Currently Set for Day 6 but the reader can change that)
World Weather Forecast produced by the Australian Bureau of Meteorology. Unfortunately, I do not know how to extract the control panel and embed it into my report so that you could use the tool within my report. But if you visit it Clic k Here and you will be able to use the tool to view temperature or many other things for THE WORLD. It can forecast out for a week. Pretty cool. Return to this report by using the “Back Arrow” usually found top left corner of your screen to the left of the URL Box. It may require hitting it a few times depending on how deep you are into the BOM tool. Below are the current worldwide precipitation and air pressure forecasts for six days out. They will not auto-update and right now are current for Day 6. If you want the forecast for a different day Click Here I will try to update this map each day but you have the link so you can access the dashboard and get a wide variety of forecasts.
I mostly rely on the reader to interpret world maps. For this map, areas of expected precipitation for the date and time shown are clearly shown.
The number of High-Pressure systems shown is called the Wave Number. Maybe I will discuss WN someday. But it shows how many Rossby Waves there are around the World. Sometimes they are hard to count. Counting Low-Pressure systems should provide the same WN. Rossby Waves are the way the temperature distribution of the Planet remains in balance. It is basically the science of fluid dynamics. It can be very helpful in predicting the movement of weather patterns.
Month to Date Information
Month to date Temperature can be found at https://hprcc.unl.edu/products/maps/acis/MonthTDeptUS.png
Month to date Precipitation can be found at https://hprcc.unl.edu/products/maps/acis/MonthPNormUS.png