Here is what we are paying attention to this evening and the next 48 hours from this evening’s NWS Forecast.
...Heat to continue from the Northwest into the Plains, some relief by
Wednesday for the Northeast...

...Heavy Rain and Flash Flooding threat from the Ohio Valley into the
Central Appalachians...

...Monsoonal Showers to continue from the Southwest, portions of
California and into the Great Basin...
Continuation of the NWS Short Range Forecast (It is updated twice a day and these updates can be found here.
The last few days of "The Dog Days of Summer", the period from July 3rd to
August 11th, will be coming to an end this week.  For large parts of the
nation, no significant changes are on tap, while others will begin to see
some trends toward cooler temps.

Heat will continue to be in place over the next few days from the interior
Northwest, eastward across the Plains.  There is not expected to be any
record highs across these areas, but temperatures will remain above
average, with mid to upper 90s widespread.  The first signs of changes in
store for large portions of the nation from the Great Lakes to the east
coast begin Tuesday and Wednesday as a cold front begins to sink
southeastward across the Northern Plains into the Upper Mississippi Valley
and Upper Lakes region.  This front will eventually bring much cooler
temps to areas east of the Mississippi late week.  Prior to this, heat
will also continue into Tuesday across the east coast before a lead front
pushing southeastward across the Ohio Valley and Northeast brings somewhat
cooler temps by Wednesday.

The lead front pushing southeast through the Ohio Valley and Northeast
will be the focus for potentially heavy rains and flash flooding along and
ahead of this front into Wednesday.  This will especially so from portions
of the Mid Mississippi Valley, Ohio Valley into the Central Appalachians
which have seen much above average rain over the past few weeks, leading
to above average levels of soil moisture and elevated stream flows.
Additional heavy rains across these areas may lead to life-threatening
flash flooding conditions.

No big changes expected to the recent overall pattern across large
portions of the west.  A building mid to upper level high situated across
the Rockies will continue to pump much above average levels of moisture
northward on its western edge from the Southwest, portions of California,
northward through the Great Basin.  This will continue to support
widespread scattered monsoonal showers and thunderstorms across these
areas over the next few days.  Isolated flash flooding is possible across
these areas, especially over burn scars, slot canyons, dry river beds or
urban areas.

No changes expected also across the southeast quarter of the nation.  The
frontal boundary pressing into the Ohio Valley and Northeast will not make
any headway into the southeast quarter of the nation with humid conditions
prevailing.  Widespread showers and thunderstorms also possible with areas
of the Lower Mississippi Valley and Central Gulf Coast having the best
chances for heavy rains.  The clouds and rain across this area will also
keep high temperatures over the next few days slightly below average.
Maps that relate the forecast to geography can be found by clicking Here for Day 1 and Here for Day 2.
Here is a 60-hour animated forecast map that shows how the short-term forecast is expected to play out.
If it needs to be updated click here.
HAZARDS OUTLOOKS
Click h ere for the latest complete Day 3 -7 Hazards forecast which updates only on weekdays. Once a week probably Monday or Tuesday I will update the images. I provided the link for readers to get daily updates on weekdays. Use your own judgment to decide if you need to update these images.


Worldwide Tropical Forecast

(This graphic updates on Tuesdays) If it has not been updated, you can get the update by clicking here
Detailed Maps and Reports for the Western Atlantic and the Pacific Oceans
Below are three maps that summarize the situation for the Atlantic, Eastern and Central Pacific. Additional information can be accessed by clicking HERE
First the Atlantic
Click to view the forecast map and have access to additional information https://www.nhc.noaa.gov/gtwo.php?basin=atlc&fdays=5
Then Eastern Pacific
Click to view the forecast map and have access to additional information https://www.nhc.noaa.gov/gtwo.php?basin=epac&fdays=5
Then Central Pacific
Click to view the forecast map and have access to additional information https://www.nhc.noaa.gov/gtwo.php?basin=cpac&fdays=5
And the Western Pacific
Click to view the forecast map and have access to additional information https://www.metoc.navy.mil/jtwc/jtwc.html
Some Intermediate-Term Outlooks
Links to “Outlook” maps and discussions for three time periods. Days 6 – 10, Days 8 – 14, and Weeks 3 and 4. An outlook differs from a forecast based on how NOAA uses these terms in that an “outlook” presents information from deviation from normal and the likelihood of these deviations.
You have to click on the links because they do not update automatically and I do not want to have stale images in the article. But it is not difficult to click on a link and you get a large image plus a discussion. On Fridays in a separate article, we will show the images and provide a link in this article that article. But remember what you will see is the images as of Friday. But here you can get the current images simply by clicking on them. Then hit the return arrow at the upper left of your screen to return to the article. You will not find this information easily anywhere else.

Right now you can find these maps here (We show them every Friday there but you can click above and find them).
World Forecast for Day 6 (Currently Set for Day 6 but the reader can change that)
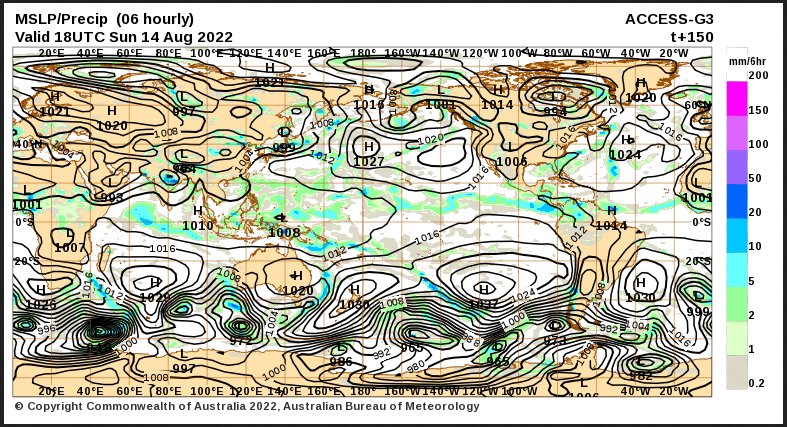
World Weather Forecast produced by the Australian Bureau of Meteorology. Unfortunately, I do not know how to extract the control panel and embed it into my report so that you could use the tool within my report. But if you visit it Clic k Here and you will be able to use the tool to view temperature or many other things for THE WORLD. It can forecast out for a week. Pretty cool. Return to this report by using the “Back Arrow” usually found top left corner of your screen to the left of the URL Box. It may require hitting it a few times depending on how deep you are into the BOM tool. Below are the current worldwide precipitation and air pressure forecasts for six days out. They will not auto-update and right now are current for Day 6. If you want the forecast for a different day Click Here I will try to update this map each day but you have the link so you can access the dashboard and get a wide variety of forecasts.
I mostly rely on the reader to interpret world maps. For this map, areas of expected precipitation for the date and time shown are clearly shown.
The number of High-Pressure systems shown is called the Wave Number. Maybe I will discuss WN someday. But it shows how many Rossby Waves there are around the World. Sometimes they are hard to count. Counting Low-Pressure systems should provide the same WN. Rossby Waves are the way the temperature distribution of the Planet remains in balance. It is basically the science of fluid dynamics. It can be very helpful in predicting the movement of weather patterns.
Month to Date Information
Month to date Temperature can be found at https://hprcc.unl.edu/products/maps/acis/MonthTDeptUS.png
Month to date Precipitation can be found at https://hprcc.unl.edu/products/maps/acis/MonthPNormUS.png