Here is what we are paying attention to this evening and the next 48 hours from this evening’s NWS Forecast.
...Additional rounds of excessive rainfall across parts of the
Ohio/Tennessee Valleys are expected to trigger areas of flash flooding
today...

...Daily rounds of heavy downpours could cause flash flooding from Arizona
to the Mid-South region over the next few days...

...Excessive heat continues in the Pacific Northwest; hot and humid across
the Deep South; cool air over the Central Plains expected to shift
eastward...
Continuation of the NWS Short Range Forecast (It is updated twice a day and these updates can be found here.
Embedded shortwave energy moving from the Central Plains into the Ohio
Valley will be the driving force behind Flash flooding threats this
weekend. A surface front extending from the Central Plains to the
Northeast will be the focus for heavy rainfall leading to flash flooding
today. The heaviest rainfall is likely to occur over the panhandles of
Texas/Oklahoma, where a couple inches of rain may lead to flash flooding.
A moderate risk (level 3/4) is in effect for portions of that area, as
well as parts of West Virginia into eastern Kentucky. A multi-day precip
event over the Ohio Valley is responsible for the moderate risk over West
Virginia/Kentucky. A Slight Risk of severe thunderstorms is in effect for
parts of the Mid-Atlantic coast today as a lead shortwave trough spins
through the region this afternoon. Damaging wind gusts appear to be the
main threat from these storms. A cold pool develops to the north of the
Central Plains front today before migrating eastward on Saturday and
Sunday. High temperatures over parts of eastern Colorado and into Kansas
will be in the low-to-mid 70s today as a result.

A plume of Gulf moisture will interact with the now quasi-stationary front
over the Mid-South on Saturday, leading to heavy rainfall and more flash
flooding concerns for parts of the Central Plains and Middle Mississippi
Valley. This flash flooding threat shifts eastward into the Tennessee
Valley and Mid-Atlantic on Sunday as the aformentioned shortwave energy
arrives. Monsoonal moisture continues to advect into the Southwest,
leading to the threat of Flash flooding this weekend. Slight Risks of
excessive rainfall leading to flash flooding are in effect for this area
during this period.

An upper ridge will continue a record setting end to the month over
portions of the Pacific Northwest, as high temperatures are likely to be
in the 100s+ this weekend. Potentially record setting night time lows in
the upper 60s and 70s will lead to dangerous conditions. Excessive heat
warnings and heat advisories are in effect from the Pacific Northwest to
the Central Great Basin. Necessary precautions should be taken. Warm air
will shfit into the Northern Central Plains over the coming days as the
Pacific ridge moves eastward. A retrograding ridge shiting from the
western Atlantic into the Deep South will bring hot and humid conditions
to the region this weekend.
Maps that relate the forecast to geography can be found by clicking Here for Day 1 and Here for Day 2.
Here is a 60-hour animated forecast map that shows how the short-term forecast is expected to play out.
If it needs to be updated click here.
HAZARDS OUTLOOKS
Click here for the latest complete Day 3 -7 Hazards forecast which updates only on weekdays. Once a week probably Monday or Tuesday I will update the images. I provided the link for reads to get daily updates on weekdays. Use your own judgment to decide if you need to update these images.


Worldwide Tropical Forecast
(This graphic updates on Tuesdays) If it has not been updated, you can get the update by clicking he re
Detailed Maps and Reports for the Western Atlantic and the Pacific Oceans
Below are three maps that summarize the situation for the Atlantic, Eastern and Central Pacific. Additional information can be accessed by clicking HERE
First the Atlantic
Click to view the forecast map and have access to additional information https://www.nhc.noaa.gov/gtwo.php?basin=atlc&fdays=5
Then Eastern Pacific
Click to view the forecast map and have access to additional information https://www.nhc.noaa.gov/gtwo.php?basin=epac&fdays=5
Then Central Pacific
Click to view the forecast map and have access to additional information https://www.nhc.noaa.gov/gtwo.php?basin=cpac&fdays=5
And the Western Pacific
Click to view the forecast map and have access to additional information https://www.metoc.navy.mil/jtwc/jtwc.html
Some Intermediate-Term Outlooks
Links to “Outlook” maps and discussions for three time periods. Days 6 – 10, Days 8 – 14, and Weeks 3 and 4. An outlook differs from a forecast based on how NOAA uses these terms in that an “outlook” presents information from deviation from normal and the likelihood of these deviations.
You have to click on the links because they do not update automatically and I do not want to have stale images in the article. But it is not difficult to click on a link and you get a large image plus a discussion. On Fridays in a separate article, we will show the images and provide a link in this article that article. But remember what you will see is the images as of Friday. But here you can get the current images simply by clicking on them. Then hit the return arrow at the upper left of your screen to return to the article. You will not find this information easily anywhere else.

Right now you can find these maps here (We show them every Friday there but you can click above and find them).
Forecast for Day 6 (Currently Set for Day 6 but the reader can change that)
World Weather Forecast produced by the Australian Bureau of Meteorology. Unfortunately, I do not know how to extract the control panel and embed it into my report so that you could use the tool within my report. But if you visit it Click H ere and you will be able to use the tool to view temperature or many other things for THE WORLD. It can forecast out for a week. Pretty cool. Return to this report by using the “Back Arrow” usually found top left corner of your screen to the left of the URL Box. It may require hitting it a few times depending on how deep you are into the BOM tool. Below are the current worldwide precipitation and air pressure forecasts for six days out. They will not auto-update and right now are current for Day 6. If you want the forecast for a different day Click Here I will try to update this map each day but you have the link so you can access the dashboard and get a wide variety of forecasts.
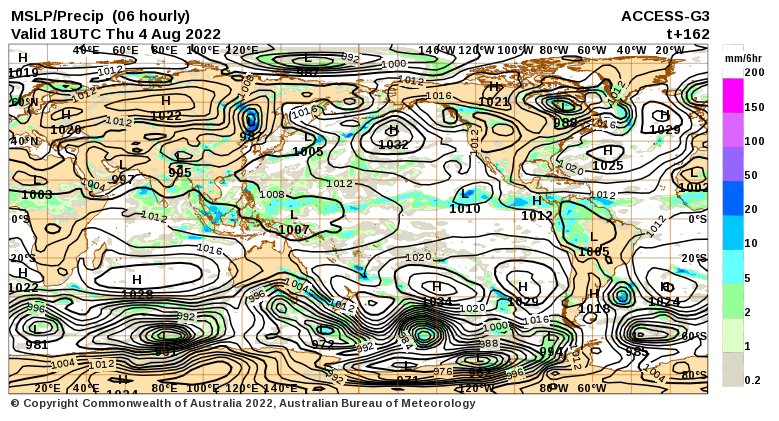 I mostly rely on the reader to interpret world maps. For this map, areas of expected precipitation for the date and time shown are clearly shown.
The number of High-Pressure systems shown is called the Wave Number. Maybe I will discuss WN someday. But it shows how many Rossby Waves there are around the World. Sometimes they are hard to count. Counting Low-Pressure systems should provide the same WN. Rossby Waves are the way the temperature distribution of the Planet remains in balance. It is basically the science of fluid dynamics. It can be very helpful in predicting the movement of weather patterns.
Month to Date Information
(These images do not auto-update – I update them from time to time, but the links are there so just click on them)
Temperature

Precipitation
Month to date Temperature can be found at https://hprcc.unl.edu/products/maps/acis/MonthTDeptUS.png
Month to date Precipitation can be found at https://hprcc.unl.e d u/products/maps/acis/MonthPNormUS.png