Here is what we are paying attention to this evening and the next 48 hours from this evening’s NWS Forecast.
...Moderate Risks of Excessive Rainfall are in place with areas of flash
flooding, potentially significant, across the Ohio Valley/Central
Appalachians through the end of the week...

...Monsoonal moisture to cause daily rounds of excessive rainfall and
flash flooding across portions of the Southwest and southern/central High
Plains with Slight to Moderate Risks of excessive rainfall...

...Heat wave to continue in the Pacific Northwest while staying
consistently hotter than normal over the southern Plains but heat is
forecast to increase along the East Coast...
Continuation of the NWS Short Range Forecast (It is updated twice a day and these updates can be found here.
A cool air mass dipping from central Canada toward the Great Lakes will
bring below normal temperatures across the northern tier and down as far
south as the central Plains for a change over the next few days.  On the
other hand, the arrival of the cool air will be accompanied with rounds of
strong to possibly thunderstorms along with areas of heavy rain from the
central Plains eastward, where the most active weather is expected to
persist between a pair of slow-moving fronts.  The area most susceptible
to heavy rain will likely be across the Tennessee Valley through Thursday
night.  Meanwhile to the south of the frontal boundaries, monsoonal
moisture is forecast to persist across the Four-corners region through the
next few days.  Day-time heating will continue to trigger scattered
thunderstorms across the region each day.  Some of the thunderstorms will
likely contain heavy downpours that could lead to flash flooding concerns
especially over burn scars.  Some of the monsoonal moisture is forecast to
spill northeastward and interact with the aforementioned slow-moving
fronts to trigger an area of heavy rain over portions of the central High
Plans Thursday night before edging east toward the central Plains on
Friday.  Flash flooding will be a concern should the heavy rain becomes
slow-moving under this weather pattern.

For the rest of the country, the heat will continue to be the story
especially over the Pacific Northwest where afternoon temperatures could
exceed 110 degrees at the hottest locations in the interior section on
Thursday and Friday.  Seattle and Portland metro areas will likely see
high temperatures reaching into the mid and upper 90s respectively over
the next couple of days.  Nights will be abnormally warm as well with
record high minimum temperatures possible.  Over the southern Plains, the
heat should be slightly less intense for the next couple of days as the
cool air mass from the north edges ever so slightly toward the region.
Farther east, heat and humidity is forecast to build along the East Coast
as a warm front lifts northward across the region and into New England by
Friday.  Hottest temperatures are forecast to be in the Carolinas where
upper 90s are expected for afternoon highs.
Maps that relate the forecast to geography can be found by clicking Here for Day 1 and Here for Day 2.
Here is a 60-hour animated forecast map that shows how the short-term forecast is expected to play out.

If it needs to be updated click here.
HAZARDS OUTLOOKS
Click here for the latest complete Day 3 -7 Hazards forecast which updates only on weekdays. Once a week probably Monday or Tuesday I will update the images. I provided the link for reads to get daily updates on weekdays. Use your own judgment to decide if you need to update these images.


Worldwide Tropical Forecast
(This graphic updates on Tuesdays) If it has not been updated, you can get the update by clicking he re
Detailed Maps and Reports for the Western Atlantic and the Pacific Oceans
Below are three maps that summarize the situation for the Atlantic, Eastern and Central Pacific. Additional information can be accessed by clicking HERE
First the Atlantic
Click to view the forecast map and have access to additional information https://www.nhc.noaa.gov/gtwo.php?basin=atlc&fdays=5
Then Eastern Pacific
Click to view the forecast map and have access to additional information https://www.nhc.noaa.gov/gtwo.php?basin=epac&fdays=5
Then Central Pacific
Click to view the forecast map and have access to additional information https://www.nhc.noaa.gov/gtwo.php?basin=cpac&fdays=5
And the Western Pacific
Click to view the forecast map and have access to additional information https://www.metoc.navy.mil/jtwc/jtwc.html
Some Intermediate-Term Outlooks
Links to “Outlook” maps and discussions for three time periods. Days 6 – 10, Days 8 – 14, and Weeks 3 and 4. An outlook differs from a forecast based on how NOAA uses these terms in that an “outlook” presents information from deviation from normal and the likelihood of these deviations.
You have to click on the links because they do not update automatically and I do not want to have stale images in the article. But it is not difficult to click on a link and you get a large image plus a discussion. On Fridays in a separate article, we will show the images and provide a link in this article that article. But remember what you will see is the images as of Friday. But here you can get the current images simply by clicking on them. Then hit the return arrow at the upper left of your screen to return to the article. You will not find this information easily anywhere else.

Right now you can find these maps here (We show them every Friday there but you can click above and find them).
Forecast for Day 6 (Currently Set for Day 6 but the reader can change that)
World Weather Forecast produced by the Australian Bureau of Meteorology. Unfortunately, I do not know how to extract the control panel and embed it into my report so that you could use the tool within my report. But if you visit it Click Here and you will be able to use the tool to view temperature or many other things for THE WORLD. It can forecast out for a week. Pretty cool. Return to this report by using the “Back Arrow” usually found top left corner of your screen to the left of the URL Box. It may require hitting it a few times depending on how deep you are into the BOM tool. Below are the current worldwide precipitation and air pressure forecasts for six days out. They will not auto-update and right now are current for Day 6. If you want the forecast for a different day Click Here I will try to update this map each day but you have the link so you can access the dashboard and get a wide variety of forecasts.
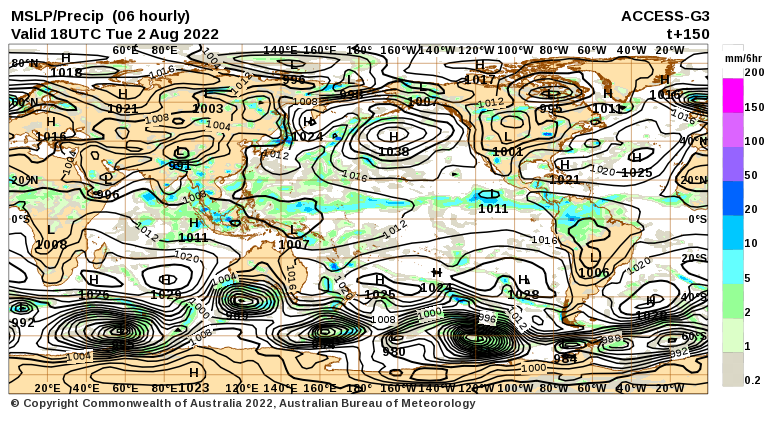 I mostly rely on the reader to interpret world maps. For this map, areas of expected precipitation for the date and time shown are clearly shown.
The number of High-Pressure systems shown is called the Wave Number. Maybe I will discuss WN someday. But it shows how many Rossby Waves there are around the World. Sometimes they are hard to count. Counting Low-Pressure systems should provide the same WN. Rossby Waves are the way the temperature distribution of the Planet remains in balance. It is basically the science of fluid dynamics. It can be very helpful in predicting the movement of weather patterns.
Month to Date Information
(These images do not auto-update – I update them from time to time, but the links are there so just click on them)
Temperature
Precipitation
Month to date Temperature can be found at https://hprcc.unl.edu/products/maps/acis/MonthTDeptUS.png
Month to date Precipitation can be found at https://hprcc.unl.e d u/products/maps/acis/MonthPNormUS.png