Preparing to Say Goodbye to La Nina, but Not Quite Yet
Today is the third Thursday of the month so right on schedule NOAA has issued what I describe as their Four-Season Outlook. The information released also includes the Early Outlook for the single month of August plus the weather and drought outlook for the next three months. I present the information issued and try to add context to it. It is quite a challenge for NOAA to address the subsequent month, the subsequent three-month period as well as successive three-month periods for a year or a bit more.
The three-month period Jan/Feb/Mar next year seems to be when the overall precipitation situation improves but for some reason the temperature situation does not and may be worse for several months along parts of the Southern Tier. You can take La Nina out of the forecast, but the warming trend continues. For many parts of CONUS, 2023 will be better than 2022. At least that is what NOAA is predicting right now.

| Announcement: We now publish a Daily weather report that includes a 48-hour forecast and links to weather outlook maps for an intermediate period of time. We also have a map of weather hazards for Week 1 and Week 2 which we update weekly and you can click on a link to get the latest version. On Fridays, we show the maps so that you do not have to click on links. Our intermediate-term outlook on Friday extends for 28 days. We also provide links to tropical conditions for the Western Atlantic, Gulf of Mexico, Eastern, Central and Western Pacific. There is a two-week forecast map for tropical activity worldwide. You can always find this report at Econcurents.com and over time there will be more and more interesting articles at that website. It makes it possible to access a lot of useful information without having to visit a number of different websites. |
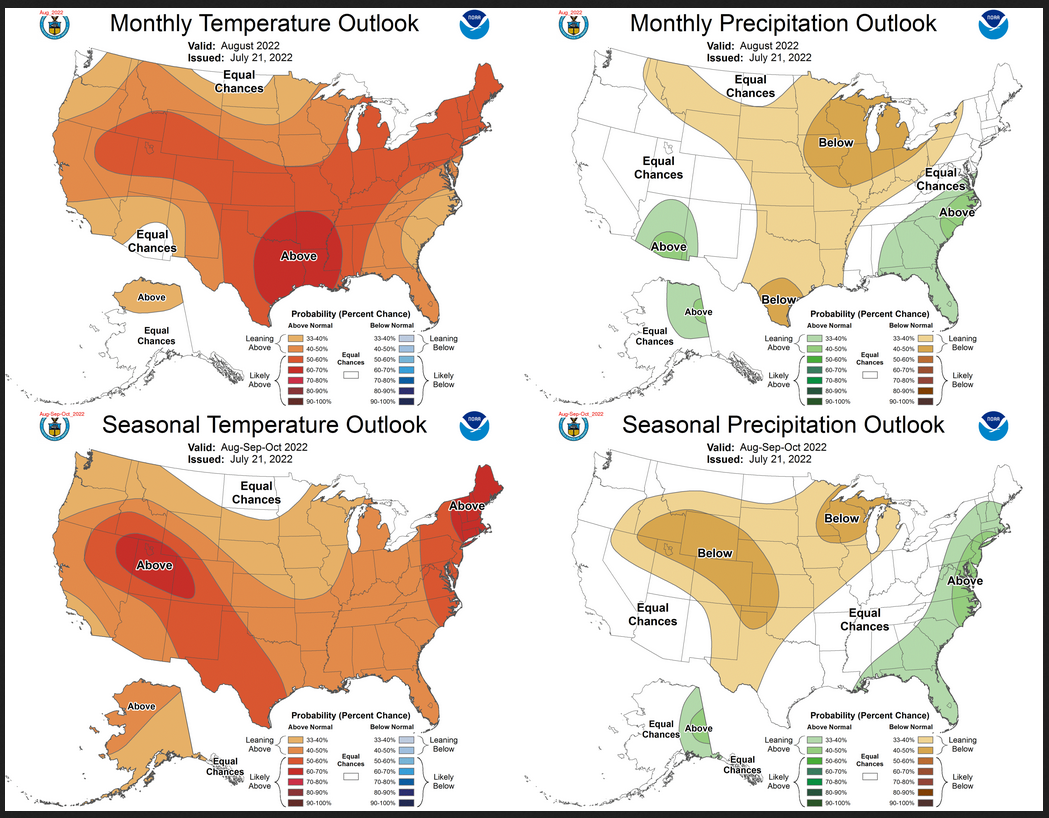
Combination Early Outlook for August and the Three-Month Outlook
| Notice that for temperature, the August and three-month outlooks are very similar. This suggests that the September/October outlook is also similar to both the August and the three-month outlook. It is almost the same situation for precipitation. But the Monsoon is stronger than normal in August but not for the three-month period. |
| For both temperature and precipitation, if you assume the colors in the maps are assigned correctly, it is a simple algebra equation to solve the month two/three anomaly probability for a given location = (3XThree-Month Probability – Month One Probability)/2*. So you can derive the month two/three outlook this way. You can do that calculation easily for where you live or for the entire map. |
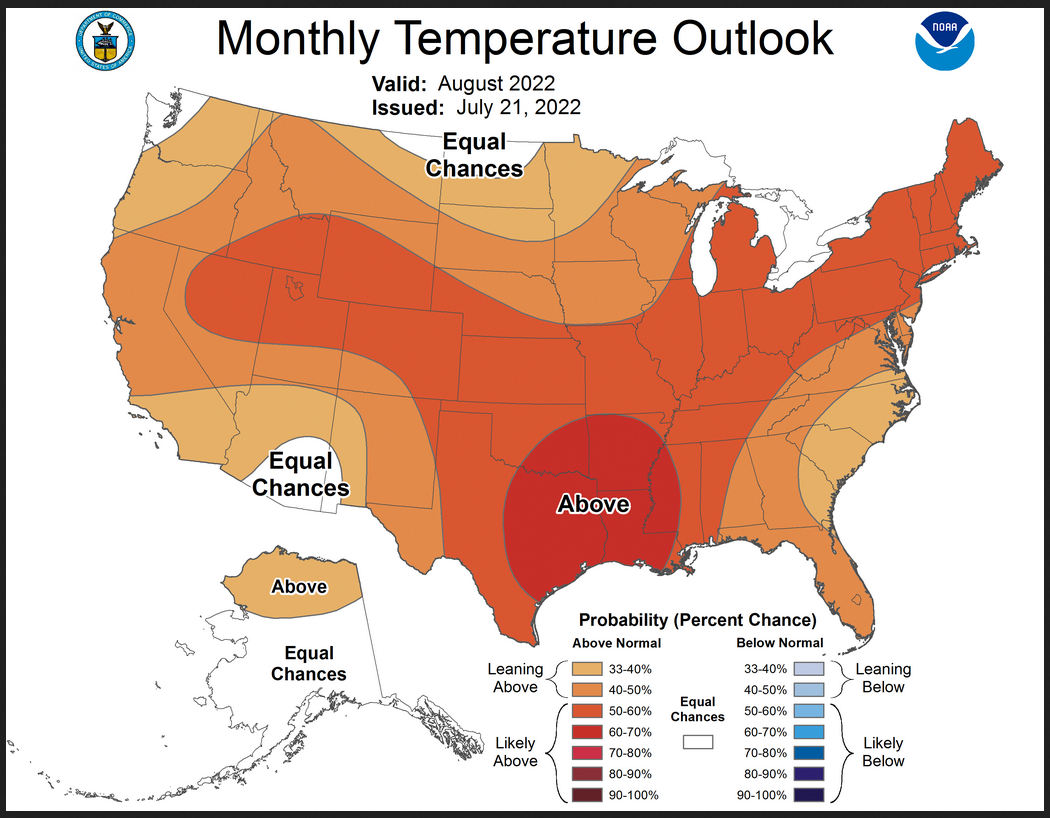
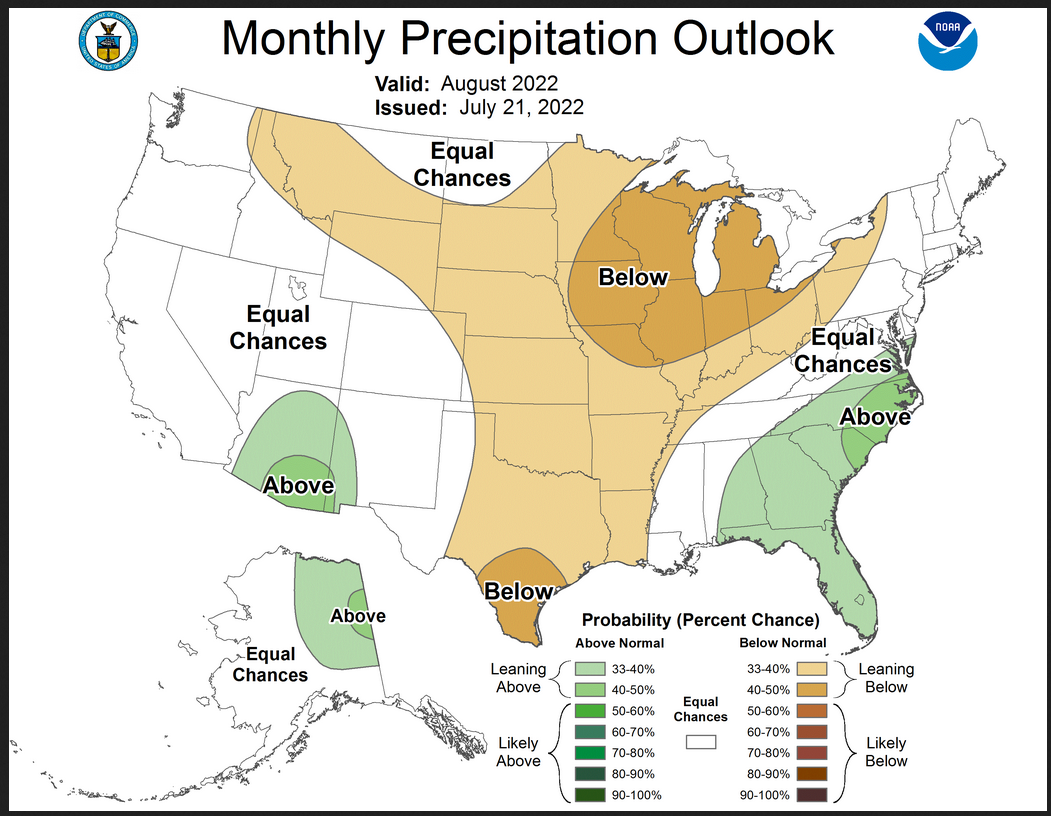
Here are larger versions of the Temperature and Precipitation outlook maps for the single month of August
The maps are pretty clear in terms of the outlook.
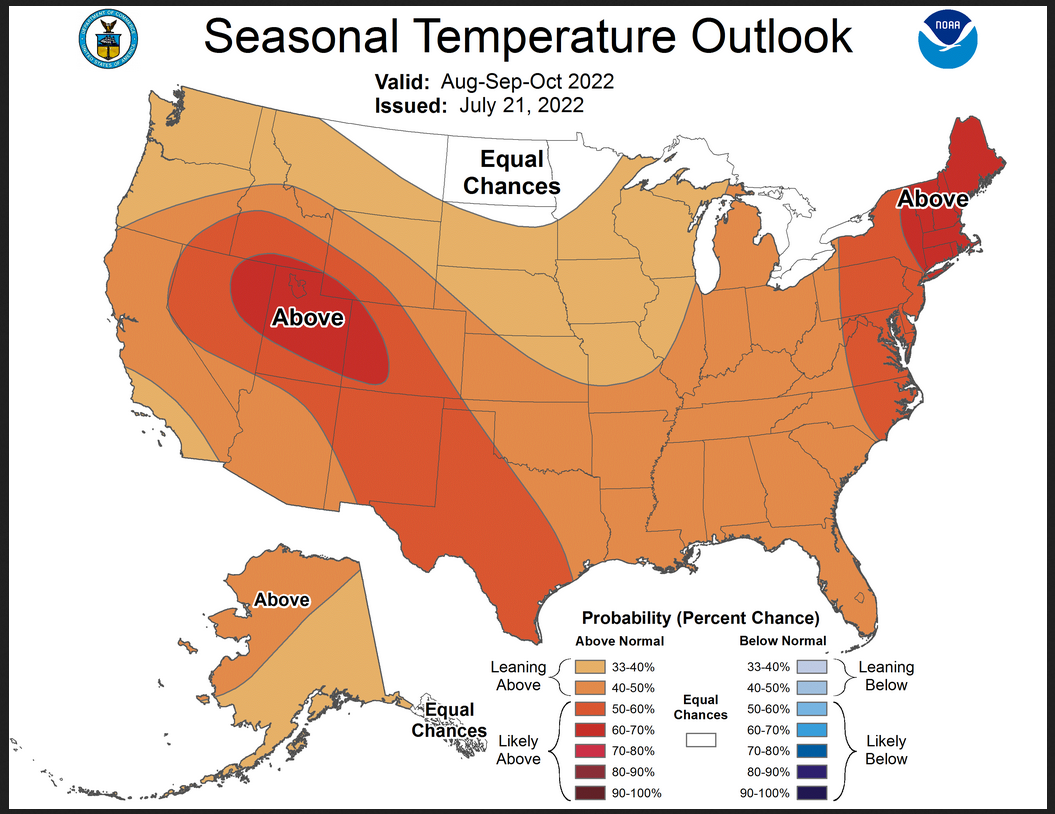
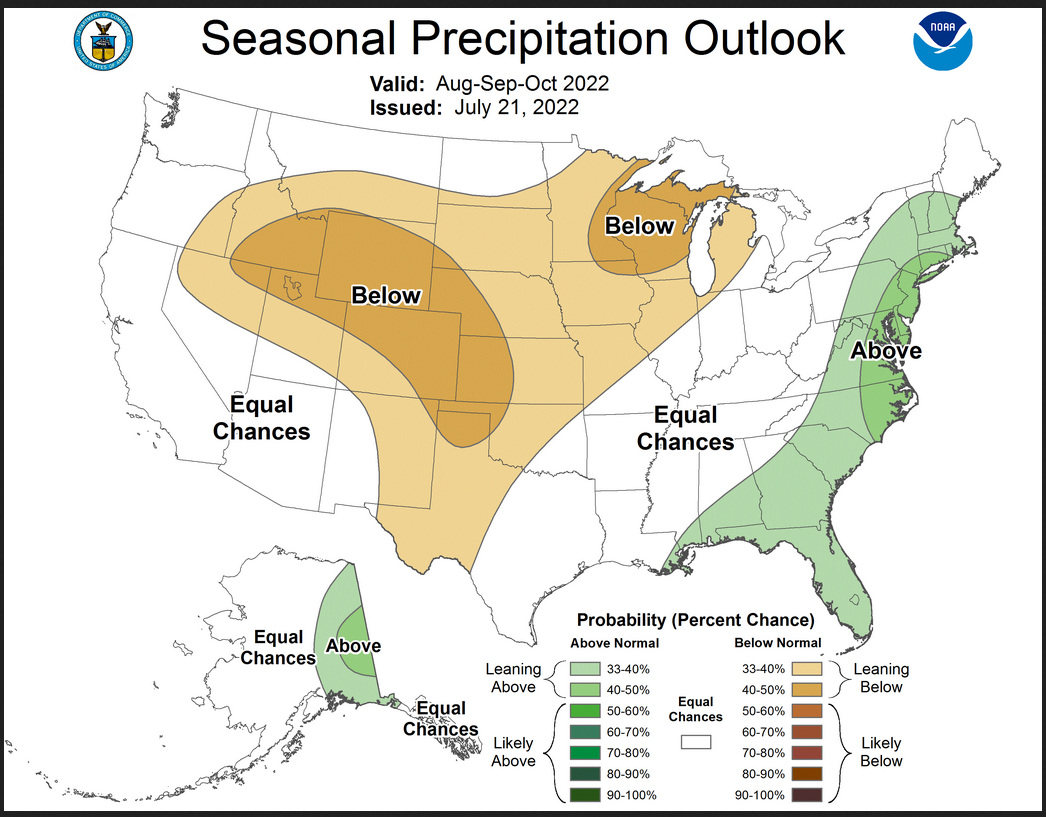
And here are large versions of the three-month ASO Outlook maps starting with temperature followed by precipitation.
The maps are larger versions of what was shown in the first graphic that had smaller versions of all four of these maps.
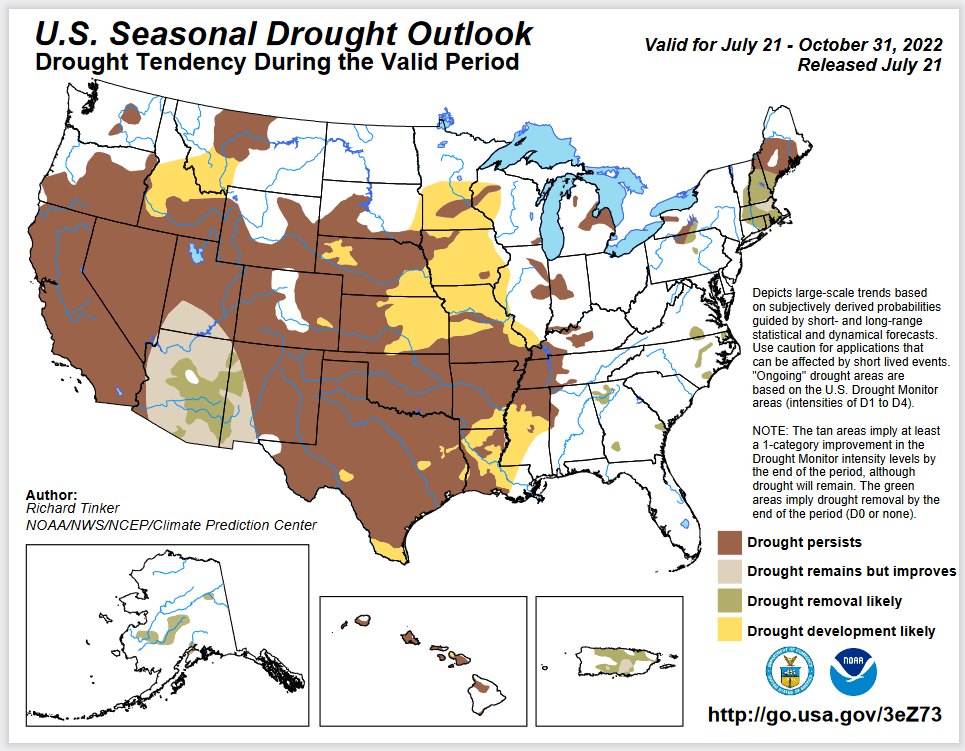
Drought Outlook
–
|
The yellow is the bad news. And this is a three-month outlook plus the remainder of July. There is quite a bit of yellow showing. Not good.
|
Looking out at Four Seasons.
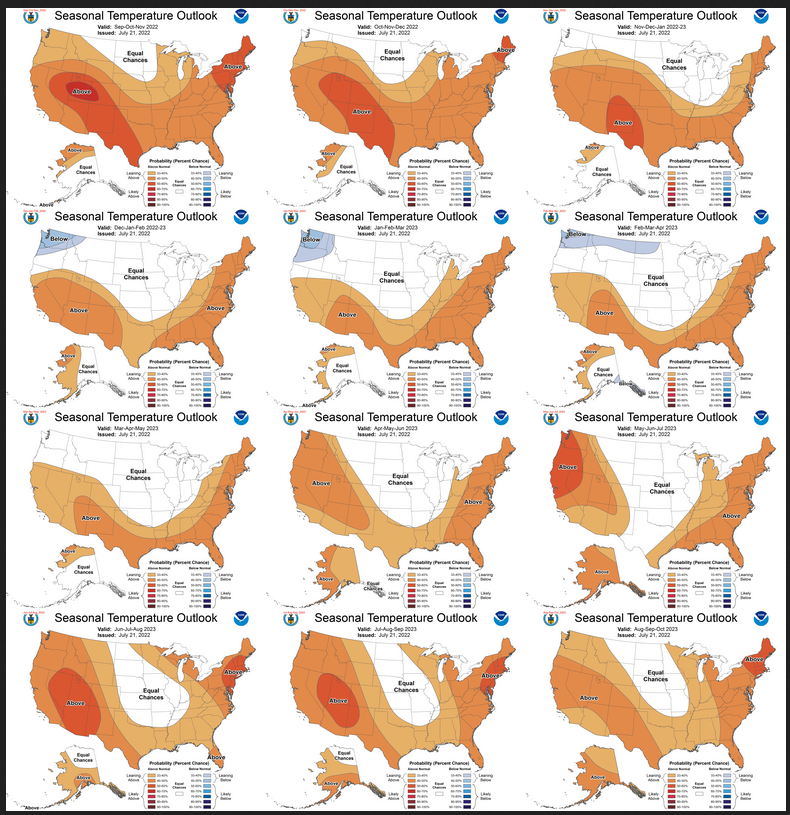
Twelve Temperature Maps
Notice that this presentation starts with September/October/November (SON) since ASO is considered the near-term and is covered earlier in the presentation. The changes over time are generally discussed in the discussion but you can see the changes easier in the maps.
|
|
|
| If you look closely you can see that DJF 2022/2023 the Southern Tier is shown warmer than it was shown last month. |
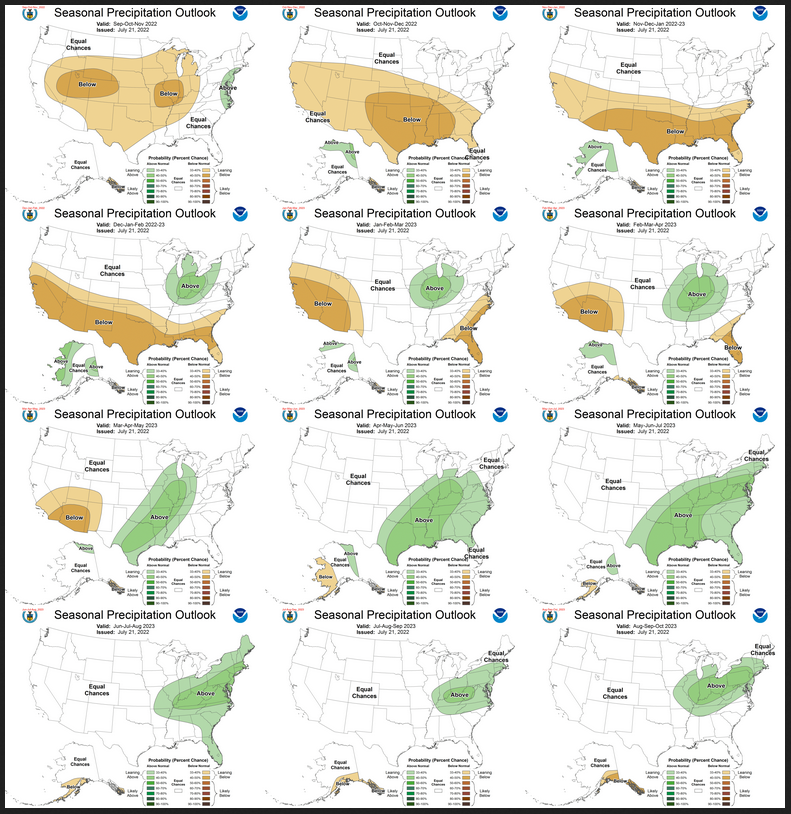
Twelve Precipitation Maps
Similar to Temperature in terms of the organization of the twelve overlapping three-month outlooks. The changes over time are generally discussed in the discussion but you can see the changes easier in the maps.
|
|
|
| If you look closely you can see that NDJ 2022/2023 and DJF 2022/2033 are drier along the Southern Tier than they were shown last month. But then things get wetter just as they were predicted last month. |
North American Monsoon (NAM)
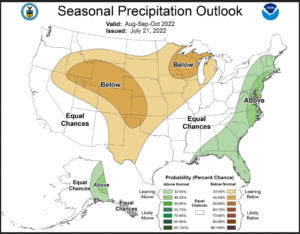
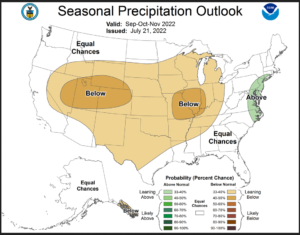
The ASO Outlook is shown earlier. But that does not extend through the Monsoon. So I am showing one additional Outlook Map that extends farther in time.
I am showing them side by side. On the left is ASO and on the right is SON
|
|
|
| You can see that in ASO the Monsoon has already withdrawn from Eastern New Mexico and for SON we are back in drought. Here is a pretty good write-up on the North American Monsoon. Click Here to read. |
NOAA Discussion
Maps tell a story but to really understand what is going you need to read the discussion. I combine the 30-day discussion with the long-term discussion and rearrange it a bit and add a few additional titles (where they are not all caps the titles are my additions). Readers may also wish to take a look at the article we published last week on the NOAA ENSO forecast. That can be accessed here.
I will use bold type to highlight some things that are especially important. My comments, if any, are enclosed in brackets [ ].
CURRENT ATMOSPHERIC AND OCEANIC CONDITIONS
Oceanic and atmospheric observations across the equatorial Pacific are consistent with the persistence of La Niña conditions. The observed weekly SSTs show negative anomalies across most of the central and eastern equatorial Pacific, with the largest negative anomalies of greater than -1 degree C generally near the Date Line and over the far eastern Pacific near the coast of South America. Negative SST anomalies have weakened to near zero near the equator over the eastern Pacific from about 100 to 150 W longitude since early June. Subsurface temperature anomalies remain positive at depths of about 100 to 200 meters to the west of the Date Line, with negative temperature anomalies emerging from the surface to more than 50 meters depth over the central Pacific, as well as the far eastern Pacific. Low-level easterly and upper-level westerly wind anomalies persisted from June into July. Suppressed convection continues near the Date Line, primarily south of the equator, with enhanced convection over parts of the Maritime Continent. Positive SST anomalies remain near the south coast of Alaska and along most of the east coast of the contiguous U.S. (CONUS), potentially influencing local climate conditions.
PROGNOSTIC DISCUSSION OF SST FORECASTS
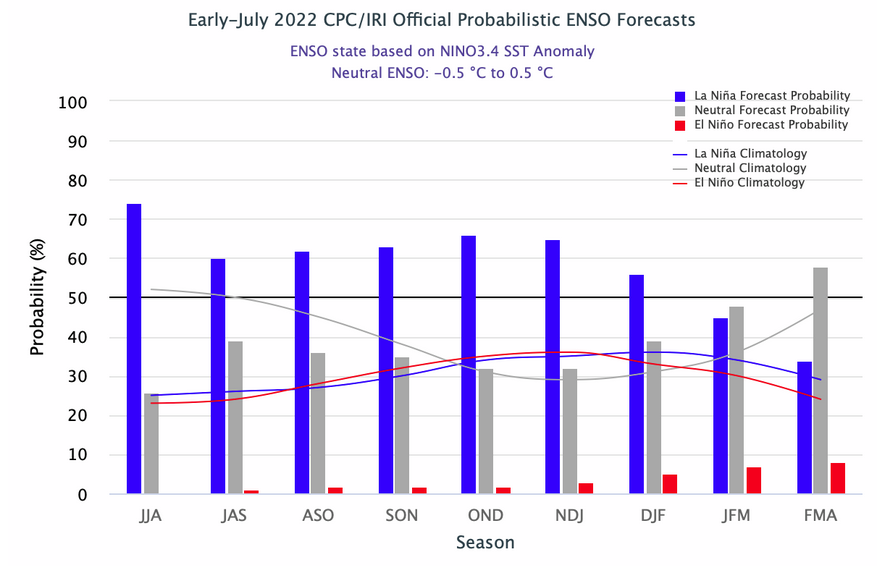
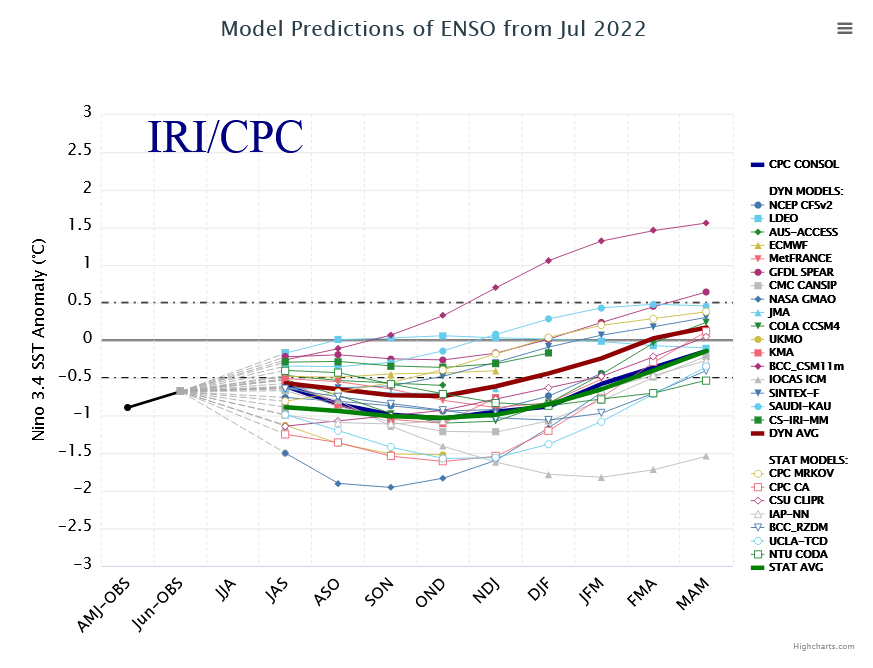
The CPC SST Consolidation for the Niño 3.4 region indicates a slight decrease in the magnitude of the negative anomalies this summer, followed by increasingly negative anomalies peaking around -1.0 degrees C during the autumn. The spread among ensemble members of the North America Multi-Model Ensemble (NMME) for the Nino 3.4 forecast for autumn ranges from a strong La Niña with anomalies around -1.5 C to near zero anomalies. Niño 3.4 forecasts by statistical tools range from anomalies exceeding -1.5 C for the Constructed Analog (CA) to about 0 C for the Canonical Correlation Analysis (CCA). The NMME maintains a La Niña with negative anomalies averaged for the Niño 3.4 region at or below -0.5 degrees C persisting through JFM 2023. As of early July, the CPC/IRI consensus forecast has increased the probability of a persisting La Niña through the JAS and ASO seasons to over 60 percent, with increasing probabilities of La Niña into autumn and early winter, reaching 66 percent in OND.
30-DAY OUTLOOK DISCUSSION FOR AUGUST 2022
The August 2022 Temperature and Precipitation Outlooks reflect current active La Niña conditions, the latest statistical and dynamical model guidance, impacts from decadal trends , antecedent soil moisture, and local sea surface temperature (SST) anomalies. Following a period of weakened below-average SSTs across most of the equatorial Pacific Ocean, recent negative SST anomalies in the central Pacific have strengthened. The latest weekly SST anomalies in the Niño 3.4 region reached -0.6C, and an extratropical response consistent with August La Niña events is anticipated. Impacts from La Niña on August temperature probabilities may be expected over southern Alaska and parts of the Pacific Northwest, and weak impacts may be expected on Western U.S. precipitation. Recent observations show that the Madden Julian Oscillation (MJO) has stalled over the Maritime Continent due to destructive interference from the ongoing La Niña, though dynamical model Realtime Multivariate MJO (RMM) forecasts show potential for a more coherent MJO emerging over the Western Hemisphere through the next two weeks. However, the MJO forecast is uncertain into August, thus the MJO did not play a strong role in the August 2022 Outlook.
Temperature
Available statistical and dynamical model guidance generally favor enhanced above normal temperature probabilities over most of the contiguous U.S. (CONUS). Monthly 200-hPa height forecasts from the North American Multi-Model Ensemble (NMME) as well as recent Week 3-4 dynamical model forecasts of 500-hPa heights favor widespread ridging over the CONUS, with stronger anomalous ridging predicted over the northern CONUS. In addition, anomalously low soil moisture in parts of the southern and central CONUS are expected to strengthen above normal temperatures. The area of highest above normal temperature probabilities are over eastern portions of the Southern Plains as well as much of the Lower Mississippi Valley (60-70 percent), where there is agreement among the Statistical Consolidation, NMME, Copernicus Climate Change Service multi-model ensemble (C3S), recent Climate System Forecast version 2 (CFSv2) temperature forecasts, and anomalously dry soil moisture conditions. Elevated probabilities of above normal temperatures (50-60 percent) are indicated for much of the central CONUS related to dry soil moisture anomalies, and considering recent CFSv2 forecasts which depict strong probabilities of above normal temperatures. Enhanced above normal temperature probabilities stretch over parts of the Great Lakes and Ohio River Valley due to forecasted stronger anomalous ridging in early August, as well as favored below normal precipitation. Elevated probabilities of above normal temperatures (50-60 percent) are also indicated for New England owing to decadal trends and anomalously warm coastal SSTs. Equal chances (EC) of above, near, and below normal temperatures are indicated for parts of eastern Montana and western North Dakota due to positive soil moisture anomalies which are expected to weaken probabilities of above normal temperatures in this region. EC is indicated for parts of the Desert Southwest due to dynamical model agreement on an active monsoon. Dynamical model guidance for the western and northernmost parts of the Pacific Northwest was uncertain or leaning toward weakly enhanced probabilities of above normal temperatures, which is at odds with the expected cooler impact from La Niña, thus, EC is favored.
Weakly enhanced probabilities of above normal temperatures are favored over northern Alaska owing to impacts from La Niña, decadal trends , and consistency amongst NMME, C3S, and CFSv2 monthly temperature predictions, though probabilities are moderated due to above normal sea ice along the northern coast of Alaska. EC is favored for the remainder of Alaska due to inconsistency among monthly and Week 3-4 dynamical model predictions that favored enhanced above and below normal temperature probabilities, respectively.
Precipitation
The August 2022 Precipitation Outlook considers statistical and dynamical models, antecedent soil moisture conditions, and La Niña impacts. Dynamical model guidance was uncertain over much of the CONUS, thus, enhanced probabilities for above or below normal precipitation relative to climatology are modest. A weak tilt toward below normal precipitation is favored over the region stretching from the Northern Rockies to the Great Lakes and Ohio River Valley, and southward to the Southern Plains, though an area of EC is indicated for parts of eastern Montana and western North Dakota due to positive soil moisture anomalies. Elevated probabilities of below normal precipitation (40-50 percent) are indicated over southern Texas due to dry soil moisture anomalies and agreement among statistical tools and the NMME. Elevated probabilities of below normal precipitation (40-50 percent) are also indicated over the Great Lakes and Ohio River Valley where NMME, C3S, and recent CFSv2 forecasts agreed on favoring below normal precipitation. Positive soil moisture anomalies along with forecasts from NMME and C3S that favored above normal precipitation supports a tilt toward above normal precipitation over the Mid-Atlantic, Southeast, and parts of the Gulf states. Dynamical models , particularly C3S and CFSv2, predict favorable odds for an enhanced monsoon and a tilt toward above normal precipitation over the Desert Southwest. Probabilities of above normal precipitation are elevated for parts of eastern Alaska given expected impacts from La Niña and decadal trend, however, EC is indicated for the remainder of the state due to uncertainty among monthly dynamical models and inconsistency with short term (Week 3-4) dynamical model forecasts.
SUMMARY OF THE OUTLOOK FOR NON-TECHNICAL USERS (Focus on ASO 2022)
The August-September-October (ASO) 2022 temperature outlook predicts elevated probabilities of above-normal seasonal mean temperatures across most of the U.S. The largest probabilities of above-normal temperatures exceed 60 percent for New England and parts of the West. The ASO precipitation outlook predicts elevated probabilities of above-normal precipitation for the East Coast, eastern Gulf Coast, and eastern Mainland Alaska, while below-normal precipitation is more likely across much of the Great Plains, the upper Mississippi Valley, western Great Lakes region, and the northern to central Rockies. Equal chances (EC) are forecast in areas where the likelihood of seasonal mean temperatures or seasonal accumulated precipitation amounts are expected to be similar to climatological probabilities.
A La Niña advisory remains in effect and equatorial sea surface temperatures (SSTs) are below average across the central and eastern Pacific Ocean. The tropical Pacific atmosphere is consistent with a La Niña, with enhanced low-level easterly winds and suppressed convection near the Date Line. La Niña is favored to continue through the Northern Hemisphere summer, with a 62% chance in ASO 2022, and probabilities from 56 to 66% chance through the Northern Hemisphere autumn and winter.
BASIS AND SUMMARY OF THE CURRENT LONG-LEAD OUTLOOKS
PROGNOSTIC TOOLS USED FOR U.S. TEMPERATURE AND PRECIPITATION OUTLOOKS
Dynamical model guidance such as the North American Multi-Model Ensemble (NMME) and the Calibration, Bridging, and Merging (CBaM) version of the NMME were used through lead 5. La Niña temperature and precipitation impacts based on regressions on Niño-3.4 SST anomalies were primarily relied upon for seasons from OND 2022 through MAM 2023, as was an ENSO-OCN tool that uses the consolidation forecasts of the Niño-3.4 SST anomalies plus decadal trends to predict temperature and precipitation. The consolidation tool, which combines both the NMME and various statistical tools as inputs, was used through all seasonal leads. At longer leads, from AMJ to ASO 2023, decadal trends represented by the optimum climate normals (OCN) were the primary driver of the climate outlooks.
PROGNOSTIC DISCUSSION OF OUTLOOKS – ASO 2022 TO ASO 2023
TEMPERATURE
Above-normal temperatures are favored throughout much of the U.S. during ASO, with probabilities that vary regionally. Driven in part by decadal trends and consistent with dynamical model forecasts from the NMME, above-normal temperatures are strongly favored for much of the western CONUS, along the southern tier, and for the eastern CONUS. Probabilities are moderated for the west coast by potential impacts due to La Niña. Calibrated NMME forecasts and the CBaM NMME forecasts support an area of EC for the Northern Plains. Above-normal temperatures are favored across most of Alaska except for the southern Alaska Panhandle in ASO supported by the consolidation tool. Enhanced probabilities of above-normal temperatures persist in the outlooks across most of the CONUS through autumn into early winter. The potential for greater impacts due to a La Niña alters the temperature forecast pattern in late autumn and through winter into next spring. Areas with an EC forecast expand across the northern tier of the CONUS from the Northwest into the Midwest region. Below normal temperatures are more likely for parts of the Pacific Northwest and northern tier in the DJF 2022-23 through FMA 2023 seasons. Decadal trends primarily favor above-normal temperatures over much of the CONUS and various areas of Alaska for later leads, except for some areas of the central CONUS and parts of Alaska where EC is forecast due to near zero decadal temperature trends. The longer lead outlooks were only slightly modified from previous outlooks for consistency with the consolidation forecast.
PRECIPITATION
Supported by the precipitation consolidation tool, the ASO seasonal precipitation outlook slightly favors below-normal precipitation for a large area of the central CONUS, extending from parts of the Great Basin and central Rockies into western areas of the Southern Plains and much of the Central Plains, and northeastward across the Upper Mississippi Valley into the western Great Lakes region. Greater probabilities are indicated for parts of the West and the Great Lakes region. Areas of the Southwest monsoon region that are predicted to receive above normal precipitation early in the season are forecast as EC in the ASO seasonal outlook. Above normal precipitation is more likely for eastern areas of Mainland Alaska, the Atlantic Coast, and the eastern Gulf Coast, as indicated in the consolidation tool. Likely below-normal precipitation continues in the seasonal outlooks across much of the central CONUS in SON and shifts to cover the southern tier of the CONUS by the outlook for winter, consistent with the consolidation and La Niña impacts. An area of enhanced probabilities for above-normal precipitation emerges over the Midwest in winter into spring of 2023, related to potential La Niña impacts and consistent with the consolidation. Longer lead outlooks beginning in the spring of 2023 remain consistent with the previous forecast from last month, related primarily to decadal timescale trends , with only slight modifications for consistency with the precipitation consolidation tool. These include areas of enhanced probabilities of above normal precipitation for parts of the central and eastern CONUS, in longer leads.
ENSO Forecast
It is useful to review the ENSO forecasts used by NOAA to produce this Four-Season Outlook. We reported on that last week and you can read that article by clicking here
The key information used by NOAA follows.
| It is important to realize that there is not much difference between ENSO Neutral with a La Nina Bias meaning the NINO 3.4 Index is close to -0.5C and a very weak La Nina where the NINO 3.4 Index is just slightly colder than -0.5C. The + and – thresholds are somewhat arbitrary. In Australia, they use + or – 0.8C as their threshold which appears to make more sense for that part of the World. Notice for JFM 2023 the probability of La Nina and ENSO Neutral is about equal. One way of looking at that is that the Nino 3.4 Index is likely to be close to -0.5C. |
Here we compare the Early July analysis with the Mid June Analysis
| We thought we saw a slight indication of a more rapid decline after the prior monthly report suggested that it might end a little slower than previously thought. There are small changes. |
New Information
I am quite annoyed with IRI. If they worked for me they would be gone by COB. They issued a report on July 14 which presumably is what NOAA based their Seasonal Outlook on and then five days later on July 19 they issue another report. There is something very wrong with the way IRI is managed by NOAA.
Is the new forecast any different? Let’s take a look.
| July 14, 2022 | July 19, 2022 |
|
|
|
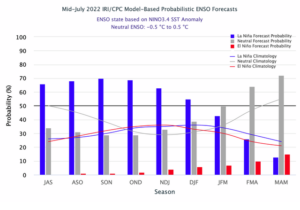
| There are some slight changes in JFM 2023 and a larger change in FMA 2023. MAM is now showing and it is clearly ENSO Neutral. One the other hand the early months show La Nina to have a higher probability. I do not see the need for IRI to have issued this and it confused the matter a bit in that we have no way to know if the new forecast was considered by NOAA in their Seasonal Outlook. Also there are differences in the methodology between the early and the mid-month analysis. I wish IRI as not issued this report. |
We do benefit from now having the plume of forecasts.
| This is a little tricky to read because there are a lot of models and three subtotals: dynamic models, statistical models and all the models. In general, the dynamic models are the more accurate. It is kind of the thick purple line and it seems to show ENSO Neutral happened around DJF 2022/2023 which is maybe a month earlier than the IRI analysis. We will look at the forecast maps soon. |
And we include one more graphic namely the NOAA proprietary ENSO model. It is not the primary tool that NOAA uses but we find it to be useful.
| The above will not auto-update. But the image will update if you click HERE. https://www.cpc.ncep.noaa.gov/products/people/wwang/cfsv2fcst/images3/nino34SeaadjPDFSPRDC.gif
NOAA relies more on the IRI Forecast. But perhaps this model is now showing that we may become ENSO Neutral for Late Fall or early Winter. This is my interpretation not the formal forecast of NOAA. |
Resources
The link for the drought outlook map and some discussions that come with the map can be found by clicking HERE.
| I hope you found this article interesting and useful |
