Here is what we are paying attention to this evening and the next 48 hours from this evening’s NWS Forecast.
...Dangerous record-breaking heat to continue across the central United
States and parts of the West...

...Scattered flash flooding possible across much of the Ohio Valley on
Sunday, with isolated heavy rainfall forecast across the Southwest through
the beginning of next week...

...Severe weather possible across the northern Plains on Monday...
Continuation of the NWS Short Range Forecast (It is updated twice a day and these updates can be found here.
The weather pattern throughout the next few days over the Lower 48 will be
largely controlled by a strong upper level ridge stretching from the
Southwest to the Southern Plains, while storm systems rotate around the
ridge from the Northwest to the East Coast. The most widespread weather
hazard through early next week will be associated with above normal
temperatures coinciding with the warmest time of the year. Highs into the
upper 90s and 100s will stretch across the entire Great Plains by Monday,
with dangerous heat also extending into the Intermountain West and
Southwest. Excessive Heat Warnings and Heat Advisories are in effect for
parts of Arizona, as well as southern California and the San Joaquin
Valley through Sunday. Excessive Heat Watches have also been issued for
northern Utah on Sunday, including Salt Lake City, as highs could exceed
100 degrees. The most anomalous heat is expected to be found across parts
of the central and northern Plains on Monday, as highs soar 10 to 20
degrees above average and reach into the triple digits throughout South
Dakota and into Nebraska, Kansas, and Colorado. Cities such as Rapid City,
SD; Cheyenne, WY; and Denver, CO could topple daily high temperature
records on Monday. Residents and visitors throughout these regions are
advised to heed warnings and advisories issued by their local forecast
office, as well as practice proper heat safety.

Areas of isolated to scattered thunderstorms will also impact parts of the
Nation in typical mid-summer fashion. A stationary boundary draped from
the Mid-Atlantic to the Southern Plains along with a strengthening area of
low pressure in the Midwest will help focus numerous showers and
thunderstorms over the Ohio Valley into Sunday. Through tonight, isolated
instances of flash flooding, damaging wind gusts, and large hail may
impact locations along this front. More organized and widespread
thunderstorm activity is expected by the end of the weekend as the system
begins a slow push eastward. Several inches of rain and heavy rainfall
rates may lead to scattered flash floods from eastern Pennsylvania to far
northeast Arkansas and southeast Missouri. A Slight Risk (level 2/4) of
excessive rainfall has been issued for this region on Sunday in order to
highlight the concern. By Monday, the heavy rain and marginal severe
weather threats remain along and ahead of the advancing cold front
stretching from the Northeast to the Tennessee Valley.

Farther west, continued monsoonal moisture will create additional chances
for heavy rain within isolated thunderstorms. Locations most susceptible
to flash flooding are within and near burn scars, slot canyons, and places
with overly saturated soils. A broad Marginal Risk (level 1/4) of
excessive rainfall remains in effect across the Southwest, parts of the
Intermountain West and central/southern Rockies through Monday.

A potent upper level low entering the Pacific Northwest late Sunday will
allow for gusty winds and elevated fire weather throughout parts of the
northern Great Basin through Sunday, prompting Red Flag Warnings to be
hoisted over parts of southern Oregon, northern California, and
northwestern Nevada. As the system enters the northern High Plains on
Monday, strong winds are possible over central and western Montana. Due to
the threat of wind gusts up to 60 mph, a High Wind Watch has been issued
for this section of Big Sky Country. Travel could be particularly
difficult for high profile vehicles traveling through the region. Lastly,
thunderstorms are expected to develop over the northern High Plains on
Monday afternoon and stretch into North Dakota and northern Minnesota by
Monday night. A few storms may turn severe, as highlighted by a Slight
Risk (level 2/5) of severe thunderstorms.
Maps that relate the forecast to geography can be found by clicking Here for Day 1 and Here for Day 2.
Here is a 60-hour animated forecast map that is updated every 6 hours by NOAA. We will monitor to see if the image here updates automatically or not.

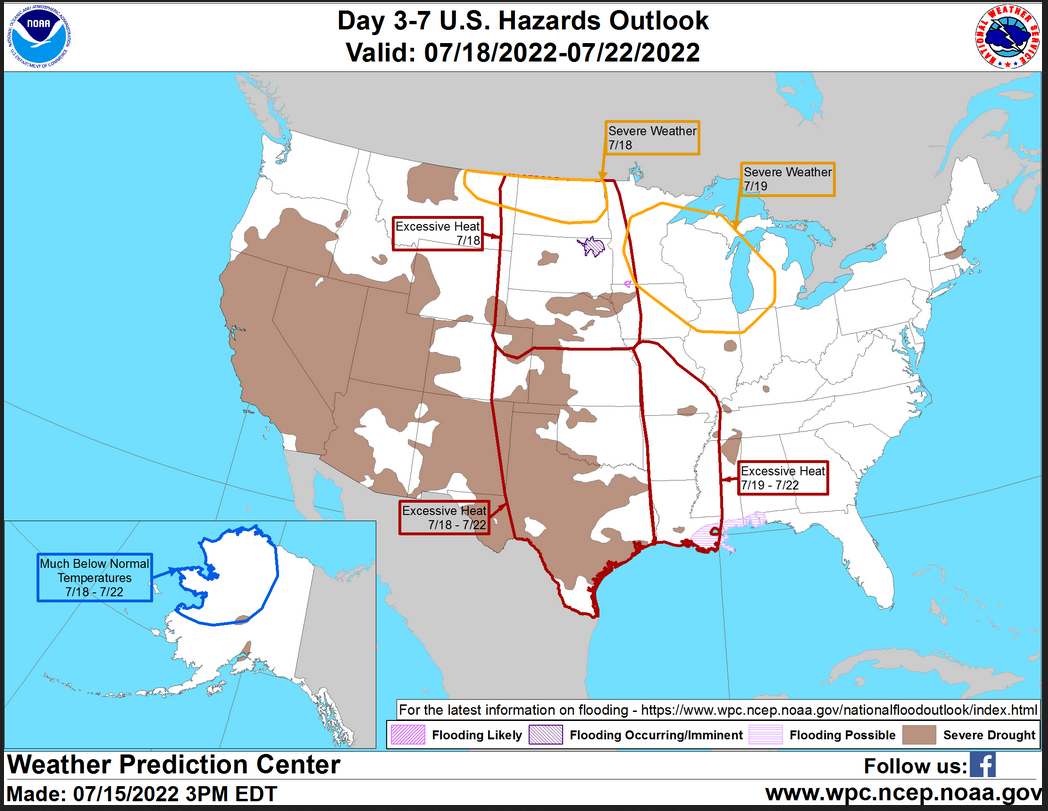
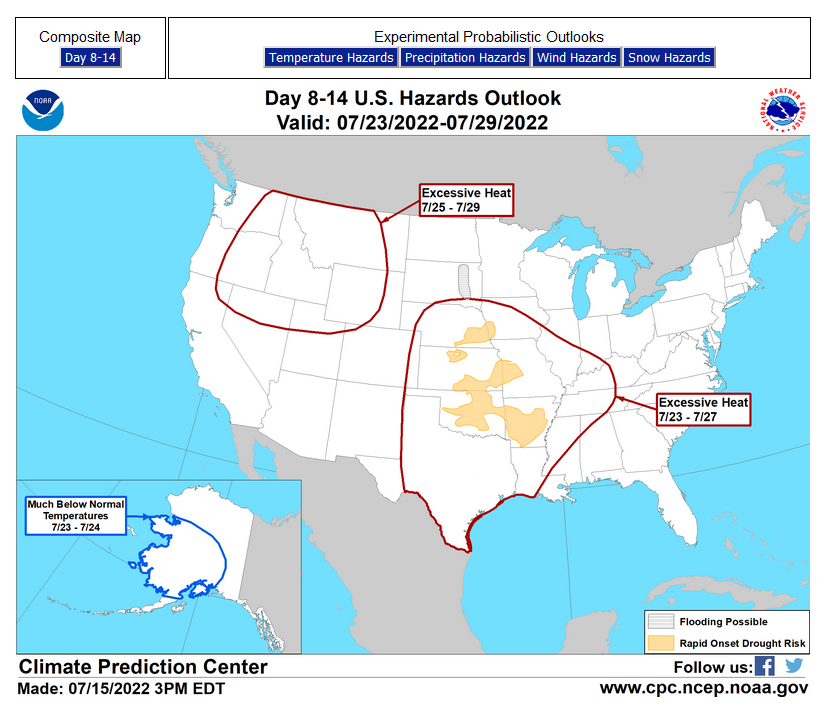
HAZARDS OUTLOOKS
Click here for the latest complete Day 3 -7 Hazards forecast which updates only on weekdays. Once a week probably Monday or Tuesday I will update the images. I provided the link for reads to get daily updates on weekdays. Use your own judgment to decide if you need to update these images.
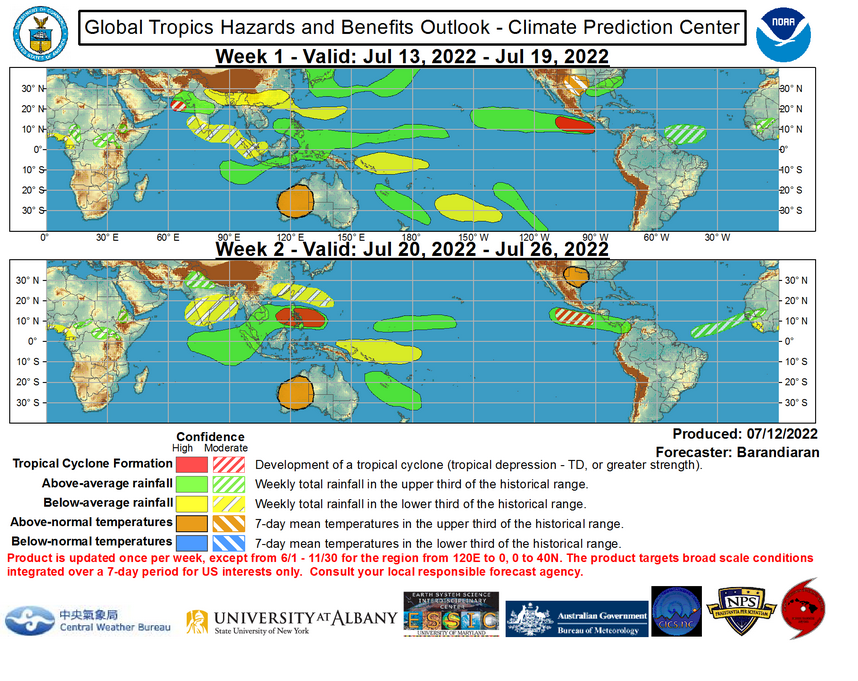
Worldwide Tropical Forecast
(This graphic updates on Tuesdays) If it has not been updated, you can get the update by clicking here https://www.cpc.ncep.noaa.gov/products/precip/CWlink/ghazards/images/gth_small.png
Detailed Maps and Reports for the Western Atlantic and the Pacific Oceans
Below are three maps that summarize the situation for the Atlantic, Eastern and Central Pacific. Additional information can be accessed by clicking HERE
First the Atlantic
Click to view the forecast map and have access to additional information https://www.nhc.noaa.gov/gtwo.php?basin=atlc&fdays=5
Then Eastern Pacific
Click to view the forecast map and have access to additional information https://www.nhc.noaa.gov/gtwo.php?basin=epac&fdays=5
Then Central Pacific
Click to view the forecast map and have access to additional information https://www.nhc.noaa.gov/gtwo.php?basin=cpac&fdays=5
And the Western Pacific
Click to view the forecast map and have access to additional information https://www.metoc.navy.mil/jtwc/jtwc.html
Some Intermediate-Term Outlooks
Links to “Outlook” maps and discussions for three time periods. Days 6 – 10, Days 8 – 14, and Weeks 3 and 4. An outlook differs from a forecast based on how NOAA uses these terms in that an “outlook” presents information from deviation from normal and the likelihood of these deviations.
You have to click on the links because they do not update automatically and I do not want to have stale images in the article. But it is not difficult to click on a link and you get a large image plus a discussion. On Fridays in a separate article, we will show the images and provide a link in this article that article. But remember what you will see is the images as of Friday. But here you can get the current images simply by clicking on them. Then hit the return arrow at the upper left of your screen to return to the article. You will not find this information easily anywhere else.

Right now you can find these maps here (We show them every Friday there but you can click above and find them).
Month to Date Information
Temperature

Precipitation

Month to date Temperature can be found at https://hprcc.unl.edu/products/maps/acis/MonthTDeptUS.png
Month to date Precipitation can be found at https://hprcc.unl.edu/products/maps/acis/MonthPNormUS.png
