NOAA updates many of their weather outlooks and in many cases issues a discussion with those outlooks. On Fridays, they issue a week 3 – 4 outlook which is farther out than the typical 10-day forecast and the discussion is excellent. So we have decided to issue a special report on Fridays. When we issue the Seasonal Outlook on the third Thursday, we may sometimes issue the Friday report as an update to the Seasonal Outlook.
When the Week 3-4 Outlook is issued, we have a 28-day view of the future. It is important to recognize that the predictions do not always work out as predicted but in the article, there are links to obtain updated predictions.
It is not surprising that the forecast is relatively static and not showing much change over the 28-day period. And the dominant characteristic is hot.

| Announcement: We now publish a daily weather report that addresses both short-term and intermediate-term weather issues including tropical events and you can find it at econcurrents.com. To return to this article just hit the return arrow at the upper left corner on your screen. This message is mainly for future reference as this article covers most of what you need to know other than tropical events. I do not include those in this article as generally, it is not possible to predict them out to 28 days. |
Outlooks for Days 6 – 28
Links to “Outlook” maps and discussions for three time periods. Days 6 – 10, Days 8 – 14, and Weeks 3 and 4. An outlook differs from a forecast based on how NOAA uses these terms in that an “outlook” presents information as deviation from normal and the likelihood of these deviations.
I have provided the maps so you do not need to click to get them. But they do not update daily. But you can get the current images simply by clicking on the links provided. Then hit the return arrow at the upper left of your screen to return to the article. There is no need to do that right away since what is published tonight is up to date.

Below are the links to obtain updates and additional information.
We start with Weeks 3 and 4. That may seem strange but for many purposes that is a time frame that is very important.
Prognostic Discussion for Week 3-4 Temperature and Experimental Precipitation Outlooks
NWS Climate Prediction Center College Park MD
300PM EDT Fri Jul 15 2022
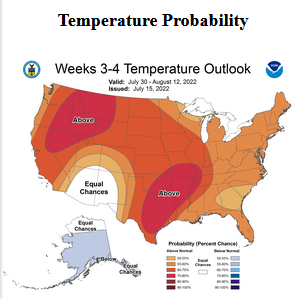
Week 3-4 Forecast Discussion Valid Sat Jul 30 2022-Fri Aug 12 2022
La Nina conditions continue to prevail across the equatorial Pacific, with below-average sea-surface temperatures (SSTs) observed underneath an enhanced Walker circulation. The Madden-Julian Oscillation (MJO) was active in late June and early July, with the enhanced convective phase crossing the Maritime Continent, but the signal became incoherent by mid-July due to destructive interference from both La Nina and equatorial Rossby wave activity. Dynamical model MJO index forecasts are mixed, but the ECMWF suggests a potential for the remnant signal to re-emerge over the Western Hemisphere and Indian Ocean by Week-2. While teleconnections between the tropics and Northern Hemisphere extratropics are weak during the Boreal summer months, MJO activity could contribute to a more favorable environment for early season tropical cyclone development over the Atlantic Ocean’s main development region (MDR). Due to these weak teleconnections, long-term trends are the biggest contributor among the components of the multivariate linear regression (MLR) statistical tool, and strongly favor warmth across the majority of the US.
This Weeks 3-4 outlook is based on a manual blend of operational forecasts including the MLR, GEFS, ECMWF, and CFS, the multi-model ensemble forecast from the Subseasonal Experiment suite of models (SubX MME), an experimental skill weighted subsampling tool of the dynamical model guidance, and the experimental Linear Inverse Model (LIM). The manual blend 500-hPa height anomaly forecast features a climatologically typical low amplitude signal, with above-average heights favored across parts of the northern tier of the CONUS, and a slight westward displacement of the climatological mean ridge over the central CONUS. This setup strongly favors a warm pattern overall for the contiguous U.S., while ridging (troughing) west of the Aleutians (over northwestern Canada) favors enhanced northerly flow across Alaska, which would indicate a greater potential for below-average temperatures. This forecast is fairly similar to the anticipated Day 8-14 day setup, reflecting the persistence of a fairly stationary pattern overall.
Consistent with the height forecast, below-average temperatures are favored across much of Alaska, while above-average temperatures are favored for the majority of the CONUS. Equal chances (EC) for below- and above-average temperatures are maintained across the Southwest monsoon region due to a potential for enhanced convection, and in the vicinity of Lake Superior due to abnormally cold water temperatures. There are two regions where the probability of above-average temperatures exceed 70-percent. Anomalous ridging across the Northwest strongly favors a hot pattern, and although the manual blend probabilities are not quite as high, there is strong support for warmth from both the SubX MME and the LIM, and the MLR where historical skill is fairly high across the Northwest. The second region extends from eastern Texas through the mid-Mississippi Valley, with high probabilities for above-average temperatures based on the likelihood of feedback from anomalously dry topsoils.
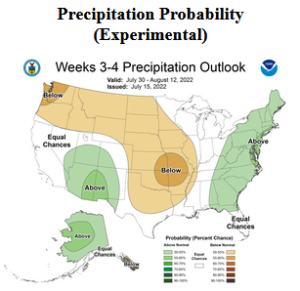
The precipitation forecast is lower confidence; there are no probabilities for above- or below-average precipitation exceeding 55 percent in the manual blend. Above-average precipitation is favored across much of Alaska based on dynamical model guidance. Consistent with ridging, below-average precipitation is favored across the Northwest, extending southeastward across portions of the Plains to the mid-Mississippi Valley. Undercutting this feature, above-average precipitation is slightly favored for much of the Four Corners region, the southern Great Basin, and the southern California deserts due to a potential for robust monsoon activity. Above-average precipitation is favored for much of the eastern seaboard, where the signal is fairly weak but model guidance is consistent across the board. EC is maintained for the Florida Peninsula, while ongoing La Nina conditions favor below-average precipitation for Hawaii.
| There are not too many clues in the discussion but you can clearly see the two hot spots for Weeks 3 and 4 and also dry and wet areas. The hot spots may be very hot. |
Plus some medium-term outlooks (I am not including the discussions but if you click on the links provided earlier in this article you will be able to obtain them.
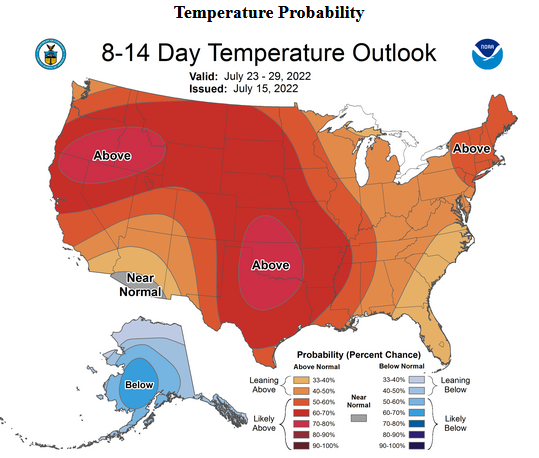
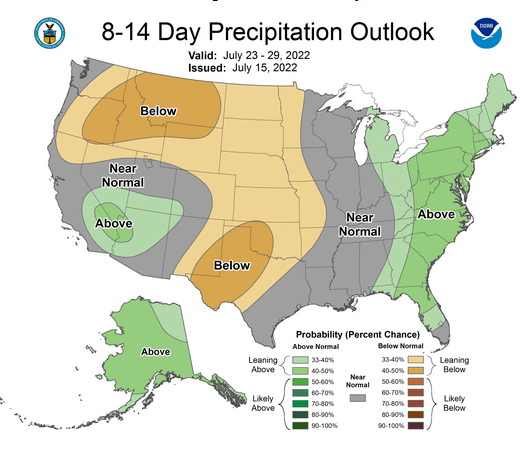
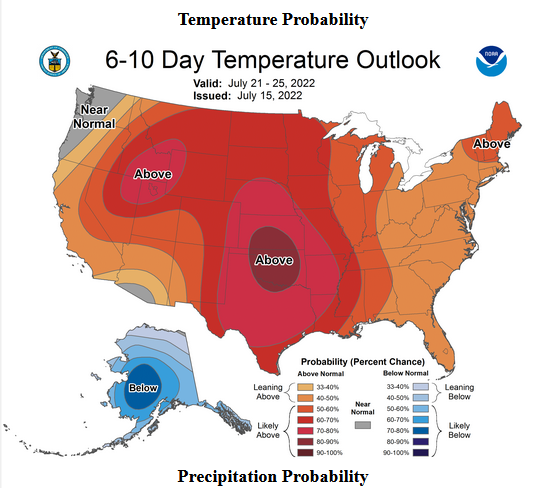
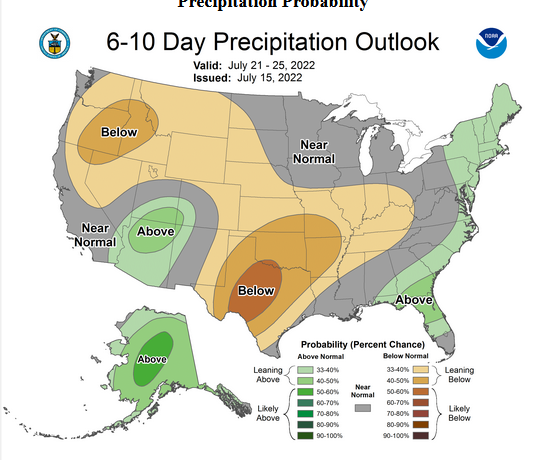
| There is not a lot of change from one outlook to another. It is pretty much a static pattern. The reason for a 6 -10 and 8 – 14 forecast is mostly a winter issue where it is difficult to predict exactly when storms will reach particular areas. It is not as important during the summer. |
Plus some short-term – click the links to update (you will end up with a lot of additional information)
| Temperature (Maximum Anomaly) | Precipitation (Five days of cumulative precipitation) |
| https://www.wpc.ncep.noaa.gov/medr/medr_mean.shtml | https://www.wpc.ncep.noaa.gov/qpf/day1-7.shtml |
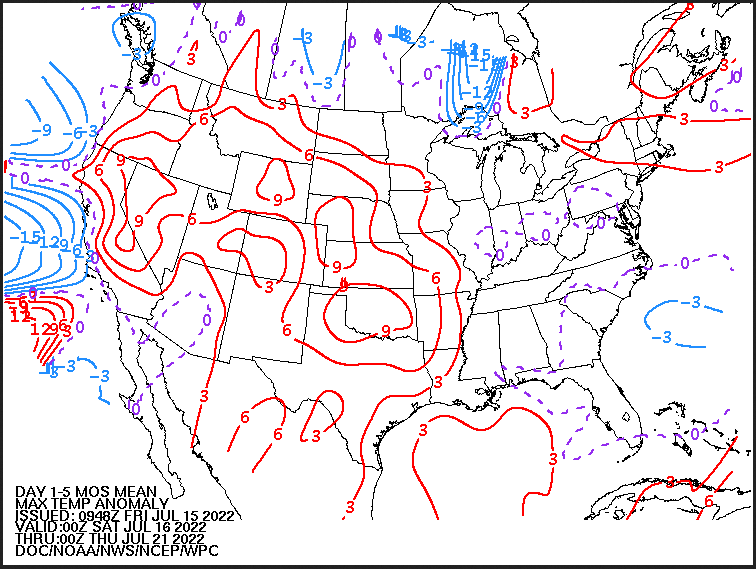
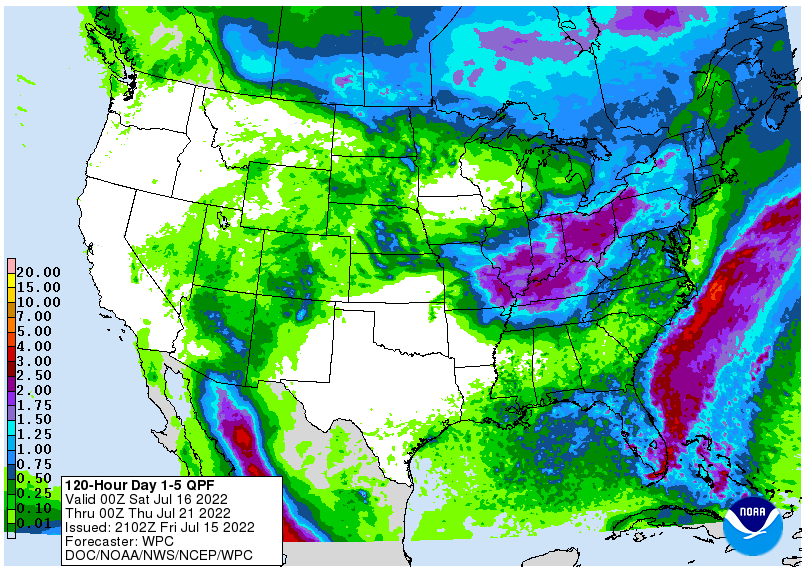
| The temperature map is one I have not used before. But you can warm anomalies of 9 degrees which is a lot. There are also significant cool anomalies. The precipitation map is a bit difficult to read since it is hard to tell if the really heavy precipitation along the East Coast is onshore or offshore. You can see the Monsoon in Mexico partially entering Arizona and also impacting New Mexico, Utah, Colorado and more. |