Here is what we are paying attention to this evening and the next 48 hours from this evening’s NWS Forecast.
..Heat to continue across much of the Central and Western States...

..A Fire Weather Threat across portions of the Great Basin and Central
Plains...

..Heavy Rains and isolated Flash Flooding possible along the Central Gulf
Coast into the Southeast, across the Upper Mississippi Valley and from the
Southwest into the Great Basin and Southern Rockies...
Continuation of the NWS Short Range Forecast (It is updated twice a day and these updates can be found here.
The persistent upper level closed high that has been parked across the
Southern Plains into the Southwest over the past week, will become
centered farther to the west in the vicinity of the Four Corners region
for the end of this week.  This upper high has been responsible for
numerous record high temperatures from this past weekend into this week
across the south central U.S., especially over central to eastern portions
of Texas.  With the westward shift to the center of this upper high, the
number of record high temperatures will decrease significantly over the
next few days across the Southern Plains.  However, temperatures will
still remain much above average for the end of this week across much of
the Central to Western U.S.  Areas of Central to Eastern Texas that have
experienced record heat recently, have also had a streak of 100 degree
plus high temperatures.  While the potential for record highs over the
next few days is decreasing, the 100 degree plus high temperature streak
will likely continue through the end of this week and into next week.
Several Texas cities, including Dallas, San Antonio and Abilene have seen
100 degree plus highs for the past week and a half.  Heat advisories are
currently in effect across large sections of the Plains and will likely to
continue so going into the end of this week.  Heat Advisories and
Excessive Heat Warnings are also in effect over portions of the Great
Basin and Southeast California.

On the western side of the Four Corners Upper High, above average moisture
values will stream northward across the Southwest and into portions of the
Great Basin and Southern Rockies.  This will support the potential for
widespread scattered monsoonal showers and thunderstorms over the next few
days, along with potential for flash flooding.   Away from this above
average moisture axis, dry conditions expected to persist across the
western portions of the Great Basin where a fire weather threat will
continue over the next few days.  Dry conditions also over portions of the
Central Plains will support an increased fire weather threat here also.

While much of the Central to Western U.S. will continue to see much above
average temperatures, cooler than average temperatures are possible along
the Central Gulf Coast into the Southeast.  This will due to a continued
wet weather pattern for this portion of the nation where additional
widespread thunderstorms are expected. This region has been wet over the
past several weeks with rainfall totals 200-300% above average.  With
additional areas of heavy rain likely over the next two days, the areas
that have received much above average precipitation recently will have an
increased threat of flash flooding.  Areas from the Upper Mississippi
Valley toward the western Great Lakes will also see a heavy rain and flash
flooding threat, along with the threat of severe weather Thursday night
into Friday.
Maps that relate the forecast to geography can be found by clicking Here for Day 1 and Here for Day 2.
Here is a 60-hour animated forecast map that is updated every 6 hours by NOAA. We will monitor to see if the image here updates automatically or not.

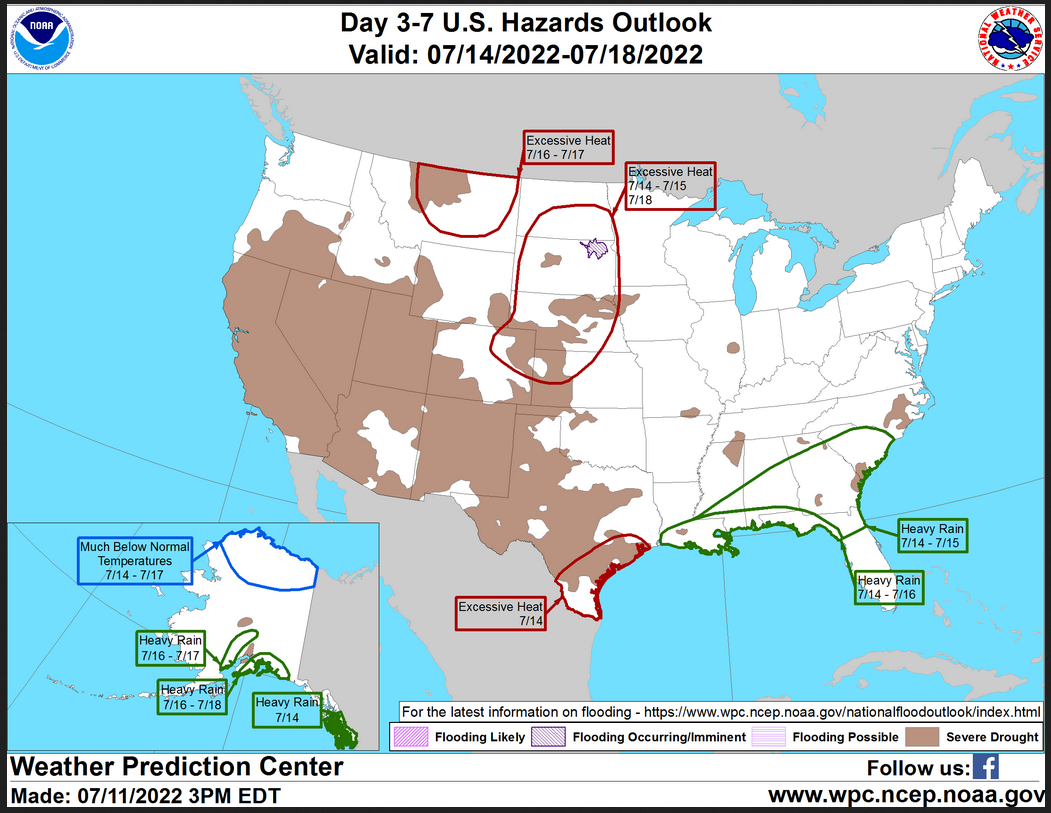
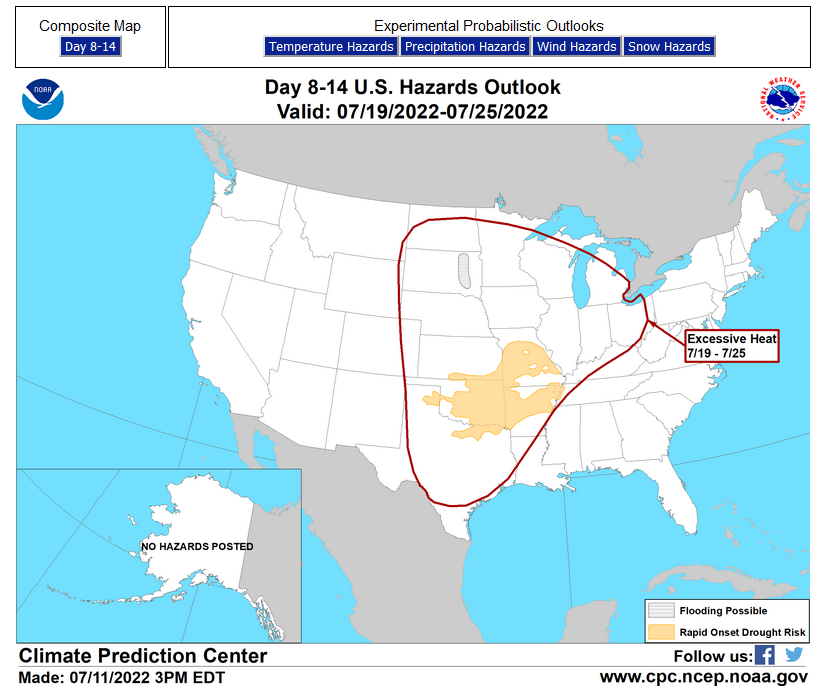
HAZARDS OUTLOOKS
Click here for the latest complete Day 3 -7 Hazards forecast which updates only on weekdays. Once a week probably Monday or Tuesday I will update the images. I provided the link for reads to get daily updates on weekdays. Use your own judgment to decide if you need to update these images.
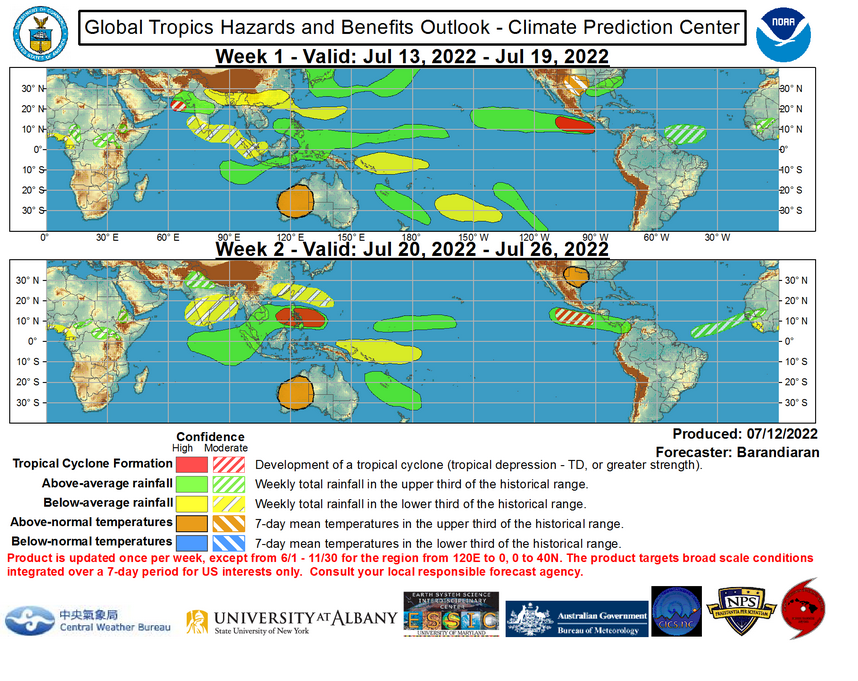
Worldwide Tropical Forecast
(This graphic updates on Tuesdays) If it has not been updated, you can get the update by clicking here https://www.cpc.ncep.noaa.gov/products/precip/CWlink/ghazards/images/gth_small.png
Detailed Maps and Reports for the Western Atlantic and the Pacific Oceans
Below are three maps that summarize the situation for the Atlantic, Eastern and Central Pacific. Additional information can be accessed by clicking HERE
First the Atlantic
Click to view the forecast map and have access to additional information https://www.nhc.noaa.gov/gtwo.php?basin=atlc&fdays=5
Then Eastern Pacific
Click to view the forecast map and have access to additional information https://www.nhc.noaa.gov/gtwo.php?basin=epac&fdays=5
Then Central Pacific
Click to view the forecast map and have access to additional information https://www.nhc.noaa.gov/gtwo.php?basin=cpac&fdays=5
And the Western Pacific
Click to view the forecast map and have access to additional information https://www.metoc.navy.mil/jtwc/jtwc.html
Some Intermediate-Term Outlooks
Links to “Outlook” maps and discussions for three time periods. Days 6 – 10, Days 8 – 14, and Weeks 3 and 4. An outlook differs from a forecast based on how NOAA uses these terms in that an “outlook” presents information from deviation from normal and the likelihood of these deviations.
You have to click on the links because they do not update automatically and I do not want to have stale images in the article. But it is not difficult to click on a link and you get a large image plus a discussion. On Fridays in a separate article, we will show the images and provide a link in this article that article. But remember what you will see is the images as of Friday. But here you can get the current images simply by clicking on them. Then hit the return arrow at the upper left of your screen to return to the article. You will not find this information easily anywhere else.

Month to Date Information
Temperature

Precipitation

Month to date Temperature can be found at https://hprcc.unl.edu/products/maps/acis/MonthTDeptUS.png
Month to date Precipitation can be found at https://hprcc.unl.edu/products/maps/acis/MonthPNormUS.png