Here is what we are paying attention to this evening and the next 48 hours from this evening’s NWS Forecast.
...Continuing chances for heavy rain and scattered flash flooding forecast
across the central Gulf Coast and Southeast...

...Isolated instances of flash flooding possible over the Southwest and
parts of the central/southern Rockies associated with monsoon activity...

...Severe thunderstorms capable of containing damaging wind gusts are
possible across parts of the northern High Plains and Mid-South through
tonight...

...Dangerous heat and humidity persists across much of the central United
States and Great Basin through the end of the week...
Continuation of the NWS Short Range Forecast (It is updated twice a day and these updates can be found here.
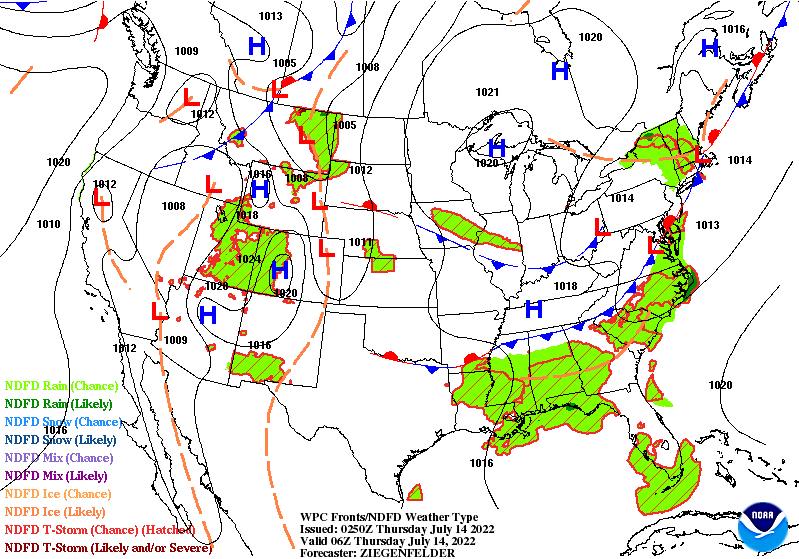
Similar to recent days, heavy rain chances are set to continue across the
Southeast and central Gulf Coast States through at least Friday. A warm
and muggy airmass will support thunderstorm develop to the south of a
stationary boundary draped across the eastern half of the Nation from the
Mid-Atlantic to the Lower Mississippi Valley. High atmospheric water
content will allow for showers and thunderstorms to potentially contain
intense rainfall rates which could lead to scattered flash floods. A
Slight Risk (level 2/4) of Excessive Rainfall is in effect through tonight
from southeast Louisiana to western North Carolina. The heavy rainfall
threat is expected to shift slightly southward on Thursday and again on
Friday, but remain located throughout much of the Southeast and eventually
consolidate over the central Gulf Coast by the end of the week.
Additionally, a few storms could contain damaging wind gusts from the
Mid-South to the Southeast. The Storm Prediction Center has issued a
Slight Risk (level 2/5) of severe thunderstorms over parts of central
Mississippi and Alabama, with a Marginal Risk (level 1/5) over portions of
the Southeast on Thursday.

Monsoon activity is also expected to continue during the next few days and
lead to isolated flash flooding across the Southwest and central/southern
Rockies. A strong upper-level ridge centered over the Southern Rockies
will allow for moisture to rotate around the high and into the region.
Susceptible terrain near burn scars, slot canyons, etc. will be most at
risk for rapid runoff and flash floods throughout the Colorado River Basin.

Elsewhere, a shortwave trough swinging through the far northern Rockies
this evening will support developing thunderstorms throughout the northern
High Plains into tonight. A few storms could contain damaging wind gusts,
which has prompted a Slight Risk of severe weather to be issued over parts
of central Montana. Extending into Thursday and Friday, the marginal
severe weather threat shifts into the northern Plains and parts of the
Midwest as potential thunderstorm complexes ride to the north of a forming
warm front.

Summer heat will continue to remain a concern over much of the central
U.S. and interior portions of the West for the foreseeable future. As the
aforementioned upper-level ridge remains locked in over the Four Corners
region, highs into the upper 90s and triple digits will be found along the
periphery from the Desert Southwest to the northern Great Basin and much
of the Great Plains. The most anomalous heat is located across eastern
Montana this afternoon, where highs near 100 degrees equates to around 15
to 20 degrees above average. By Thursday, well above average heat shifts
into the central Plains as triple digit highs extend into western Kansas
and Nebraska. Only a few daily high temperature records are expected to be
threatened during this period, but that should not underscore the danger
this heat could pose if spending extended time outdoors.
Maps that relate the forecast to geography can be found by clicking Here for Day 1 and Here for Day 2.
Here is a 60-hour animated forecast map that is updated every 6 hours by NOAA. We will monitor to see if the image here updates automatically or not.
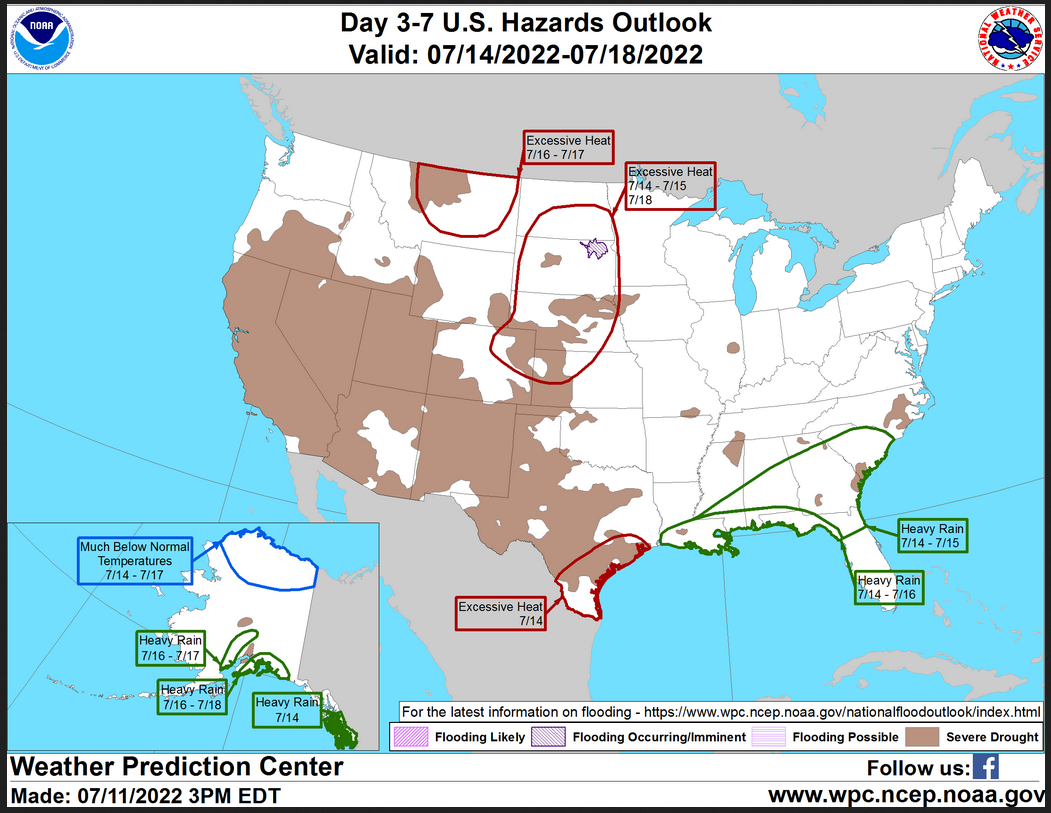
HAZARDS OUTLOOKS
Click here for the latest complete Day 3 -7 Hazards forecast which updates only on weekdays. Once a week probably Monday or Tuesday I will update the images. I provided the link for reads to get daily updates on weekdays. Use your own judgment to decide if you need to update these images.
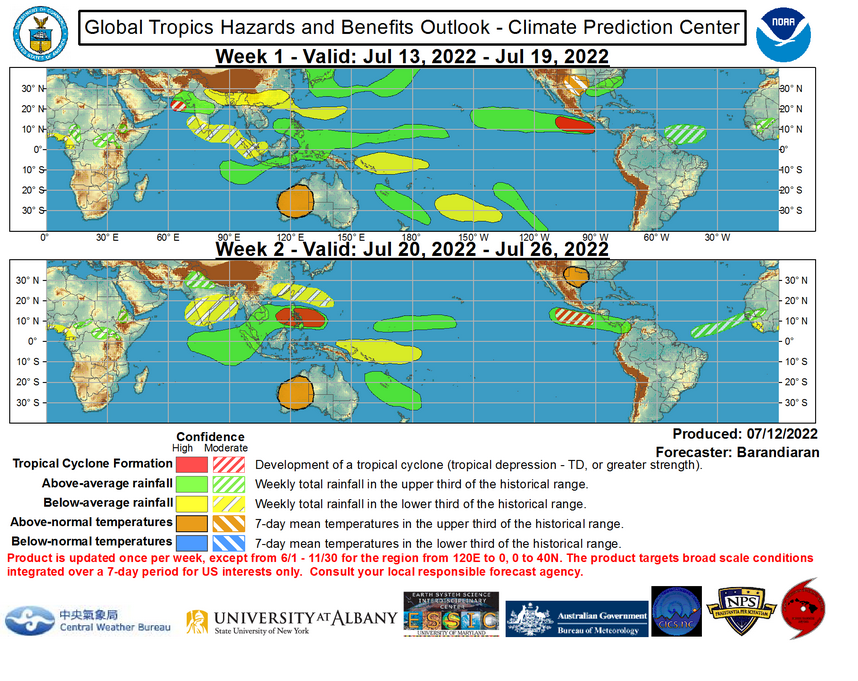
Worldwide Tropical Forecast
(This graphic updates on Tuesdays) If it has not been updated, you can get the update by clicking here https://www.cpc.ncep.noaa.gov/products/precip/CWlink/ghazards/images/gth_small.png
Detailed Maps and Reports for the Western Atlantic and the Pacific Oceans
Below are three maps that summarize the situation for the Atlantic, Eastern and Central Pacific. Additional information can be accessed by clicking HERE
First the Atlantic
Click to view the forecast map and have access to additional information https://www.nhc.noaa.gov/gtwo.php?basin=atlc&fdays=5
Then Eastern Pacific
Click to view the forecast map and have access to additional information https://www.nhc.noaa.gov/gtwo.php?basin=epac&fdays=5
Then Central Pacific
Click to view the forecast map and have access to additional information https://www.nhc.noaa.gov/gtwo.php?basin=cpac&fdays=5
And the Western Pacific
Click to view the forecast map and have access to additional information https://www.metoc.navy.mil/jtwc/jtwc.html
Some Intermediate-Term Outlooks
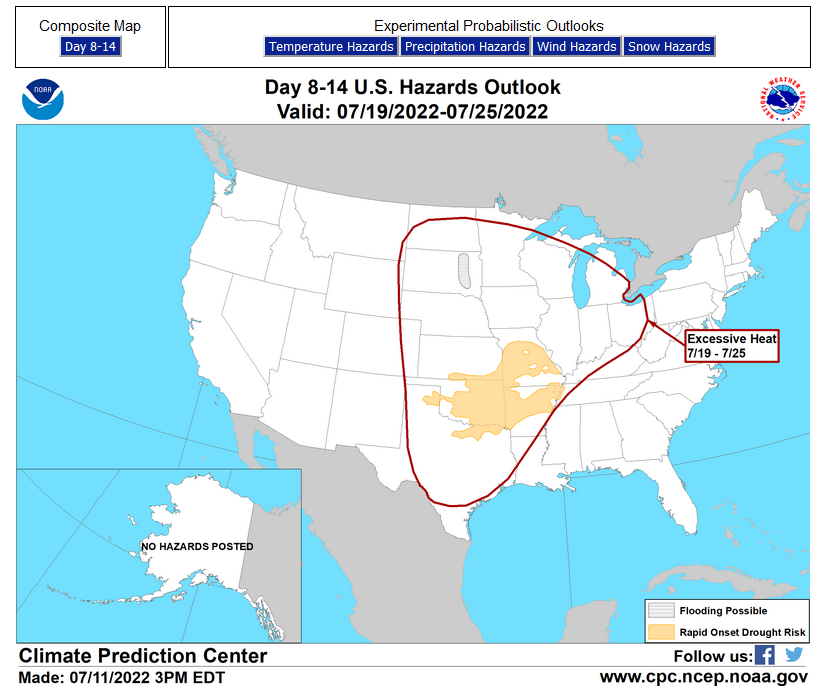
Links to “Outlook” maps and discussions for three time periods. Days 6 – 10, Days 8 – 14, and Weeks 3 and 4. An outlook differs from a forecast based on how NOAA uses these terms in that an “outlook” presents information from deviation from normal and the likelihood of these deviations.
You have to click on the links because they do not update automatically and I do not want to have stale images in the article. But it is not difficult to click on a link and you get a large image plus a discussion. On Fridays in a separate article, we will show the images and provide a link in this article that article. But remember what you will see is the images as of Friday. But here you can get the current images simply by clicking on them. Then hit the return arrow at the upper left of your screen to return to the article. You will not find this information easily anywhere else.

Month to Date Information
Temperature

Precipitation

Month to date Temperature can be found at https://hprcc.unl.edu/products/maps/acis/MonthTDeptUS.png
Month to date Precipitation can be found at https://hprcc.unl.edu/products/maps/acis/MonthPNormUS.png