Updated at !:30 am EDT Monday, June 6, 2022 to include the Tropical Storm Alex Tracking Map which mostly now threatens Bermuda on Monday. A near miss rather than a direct hit is expected.
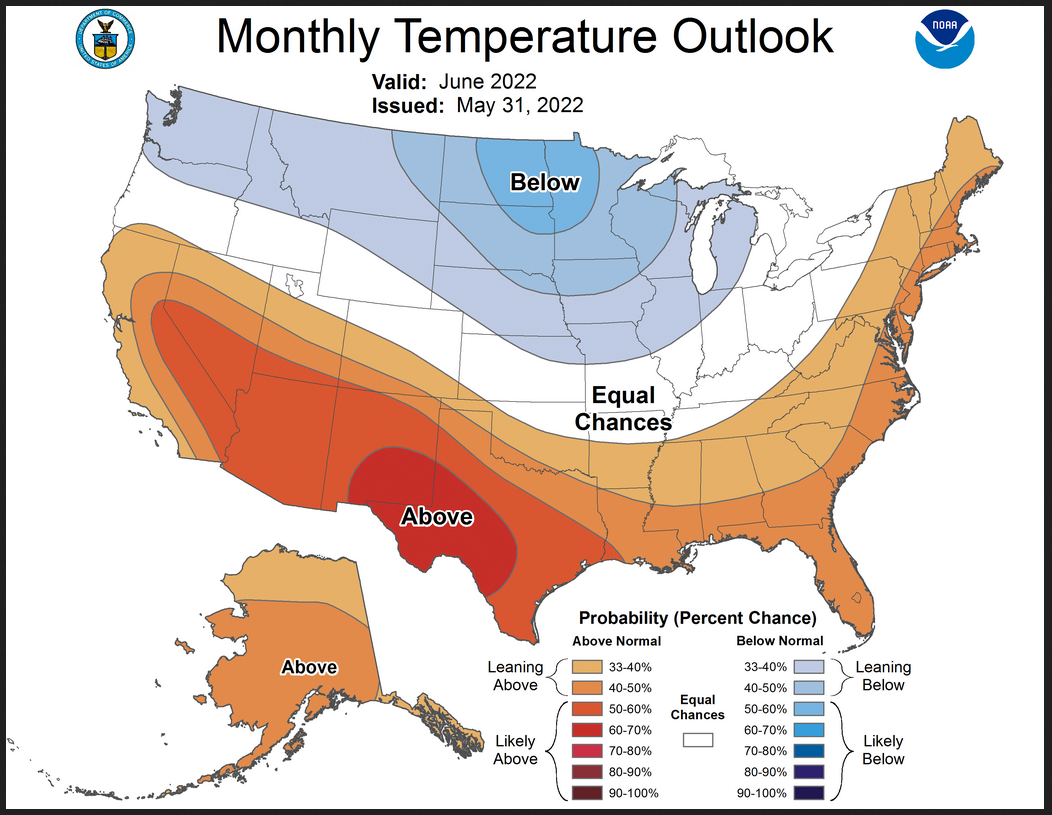
On Tuesday, we discussed the NOAA update of their Outlook for June 2022. We only had 24 days of the short-term outlooks at that time so I decided to publish the Weeks 3 – 4 Outlook when it was issued which was today. It is always issued on a Friday. This combined with the discussion issued with the Outlook provides additional insight into how June weather will evolve.
The Weeks 3 and 4 Outlook just released and the precipitation Outlook (it remains an experimental product of NOAA), seems to confirm the Outlook for the Month of June with the possible exception that parts of the Southwest may be impacted by an Easterly Wave (from tropical activity) and an early onset of the North American Monsoon (NAM).

–
| Note: If you click on any EconCurrents Author’s name you will have access to all their prior articles |
First, we Present the Weeks 3 and 4 Outlook Maps and the Discussion
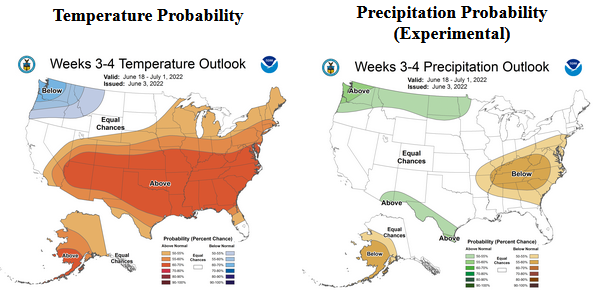
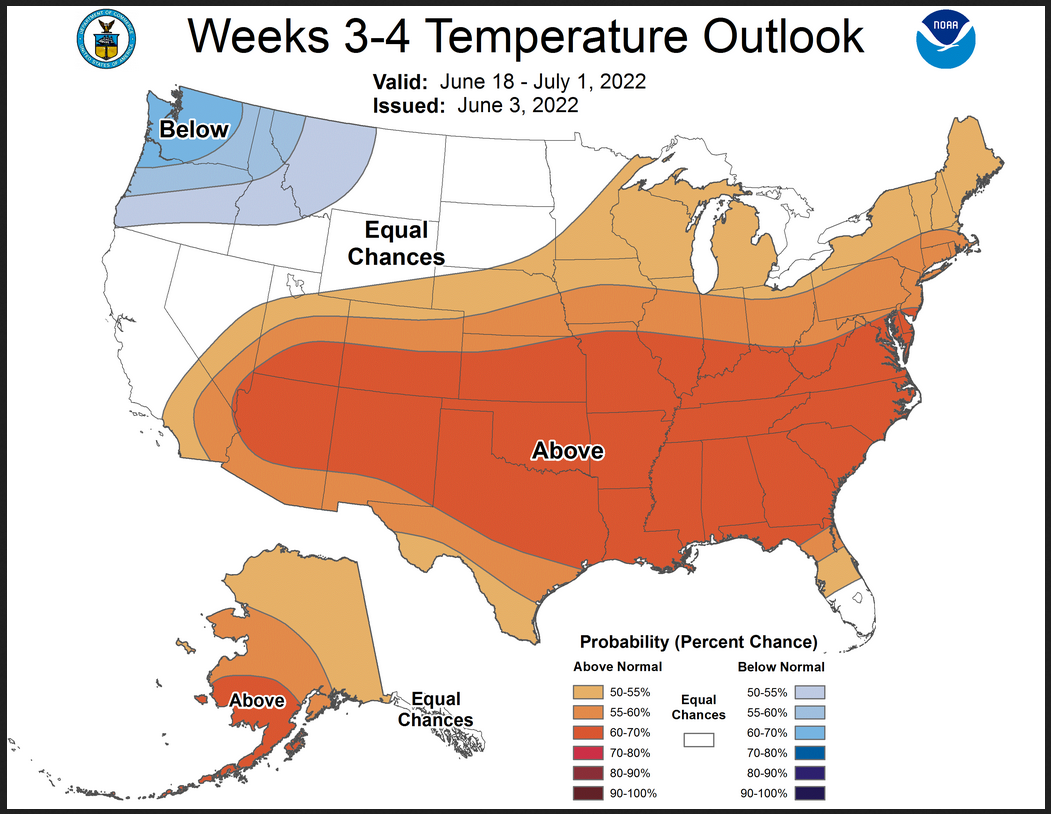
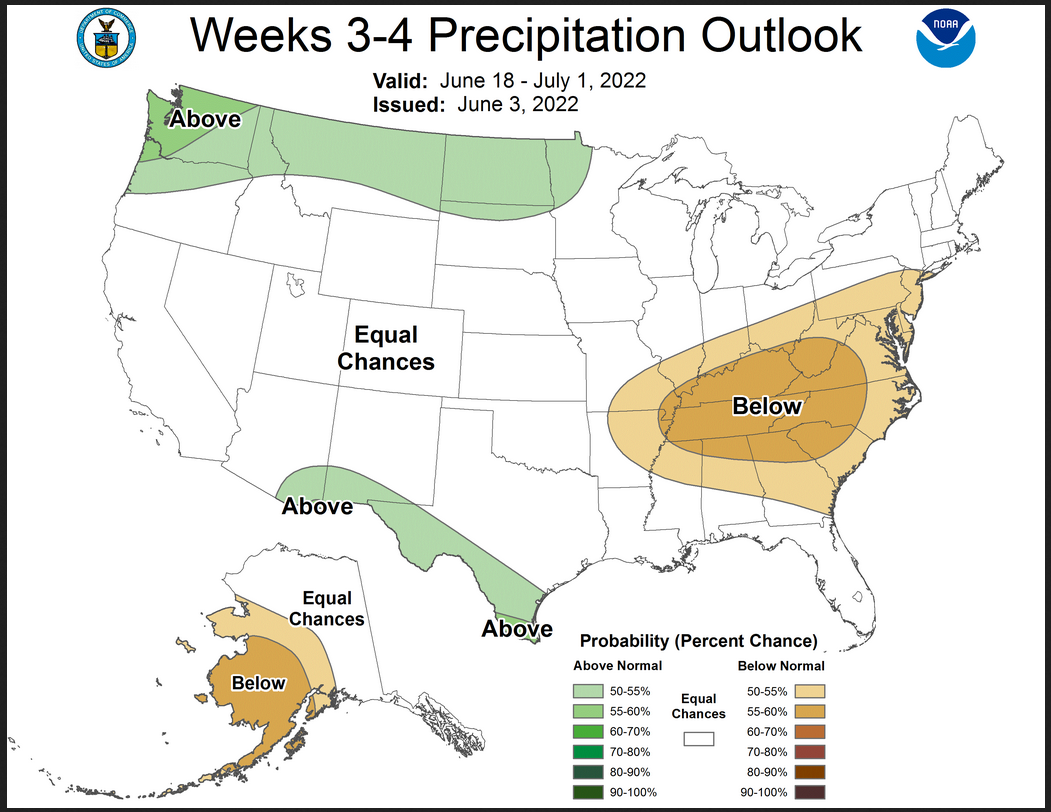
NOAA Discussion Explaining the Week 3- 4 Outlook
Week 3-4 Forecast Discussion Valid Sat Jun 18 2022-Fri Jul 01 2022
La Niña conditions persist across the tropical Pacific, while the Madden-Julian Oscillation (MJO) became more coherent and strengthened at the beginning of June. The GFS and ECMWF ensemble means depict the MJO propagating eastward over the Western Hemisphere during early June and then reemerging across the Indian Ocean. Although the MJO typically has less influence on the mid-latitude circulation pattern during the warm season, lagged composites (using RMM phase 8) are consistent with the current and evolving pattern during the next two weeks.
Also, as the MJO shifts eastward over the Western Hemisphere, a favorable environment for tropical cyclone (TC) development is forecast across the western Caribbean Sea, Bay of Campeche, and southern Gulf of Mexico during mid-June. Along with La Niña and MJO composites, the Week 3-4 temperature and precipitation outlooks are based on dynamical model forecasts from the NCEP CFS, ECMWF, and JMA, and SubX multi-model ensemble (MME) of experimental and operational ensemble prediction systems. Soil moisture conditions were also a factor in the temperature outlook.
The GFS and ECMWF ensemble means depict an amplifying 500-hPa ridge (trough) over the western (eastern) U.S. during early to mid-June. However, this pattern appears to be transient as the amplitude of the ridge and trough decreases beyond the early part of week-2, signaling a longwave pattern change by week-3. The ECMWF, GEFS, JMA, and the MME solutions are in good agreement on the 500-hPa pattern, featuring a trough with negative height anomalies over the Pacific Northwest and broad ridging with an expansive area of positive height anomalies covering much of the southwestern, central, and eastern contiguous U.S. (CONUS).
This predicted 500-hpa pattern during late June closely resembles what persisted throughout much of May and is also consistent with MJO composites. The longwave pattern along with multiple dynamical model solutions supports elevated probabilities for below-normal temperatures across the Pacific Northwest with above-normal temperatures more likely throughout much of the southern tier of the CONUS and from the Mississippi River to the East Coast. Equal chances (EC) for below or above normal temperatures are forecast for the northern Great Plains, due in part to high soil moisture across much of the Dakotas. Conversely, low soil moisture was a contributing factor in the enhanced probabilities for above-normal temperatures across the Southwest and southern High Plains. The slight decrease in probabilities closer to the Rio Grande River is due to the expectation of easterly waves with an increased chance of above normal precipitation.
The anomalous 500-hPa trough favors above-normal precipitation from the Pacific Northwest eastward to the northern Rockies and northern Great Plains. Due to either a dry climatology or model differences, EC is forecast for California and the Great Basin. The GEFS and ECMWF models favor a drier outcome across the central to southern Great Plain along with the Corn Belt while the JMA tilts wetter. Given this varying model guidance and uncertainty inherent in convective rainfall during late June, EC is forecast for a majority of the Great Plains and Corn Belt. Based on positive 500-hPa height anomalies and good agreement among dynamical model solutions, below-normal precipitation is most likely for the Ohio and Tennessee Valleys, Mid-Atlantic, and parts of the Southeast.
Predicted above-normal temperatures over the Southwest, preceding the week 3-4 period, may help to initiate the onset of the North American Monsoon by the end of June. In addition, dynamical models indicate the 500-hPa ridge axis shifting northward over the Southwest from weeks 3 to 4 and the large-scale pattern over the mid-latitudes and subtropics is conducive for easterly waves to emerge from the Gulf of Mexico and then progress northwestward across the Rio Grande Valley. Due to these expected factors and support from dynamical model output, above-normal precipitation is favored for parts of the western Gulf Coast, Rio Grande Valley, and Southwest.
The SubX MME depicts increased probabilities for above-normal temperatures throughout Hawaii with the largest probabilities to the northwest, closer to ongoing positive sea surface temperature anomalies. The Week 3-4 precipitation outlook leans dry, based on the SubX MME and is also consistent with the expectation that the suppressed phase of the MJO crosses the Pacific during the latter half of June.
Visual Consistency Testing to Determine if the Monthly Outlook is Consistent with the Concatenation of the Partial Month Outlooks.
What I am going to try to do is show the 5-day Outlook, 6 – 10 day Outlook, 8 – 14 day Outlook, and Week 3-4 Outlook. When this was presented on Tuesday (read article by clicking here. https://econcurrents.com/2022/06/01/noaa-updates-its-june-outlook-may-31-2022-quite-a-big-change-in-twelve-days/ we had 24 days of Outlooks out of 30 days in June. So it was pretty good. I indicated at that time that we might update this analysis after the next Weeks 3 -4 Update that was to be issued this coming Friday. Now we have 28 days of partial month outlooks plus (not shown) is three days of weather results. So we now have the entire month of June covered.
I am going to show small images. You should be able to click on them to make them larger. I also think that they will update when you click on them. Thus you have a weather forecasting system here.
Let’s see what we get
First Temperature
| Maximum Temperature Day 3 | Days 6 – 10 | Days 8 – 14 | Weeks 3-4 |
 |
 |
 |
 |
There is a fair amount of variation throughout the month.
And then Precipitation
| Cumulative Days 1 – 5 | Days 6 – 10 | Days 8 – 14 | Weeks 3-4 |
 |
 |
 |
 |
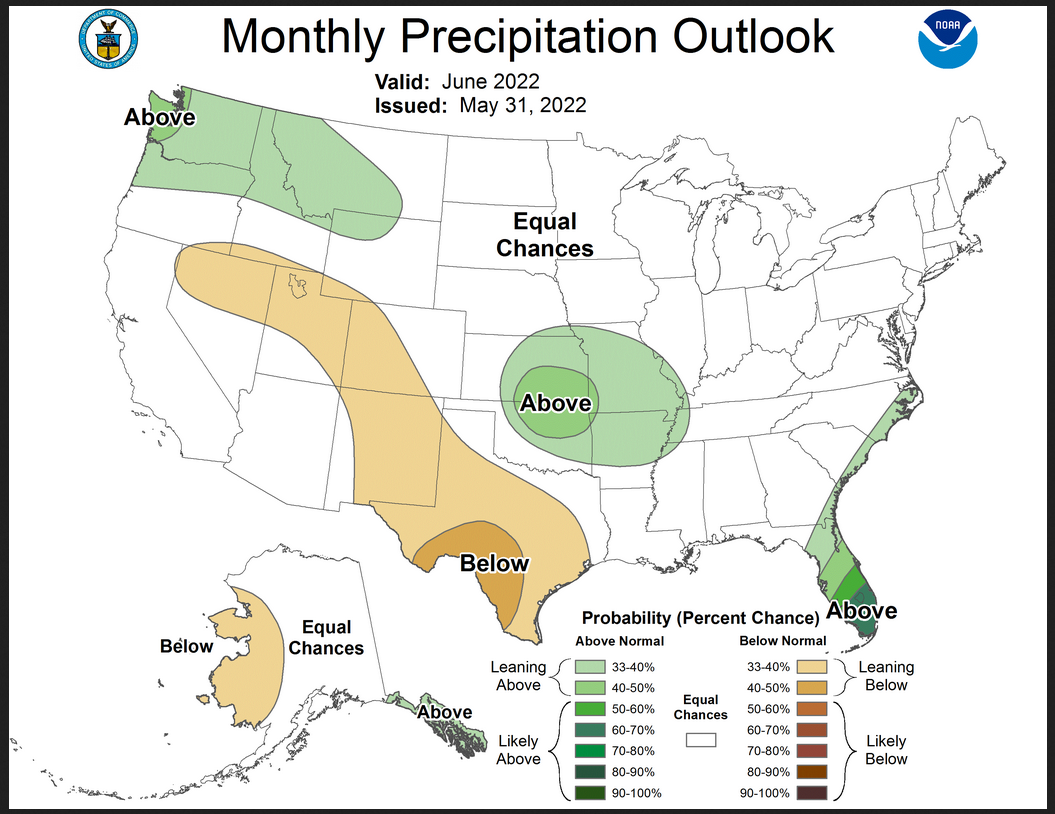
At this point in time, we have 28 days of short-term forecasts for June which has 30 days. Plus not shown we have three days of actual weather results.
The Outlook for the month seems to be mostly consistent with the short-term forecasts. The new information on the extreme southern part of the Southwest is new information.
If you click on the above images (not the Outlook for the Month), they should update. if not you can click on the below urls. You may have to hit the back arrow to return to the article.
Temperature
Day 5 Maximum Temperature https://i0.wp.com/www.wpc.ncep.noaa.gov/medr/DAY3_MAX_filled.gif?ssl=1
6 – 10 Temperature http://www.cpc.ncep.noaa.gov/products/predictions/610day/610temp.new.gif
8- 14 Temperature http://www.cpc.ncep.noaa.gov/products/predictions/814day/814temp.new.gif
Weeks 3 – 4 Temperature https://www.cpc.ncep.noaa.gov/products/predictions/WK34/gifs/WK34temp.gif
Precipitation
Days 1 – 5 Cumulative Precipitation https://i0.wp.com/www.wpc.ncep.noaa.gov/qpf/p120i.gif?ssl=1
Day 6 – 10 Precipitation http://www.cpc.ncep.noaa.gov/products/predictions/610day/610prcp.new.gif
Days 8 – 14 precipitation http://www.cpc.ncep.noaa.gov/products/predictions/814day/814prcp.new.gif
Weeks 3 – 4 Precipitation http://www.cpc.ncep.noaa.gov/products/predictions/WK34/gifs/WK34prcp.gif
Possible Tropical Events
This provides a five-day outlook. The image is up to date as of when the article was published. You can refresh it by clicking on it. If that does not work, simply click here. https://www.nhc.noaa.gov/xgtwo/two_atl_5d0.png
| It is necessary to do that since this is a published article. |
First the Atlantic
And then the Eastern Pacific
With La Nina conditions we expect more activity in the Eastern Pacific than the Atlantic for June. I expect this image to update but if not you can click on it or if that does not work simply click here https://www.nhc.noaa.gov/xgtwo/two_pac_5d0.png
| I hope you found this article interesting and useful |
