Change Appears to be Coming
Today is the third Thursday of the month so right on schedule NOAA has issued what I describe as their Four-Season Outlook. The information released also includes the Early Outlook for the single month of June plus the drought outlook for the next three months. I summarize the information issued and provide links to additional maps. Additionally, I have included quite a bit in this article. I want to remind everyone that last Thursday NOAA issued their ENSO outlook and that has a lot of influence on their Seasonal Outlook. The Seasonal Outlook generally reflects La Nina conditions initially with no clear indication of when this La Nina will end. There could be a triple-dip La Nina. That is not the most likely scenario but certainly can not be discounted. There is fairly good news with respect to the North American Monsoon (NAM).
The exact location of the Drought seems to be shifting a bit especially after this Summer. See the set of twelve overlapping three-month maps and my comments for details.

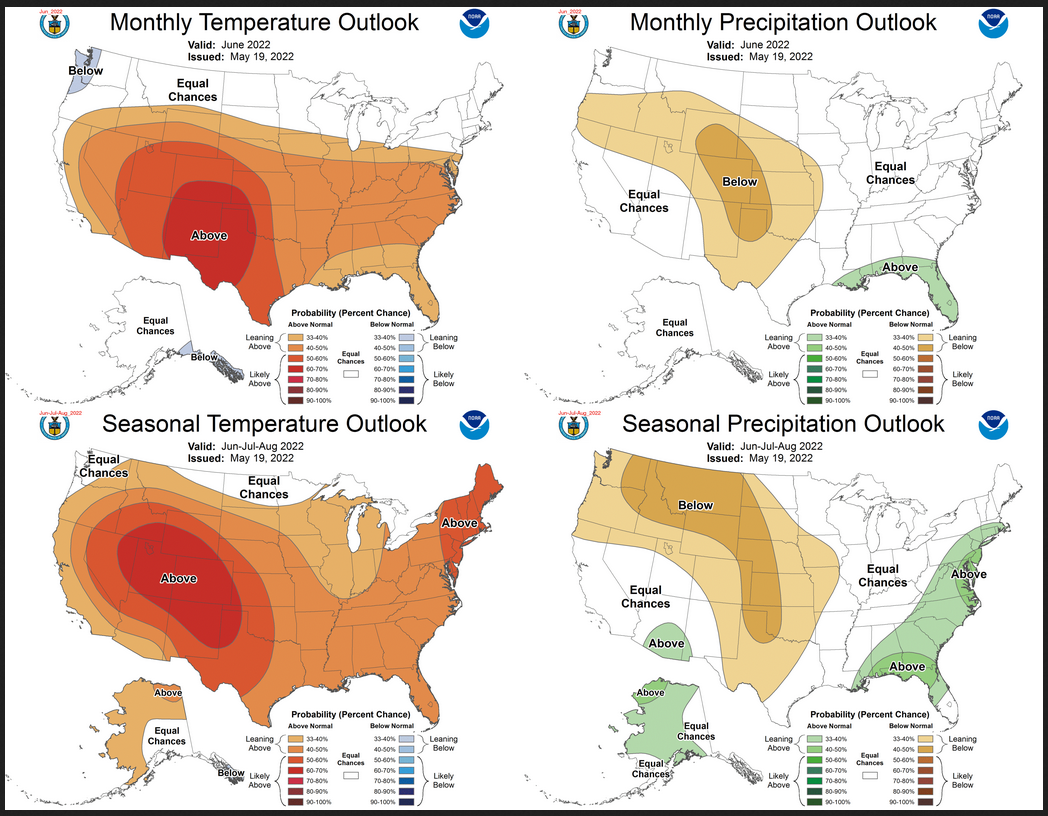
Combination Early Outlook for June and the Three-Month Outlook
Notice that for temperature, the June and three-month outlooks are similar but not as much as recently. This suggests that the July/August outlook is also similar. But for precipitation, there is a bit more difference between the three-month and single month of June Outlook. This means that July/August will need to be a bit different than the June Outlook for the three months to average out to the three-month outlook.
| For both temperature and precipitation, if you assume the colors in the maps are assigned correctly, it is a simple algebra equation to solve the month two/three anomaly probability for a given location = (3XThree-Month Probability – Month One Probability)/2*. So you can derive the month two/three outlook this way. You can do that calculation easily for where you live or for the entire map. |
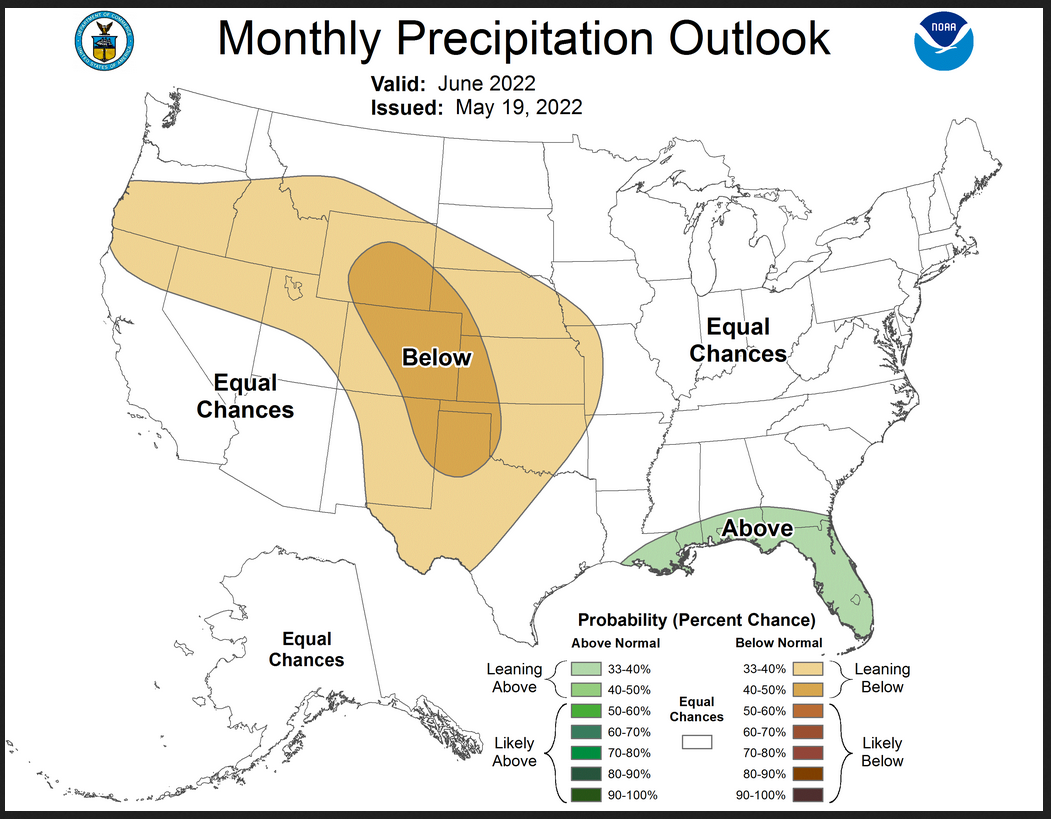
Here are larger versions of the Temperature and Precipitation outlook maps for the single month of June..
The maps are pretty clear in terms of the outlook.
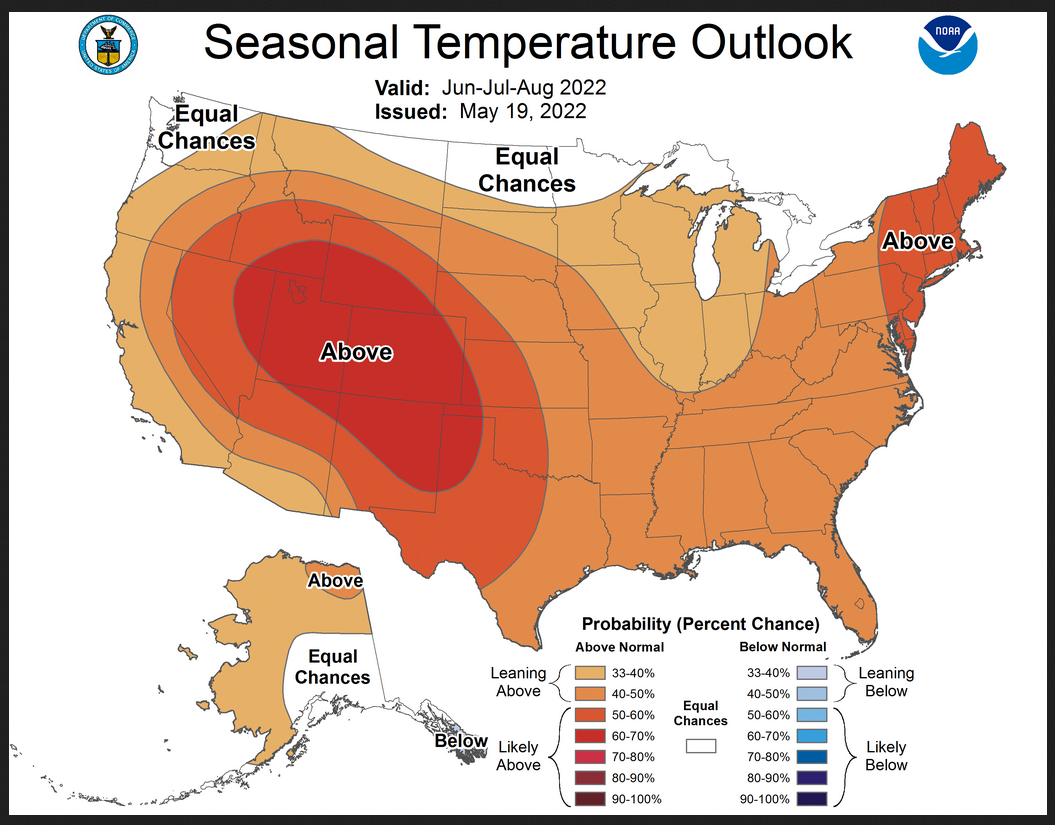
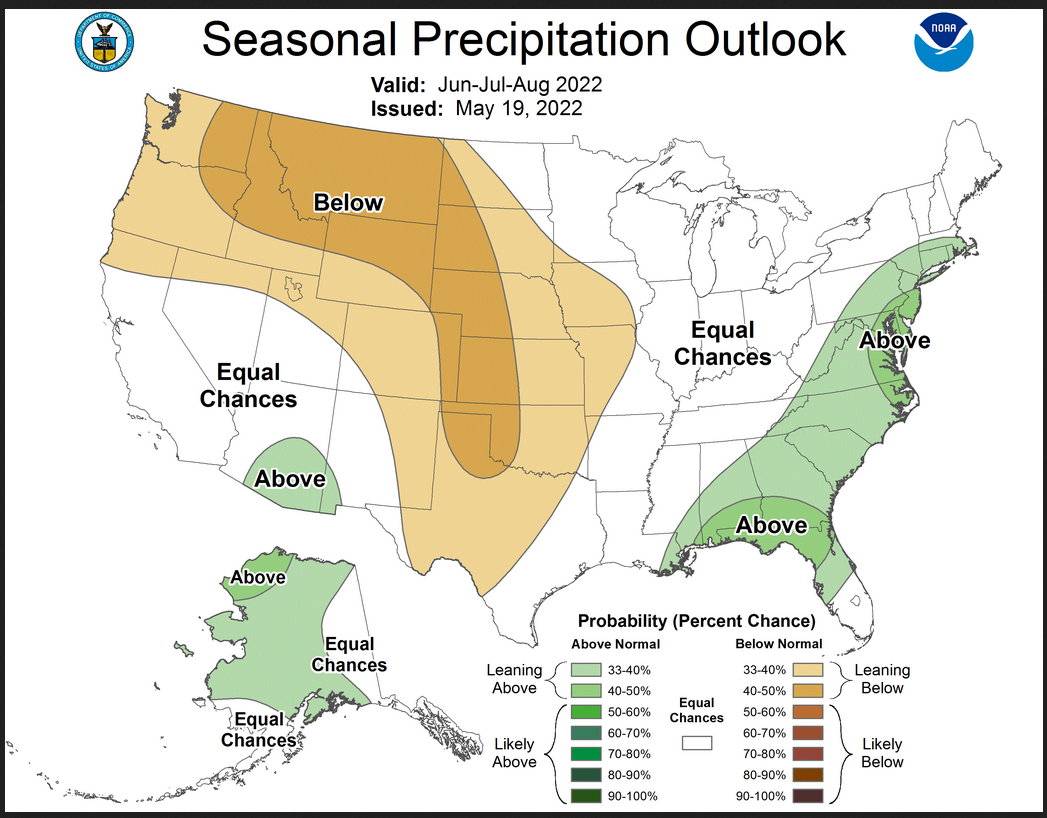
And here are large versions of the three-month JJA Outlook maps starting with temperature followed by precipitation.
The maps are larger versions of what was shown in the first graphic that had smaller versions of all four of these maps.
Drought Outlook

Looking out at Four Seasons.
Twelve Temperature Maps
![]() Notice that this presentation starts with July/August/September (JAS) since JJA is considered the near-term and is covered earlier in the presentation.
Notice that this presentation starts with July/August/September (JAS) since JJA is considered the near-term and is covered earlier in the presentation.
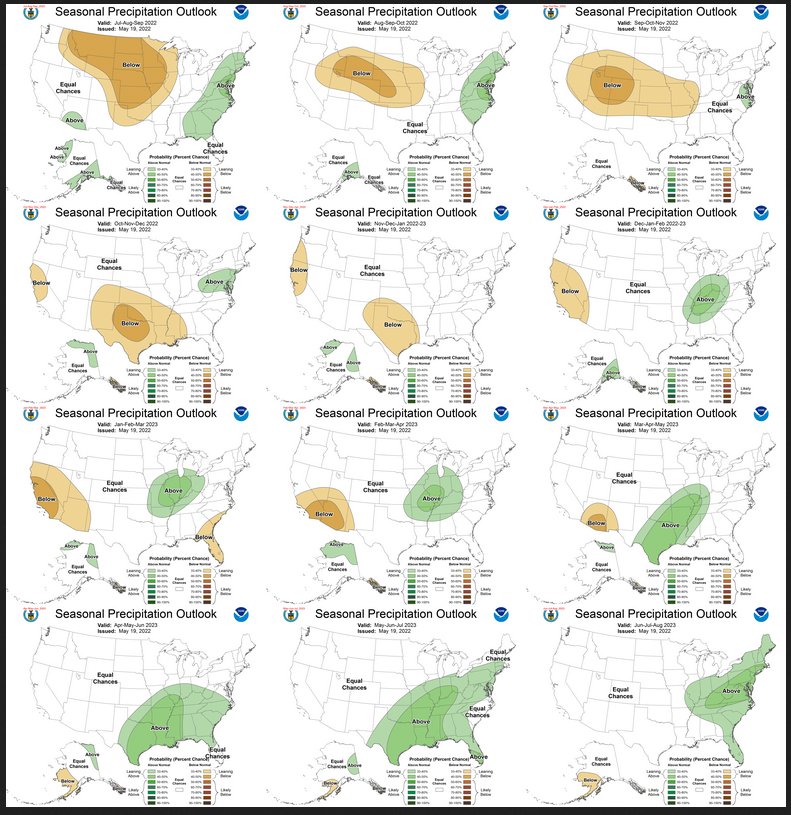
Twelve Precipitation Maps
Similar to Temperature in terms of the organization of the twelve overlapping three-month outlooks.
North American Monsoon (NAM)
The JJA Outlook is shown earlier. But that does not extend through the Monsoon. So I am showing two additional Outlook Maps that extend farther in time.
But first I will repeat the Outlook for the next three months.
Then the following overlapping three-month periods
|
|
|
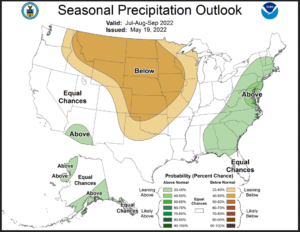
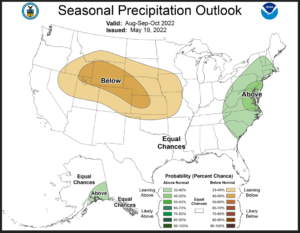
July through September covers the main part of the North American Monsoon (NAM) and you can see the forecasts is for a slightly better than average monsoon but the moisture is pretty much blocked from extending much beyond Arizona and New Mexico. Utah and Colorado may get some benefits as may Texas. The next map shows that the blocking high dry area continues into October.
NOAA does not provide single-month Outlooks beyond the subsequent month so it is a little hard to interpret a three-month outlook. But if you spend some time looking at these maps you get an idea of what NOAA thinks will happen. That blocking dry area north of Arizona and New Mexico which is probably a high-pressure area limits the impact of the Monsoon on other states.
NOAA Discussion
Maps tell a story but to really understand what is going you need to read the discussion. I combine the 30-day discussion with the long-term discussion and rearrange it a bit and add a few additional titles (where they are not all caps the titles are my additions). Readers may also wish to take a look at the article we published last week on the NOAA ENSO forecast. That can be accessed here. https://econcurrents.com/2022/04/15/noaa-updates-their-enso-forecast-la-nina-looks-to-continue/
I will use bold type to highlight some things that are especially important. My comments, if any, are enclosed in brackets [ ].
CURRENT ATMOSPHERIC AND OCEANIC CONDITIONS
Equatorial SSTs and the tropical Pacific atmosphere are consistent with La Niña. During the last 4 weeks, below average SSTs strengthened in the central Pacific Ocean, and recent observed weekly SST departures reached -1.1 degrees Celsius in the NINO3.4 region. Subsurface temperature anomalies (averaged from 180-100W and 0-300 meters) have remained negative since late February, but have been increasing since mid-March. During the last two months, negative subsurface temperature anomalies expanded across the central and eastern Pacific Ocean, while positive anomalies were observed in the western and central Pacific at depth. During the last 30 days, low-level (850-hPa) easterly wind anomalies were evident over the equatorial Pacific Ocean, with enhanced convection over the Philippines and suppressed convection over the central and Western Pacific. These observations are consistent with La Niña conditions.
The Real-time Multivariate Madden Julian Oscillation (RMM) signal recently depicted an elevated amplitude but propagation speed more consistent with a strong Kelvin Wave than a Madden Julian Oscillation (MJO) event. Forecasts of MJO evolution from the Global Ensemble Forecast System (GEFS) depicts a fast eastward propagating signal consistent with a Kelvin Wave, and large uncertainty. Forecasts of MJO evolution from the European Centre for Medium-Range Weather Forecasts (ECMWF) depict a meandering signal across the west-central Pacific, but destructive interference from La Niña is expected to limit eastward propagation.
SSTs along the southern coast of Alaska have shifted from neutral to weakly anomalously cold in recent observations, and cold SSTs have strengthened along the California coast. Gulf of Mexico SSTs, and SSTs near the New England coast remain anomalously warm. In contrast, anomalously cold SSTs are observed off the Mid-Atlantic coast.
PROGNOSTIC DISCUSSION OF SST FORECASTS
The International Research Institute for Climate and Society (IRI) / Climate Prediction Center (CPC) plume average of forecasts for the Niño-3.4 SST region from the last month depicts decreasing odds of La Niña into the late northern hemisphere summer (58% chance in August-October 2022), and increased odds through Northern Hemisphere fall and early winter 2022 (61% chance). Model guidance from the North American Multi-Model Ensemble (NMME) now hints at a strengthening of La Niña conditions again in the fall and upcoming winter. Forecaster consensus predicts borderline La Niña conditions in the Northern Hemisphere summer and increasing odds into the fall and early winter.
30-DAY OUTLOOK DISCUSSION FOR JUNE 2022
The June 2022 temperature and precipitation outlooks are based on dynamical model guidance (including the North American Multi-Model Ensemble (NMME) and the week 3-4 model solutions), statistical tools, current soil moisture conditions, and La Niña composites. The Madden-Julian Oscillation (MJO) remains weak as multiple Kelvin waves (KWs) continue to propagate rapidly eastward over the global tropics. The MJO is not expected to provide any significant influence on the mid-latitude circulation pattern across North America during June. However, the passage of KWs over the Western Hemisphere from late May into June and its potential contribution to the development of an early season tropical cyclone across the western Caribbean Sea was considered as a factor in the precipitation outlook.
Temperature
During early to mid-May, anomalous 500-hPa ridging resulted in much above normal temperatures throughout the southern Great Plains with positive anomalies of more than 6 degrees F across the western half of Texas. Although there could be brief periods of weakening of this subtropical riding, ensemble means depict the anomalous 500-hPa ridging over the southern tier of the CONUS likely persisting through the first half of June. Based on good agreement among dynamical and statistical tools, above-normal temperatures are favored across the southern two-thirds of the CONUS. The largest probabilities (above 60 percent) are forecast for western Texas and New Mexico, coinciding with the lowest soil moisture. Conversely, anomalously wet soil moisture was one reason for equal chances (EC) of below, near, or above-normal temperatures across much of the northern Great Plains and upper Mississippi Valley. Also, the calibrated NMME supports EC for the northern tier of the CONUS. The EC forecast along much of the West Coast was due in part to negative sea surface temperature anomalies nearby. The week 3-4 tools, covering the first two weeks of June, along with most of the inputs to the NMME support slightly elevated probabilities of below normal temperatures across western parts of Oregon and Washington along with the Alaska Panhandle. Due to conflicting and weak signals among the tools, EC is forecast for the remainder of Alaska.
Pecipitation
The NMME supports elevated probabilities of below-normal precipitation across much of the central to southern Great Plains, extending westward to parts of the Great Basin, Pacific Northwest, and northern California. The slightly larger probabilities, focused from southern Wyoming southward to the Texas Panhandle, was due to La Niña composites and week 3-4 tools. Since June is typically a dry time of year for southern California and the desert Southwest, EC was forecast for these areas. Regardless of any effects from a potential early season tropical cyclone, the GEFS and ECMWF models depict broad upper-level divergence over the Gulf of Mexico and adjacent areas of the northern Gulf Coast and Florida during early to mid-June. This is expected to promote enhanced sea breeze convection. Based on this expectation and support from the NMME, above-normal precipitation is slightly favored for Florida and areas along and close to the northern Gulf Coast. For the remainder of the eastern and northern tier of the CONUS and Alaska, a large area of EC was necessary in the June precipitation outlook due to weak signals among the dynamical model solutions. This large coverage of EC and prospects for an early season TC, potentially emerging from the western Caribbean Sea, will be reevaluated with the updated June outlook, released on May 31.
SUMMARY OF THE OUTLOOK FOR NON-TECHNICAL USERS (Focus on JJA 2022)
Temperature
The June-July-August (JJA) 2022 temperature outlook depicts elevated odds of above normal seasonal mean temperatures for most of the U.S., including northern and western Alaska, with the highest probabilities over the western half of the nation. The greatest likelihood for above normal temperatures are located in the Central Great Basin through the Central and Southern Rockies. Equal chances of above, near, or below normal temperatures are forecast for the Pacific Northwest, parts of the Northern Plains and Upper Mississippi Valley where probabilities for each category of seasonal mean temperatures are expected to be similar to climatological probabilities.
Precipitation
The JJA 2022 precipitation outlook favors below normal precipitation stretching from the Pacific Northwest into the Northern Plains, and southward into the Southern Plains. Above normal precipitation is more likely for parts of Alaska, the Southwest, and the Eastern Seaboard. EC of above, near, or below normal precipitation are forecast for areas where probabilities for each category of seasonal accumulated precipitation amounts are expected to be similar to climatological probabilities.
ENSO
A La Niña advisory remains in effect and Equatorial sea surface temperatures (SSTs) are below average across most of the Pacific Ocean, and the tropical Pacific atmosphere is consistent with a La Niña. La Niña is favored to continue through the Northern Hemisphere summer (58% chance in August-October 2022), with slightly increased odds through Northern Hemisphere fall and early winter 2022 (61% chance).
BASIS AND SUMMARY OF THE CURRENT LONG-LEAD OUTLOOKS
PROGNOSTIC TOOLS USED FOR U.S. TEMPERATURE AND PRECIPITATION OUTLOOKS
Dynamical model forecasts from the NMME and Copernicus (C3S) multi-model ensemble systems are used extensively for the first six leads [Authors Comment: it is a surprise that they are using dynamical models that part into the outlook] when they are available as was the objective, historical skill weighted consolidation, that combines both dynamical and statistical forecast tools. Current soil moisture conditions played a role in the construction of these outlooks. Recent soil moisture content is abnormally dry for much of the southwestern Continental United States (CONUS), though recent precipitation accumulation in the Northern Plains and Upper Mississippi Valley has increased soil moisture content in these regions. Potential typical impacts known to be associated with La Niña summers are utilized in preparation of the outlook via techniques including composite analysis and regressions anchored to NINO3.4 SSTs. Statistical guidance such as the global SST based Constructed Analog (CA), experimental Calibration, Bridging, and Merging (CBaM) guidance, and long term temperature and precipitation trends played a role in many of the outlook seasons. Coastal SSTs also are considered, especially at the early leads.
PROGNOSTIC DISCUSSION OF OUTLOOKS – JJA 2022 TO JJA 2023
TEMPERATURE
The JJA 2022 temperature outlook favors above normal temperatures for much of the CONUS. The greatest odds for above normal temperatures (60 to 70 percent) are located over the Central Great Basin through the Central and Southern Rockies given consistency among dynamical model suites such as NMME and C3S, statistical tools, decadal temperature trends , and anomalously dry soil moisture. In contrast and at odds with warmer guidance from C3S, anomalously wet soil moisture in the Northern Plains and Upper Mississippi Valley led to EC favored for the region. EC is also favored for the Pacific Northwest, consistent with expected La Niña conditions. Elevated odds for above normal temperatures are depicted over New England reflecting decadal trends and anomalously warm SSTs, as well as high confidence on above normal temperatures in NMME. Dynamical and statistical model guidance are consistent over Alaska and favor overall warm probabilities for much of the state. The highest odds of above normal temperatures are in the northeastern part of the state consistent with warm decadal temperature trends . EC is favored for southern Alaska given recent cool SST anomalies off the southern coast.
Enhanced probability of above normal temperature persists through July-August-September (JAS) 2022 through October-November-December (OND) 2022 across much of the CONUS based on statistical and dynamical model guidance. Wet soil moisture led to damped above normal probabilities in parts of the Great Lakes and Ohio Valley in JJA 2022 (33 to 40 percent), but the region is expected to warm slightly from JJA 2022 to JAS 2022 (40 to 50 percent chance of above normal temperatures) based on consistency in dynamical and statistical model guidance. Probability of above normal temperatures decreases to 33 to 40 percent in August-September-October (ASO) 2022 in the Middle Mississippi, Ohio, and Tennessee Valley regions as decadal trends shift to neutral and dynamical models depict decreased odds of above normal temperatures. Dynamical models also depict decreased odds of above normal temperatures in the Central Great Basin and Southwest (40 to 50 percent) in JAS 2022 through OND 2022 relative to JJA 2022. Dynamical models and decadal trends favor elevated odds of above normal temperatures in northern Alaska through OND 2022.
Statistical guidance from the global SST based Constructed Analog (CA), decadal trends, ENSO composites, and skill-based statistical consolidation were the primary tools considered from November-December-January (NDJ) 2022-2023 through JJA 2023. Elevated odds of above normal temperatures remain for much of the CONUS in NDJ 2022-2023, with the highest probabilities in the western US through the Southwest and along the Eastern Seaboard (40 to 50 percent), though probabilities have been reduced given the absence of dynamical model information. Decadal trends , ENSO, and statistical tools continue to favor above normal temperatures in the western US and along the Eastern Seaboard through JJA 2023. Trend and potential for La Niña teleconnections led to a slight tilt toward below normal probabilities in the Pacific Northwest and Northern Plains in February-March-April (FMA) 2023 through April-May-June (AMJ) 2023. Finally, ENSO, trend, and statistical consolidation tools generally favor above normal temperatures for much of Alaska through JJA 2023, and below normal temperatures over the Alaska panhandle.
PRECIPITATION
The JJA 2022 precipitation outlook favors below normal seasonal precipitation amounts for the region stretching from the Northwestern U.S. across the Central Plains and Southern High Plains given low soil moisture anomalies and consistency among dynamical and statistical models that favor probabilities of below normal precipitation over the region. Over the Southwest, slightly elevated odds of above normal precipitation are favored given the dry pattern over the Plains, which is anti-correlated with the precipitation pattern over the Southwest and can be associated with potential for an early Monsoon. Given recent high soil moisture anomalies in parts of the Northern Plains and Upper Mississippi Valley, EC is favored in the region. Above normal precipitation is favored along the Eastern Seaboard consistent with dynamical model guidance from NMME and C3S as well as statistical tools. Dynamical model guidance from NMME, C3S, and CFS along with decadal trends support enhanced odds of above normal precipitation over the North Slope, Interior Basin, and South Coast of Alaska.
Throughout the summer and into late fall 2022, below normal precipitation is favored to persist across much of the Plains and interior Northwest. A slight tilt toward above normal precipitation is maintained through JAS 2022 in the Southwest as we expect an enhanced monsoon season given the anti-correlated precipitation pattern. Slightly elevated chance of above normal precipitation remains along the Eastern Seaboard through ASO 2022 consistent with ENSO and trend tools, which diminishes in size consistent with trend in SON 2022 through OND 2022. Above normal precipitation trends dominate the forecast for the Ohio River Valley while below normal precipitation trends dominate the forecast for the Southwest in early 2023. April-May-June (AMJ) 2023 through JJA 2023 forecasts depict elevated odds of above normal precipitation in the Southeast owing mainly to ENSO and decadal trends . Trends support a slight tilt toward above normal precipitation over Northern Alaska through FMA 2023. A slight tilt toward below normal is favored in dynamical models over the Alaska panhandle in September-October-November (SON) 2022, which persists through AMJ 2023 supported by trends .
What did NOAA mean by Kelvin Waves?
NOAA was not as clear as they could have been when they talked about KW in the discussion in terms of whether they were talking about Atmospheric or Oceanic Kelvin Waves.
From the discussion:
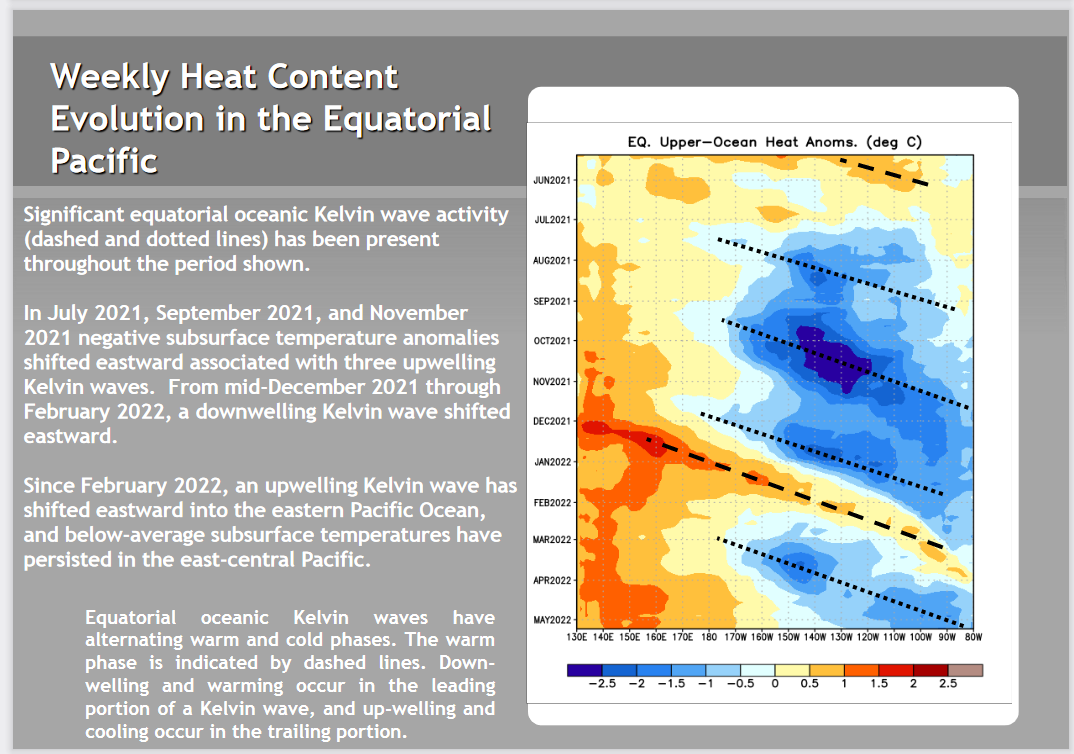
The Madden-Julian Oscillation (MJO) remains weak as multiple Kelvin waves (KWs) continue to propagate rapidly eastward over the global tropics.
I assumed it was Atmospheric and the below graphic confirms it as it does not show multiple oceanic Kelvin waves. There is another graphic I could have provided but it is harder to read and it shows the atmospheric Kelvin waves.
ENSO Forecast
It is useful to review the ENSO forecasts used by NOAA to produce this Four Season Outlook. We reported on that last week and you can read that article by clicking here https://econcurrents.com/2022/05/13/noaa-updates-the-enso-forecast-on-may-12-2022-chances-of-a-la-nina-three-peat-are-61/
The key information used by NOAA follows.

and

This led to the conclusion that the chances of La Nina entending in 2023 were 61%. I mention in that article that it was a minority position among meteorological agencies.
But now we have later information

It is not an enormous change and there are reasons why the second forecast often differs from the first forecast even though in this case they were just a week apart.
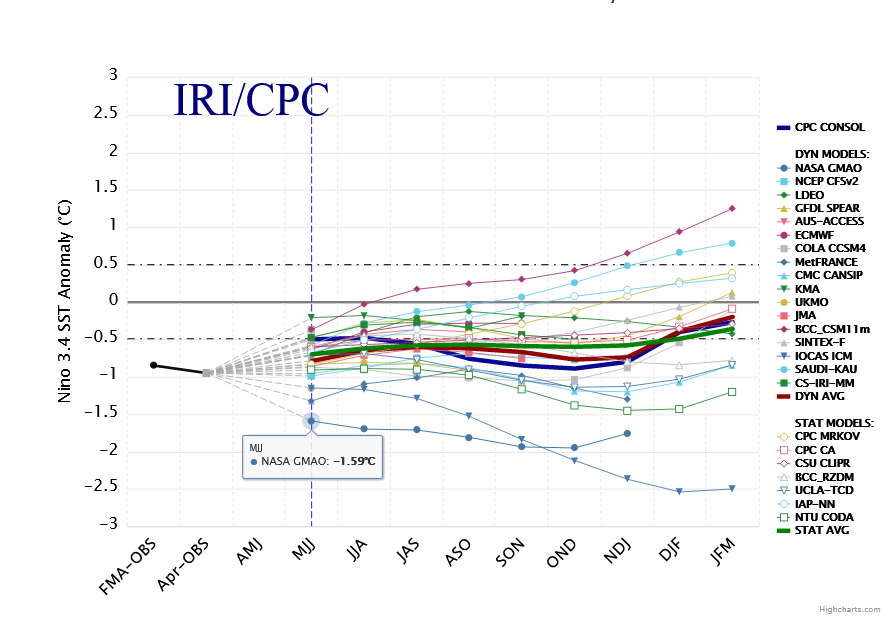 And here is what is called the plume of model forecasts. When NOAA did their analysis on May 12, 2022, they only had the prior month’s version of the above to work with. We now have a more recent version and NOAA had it also but by reading the Discussion NOAA released with their Outlook on Thursday, they did not use this new information which is not surprising since it takes a few days to put it all together and they are unable to utilize information released on the same day. One wonders if there is anyone who coordinates the work of NOAA. But at any rate, this information which is also subject t change suggests that NDJ is when La Nina pivots towards ENSO Neutral.
This raises questions about the validity of the NOAA Outlooks in early 2023.
Week 3-4 Analysis
|
|
|
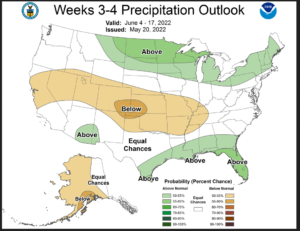
Week 3-4 Forecast Discussion Valid Sat Jun 04 2022-Fri Jun 17 2022
La Niña conditions are currently present across the tropical Pacific Ocean with below average sea surface temperatures (SSTs) across most of the central and eastern equatorial Pacific Ocean. Low-level easterly wind anomalies are evident over most of the equatorial Pacific Ocean, while upper-level westerly wind anomalies and an anomalous cyclonic couplet were observed over the central and east-central tropical Pacific Ocean. The Real-time Multivariate Madden Julian Oscillation (RMM) index depicts an elevated amplitude across the Maritime Continent, West Pacific and Western Hemisphere during the last two weeks. This is likely due to constructive interference of a Kelvin and Rossby Wave. Dynamical models generally show a high amplitude intraseasonal signal as it propagates eastward to the Western Pacific by the end of week-2. The Week 3-4 temperature and precipitation outlooks are based primarily on dynamical guidance including the GEFS, CFSv2, Canadian, ECMWF, JMA, and the Subseasonal Experiment (SubX) multi-model ensemble (MME) of experimental and operational ensemble prediction systems, with additional considerations for the Madden Julian Oscillation (MJO), El Nino Southern Oscillation (ENSO), decadal climate trends, and the predicted evolution of the pattern from the Week-2 forecast.
Dynamical model 500-hPa height anomaly forecasts during Week 3-4 show a fairly consistent evolution from Week-2 forecasts. A blend of the CFSv2, ECMWF, GEFS, and JMA 500-hPa height pattern forecasts plus a small contribution from the Multivariate Linear Regression (MLR) height forecast based on the RMM index, La Niña, and decadal trends, predicts anomalous troughing and negative 500-hPa height anomalies over parts of the northwestern CONUS. Near to above normal 500-hPa heights are forecast over the remainder of the CONUS. The forecast is near to above normal 500-hPa heights over Mainland Alaska and the Aleutians, while negative 500-hPa height anomalies are forecast across the Alaska Panhandle. Most dynamical models feature above normal 500-hPa heights over Hawaii.
Predicted troughing over the northwestern CONUS favors elevated probabilities for below normal temperatures over the Pacific Northwest eastward across the Northern Rockies and Northern Plains. Near to above normal temperatures are favored over the remainder of the CONUS due to predicted near to above average 500-hPa heights and/or long-term trends, supported by most of the dynamical forecast tools. Above normal temperatures are likely over Mainland Alaska and the Aleutians, underneath forecasted above normal 500-hPa heights, while below normal temperatures are favored over the Alaska Panhandle associated with predicted negative 500-hPa height anomalies .
The Week 3-4 precipitation outlook favors above normal precipitation over parts of the Northern Plains across the Great Lakes and Northeast, due to the predicted troughing and increased potential for frontal activity. Above normal precipitation probabilities are also elevated along the Gulf Coast, parts of Arizona and New Mexico, consistent with most of the dynamical and statistical guidance. Enhanced chances for below normal precipitation is likely from California extending eastward across the Central Rockies, Central Plains, Middle and Lower Mississippi Valley associated with above normal 500-hPa heights. Elevated probabilities of below normal precipitation is favored for Mainland Alaska and the Aleutians due to the above normal 500-hPa heights.
The outlook favors above normal temperatures for the Hawaiian Islands due to above normal 500-hPa heights in the vicinity. Dynamical model guidance from the SubX MME shows increased probabilities for below median precipitation over the Hawaii Islands.
