At the end of every month, NOAA updates their Early Outlook for the following month which in this case is May. They also issue a drought outlook for the following month. We are reporting on that tonight. The updated Outlook is quite different from the Early Outlook which NOAA now calls the Mid-Month Outlook. It is overall less warm and less dry than the Mid-Month Outlook.
We provide partial-month outlooks for the first 27 days of May which allows us to validate if the Monthly Outlook is consistent with the partial month forecasts and it is. We also provide enough information for readers to understand any changes from the Mid-Month Outlook and we try to figure out why these changes were made. Most of the changes are explained in the NOAA discussion which is included in the article. The NOAA discussion describes the changes but does not provide a lot of insight into the reasons for the changes other than a change in the wave pattern that they describe as more troughing in the western Northern Tier. The partial-month forecasts that we have provided show how NOAA thinks this will play out as the weather pattern changes during May.
There is also a short discussion of the ENSO condition and it is looking less likely that there will be a Three-peat of the La Nina but that a near La Nina may be the more likely situation for Fall and Winter. Those forecasts can change but it looks like a marginally better situation with the focus on the words marginally better.

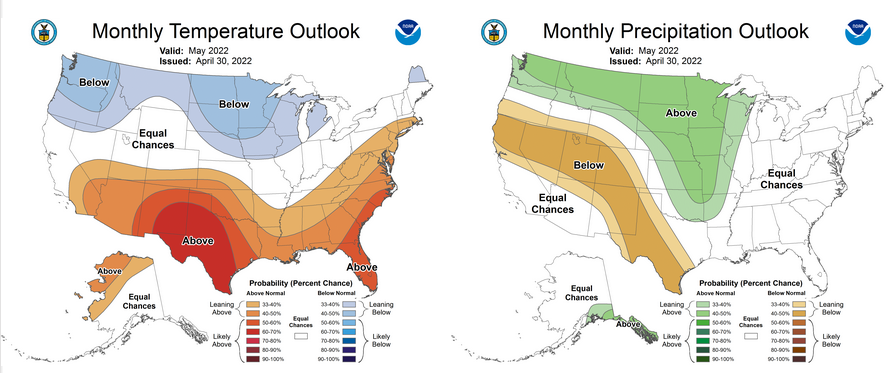
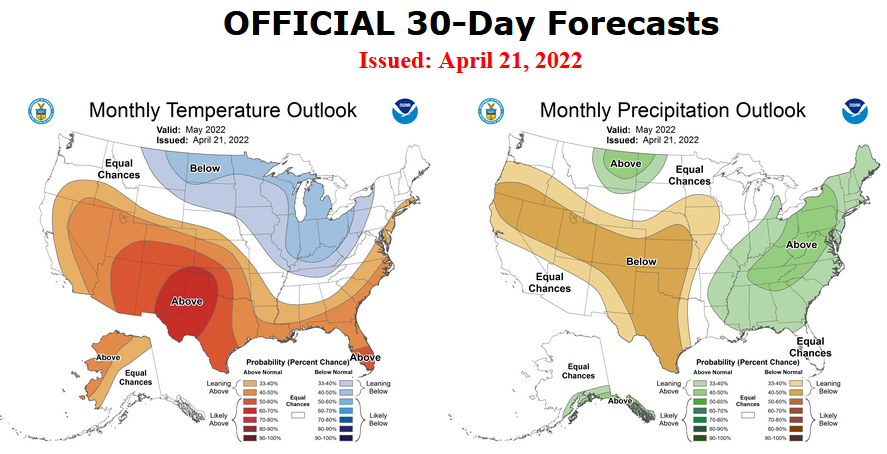
Here is the updated Outlook for May.
Combination of the Updated Outlook for May and Three-Month Outlook
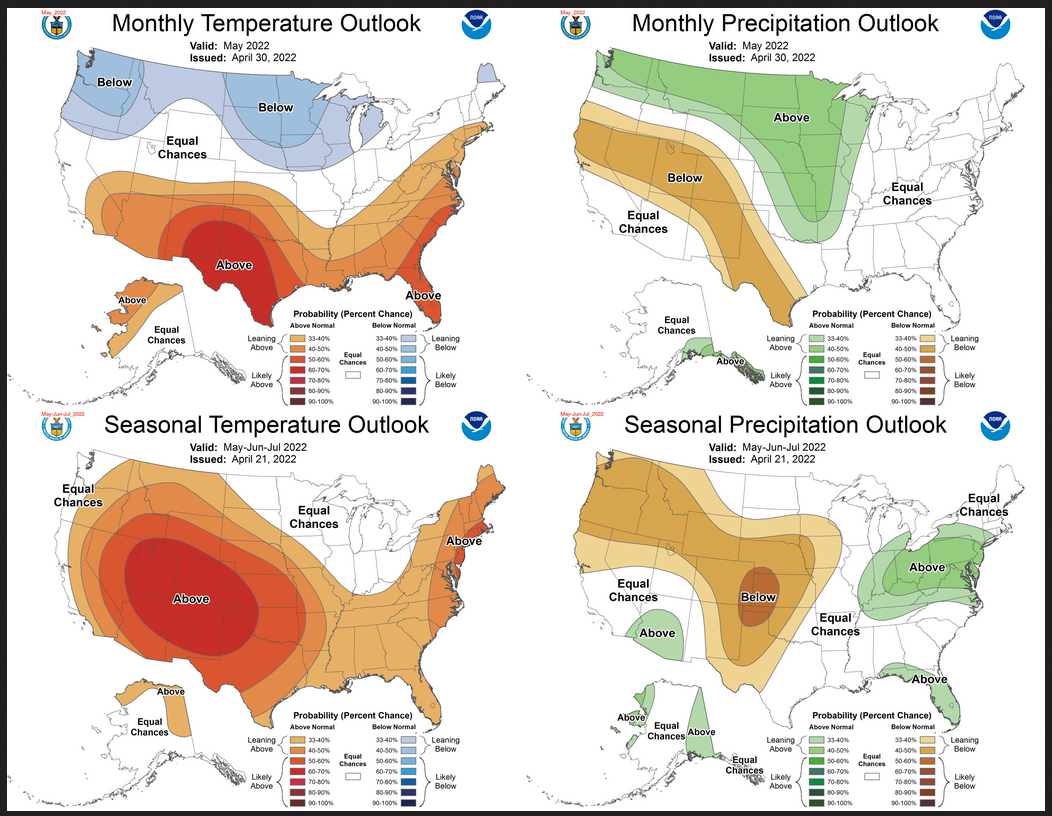
Notice that for both temperature and precipitation, the May Outlook and three-month Outlook are not similar. This suggests that the June/July Outlook if shown would be different than either the May Outlook or the Three-Month Outlook. For temperature, the May single-month Outlook shows a smaller area of above-normal temperatures with most of the Northern Tier being cooler than Normal. For precipitation, the May single-month Outlook shows a wet area in the Northwest extending to the Northern Great Plains that is not in the three-month Outlook There are many other differences also.
| For both temperature and precipitation, if you assume the colors in the maps are assigned correctly, it is a simple algebra equation to solve the month two/three anomaly probability for a given location = (3XThree-Month Probability – Month One Probability)/2*. So you can derive the month two/three outlook this way. You can do that calculation easily for where you live or for the entire map. |
It is important to remember that the May Outlook was updated and the three-month Outlook was issued on April 21. So we always wonder if a change in the one-month outlook suggests that the three-month outlook would need to also be adjusted. I think that in this case, the answer may be yes but I am not going to attempt to second guess NOAA on this.
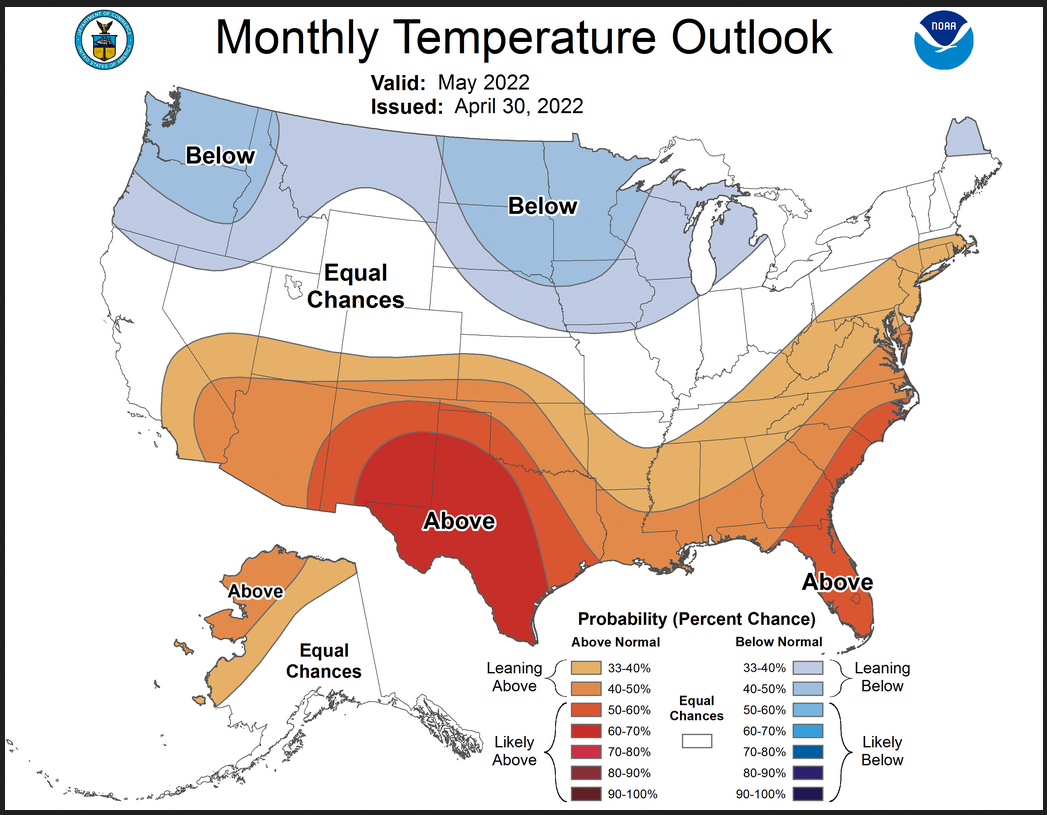
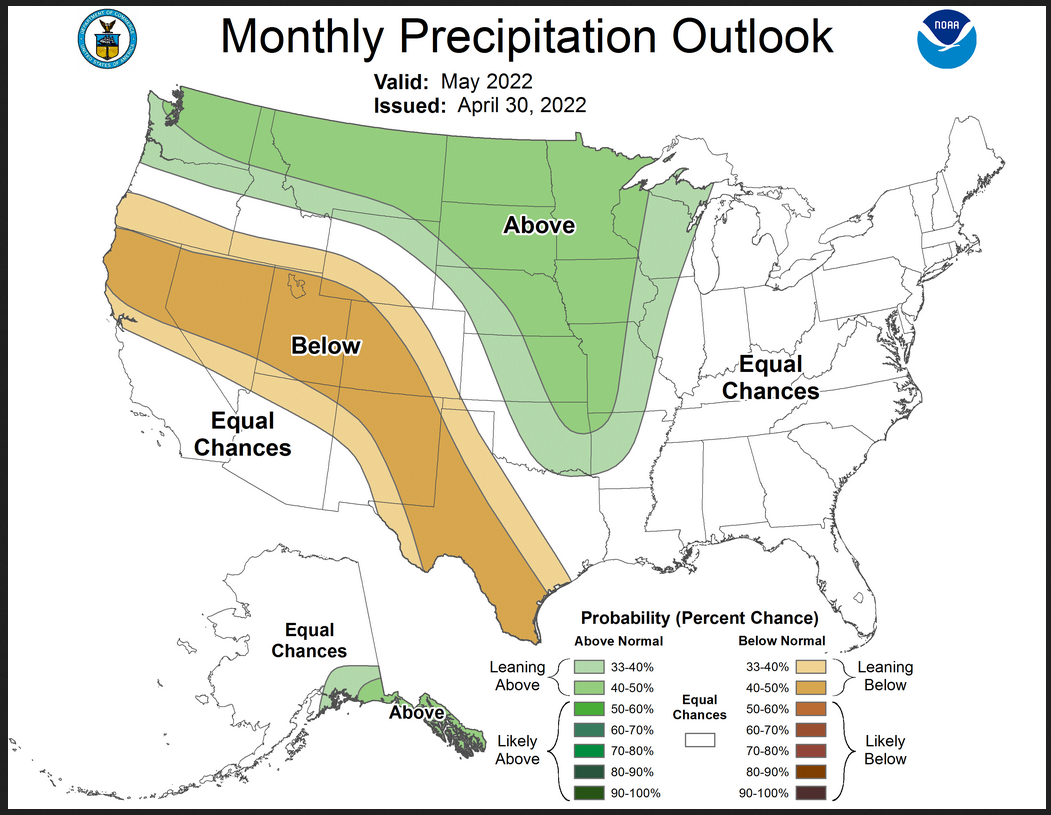
Here are larger versions of the Temperature and Precipitation Outlook maps
NOAA Discussion
30-DAY OUTLOOK DISCUSSION FOR MAY 2022
The update to the May 2022 temperature and precipitation outlook is primarily driven by dynamical model guidance at varying time scales including the short- and medium-range. Latest information from more slowly varying boundary conditions such as soil moisture anomalies and melting snowpack also played a role. The organization and strength of the MJO continues to vary considerably as it has over the last several months and current indications from observations and model predictions of the RMM index continue to highlight the uncertainty in more organized, long lived MJO activity and so continue lower confidence in impacts – especially for this part of the seasonal cycle. La Nina conditions remain solidly in place in both the ocean and atmosphere in the equatorial Pacific Ocean.
The changes in the updated May 2022 temperature outlook include a decrease in coverage and probabilities for above-normal monthly mean temperatures for areas in the western CONUS such as California, the central Great Basin, the central Rockies and parts of the western Southwest. Moreover, an area of favored below-normal temperatures is introduced in the Pacific Northwest. Troughing and cooler temperatures are forecast to impact the western CONUS after the first week of May and is the primary reason for this change. The rest of the updated temperature outlook is largely unchanged from the mid-month outlook.
For precipitation, the forecast of strong troughing entering the western CONUS during the Week-2 period (to first order), supports a considerably more wet pattern for the northern tier of the CONUS from the Pacific Northwest to the Great Lakes as highlighted in the updated outlook. Moreover, the favored below-normal precipitation in the western U.S. is narrowed in the updated outlook. Also, this anticipated pattern as well as considerable precipitation in the short-range forecast (first few days of the month) result in an increase in odds for favored above-normal precipitation for parts of the central Plains and central Mississippi Valley and so a decrease in coverage of below-normal precipitation in this area from the previous May 2022 outlook.
The variability in dynamical model guidance and other forecast information creates high uncertainty in the eventual monthly total precipitation amounts for the eastern CONUS and so a large area of “Equal Chances” is forecast in this area in the updated outlook. No changes are made to the May 2022 temperature and precipitation outlooks for Alaska. Signals remain quite weak in the majority of the forecast tools in this region.
One way to get a handle on what has changed is to compare the updated April Outlook with the Early/Mid-Month Outlook for May issued on April 21, 2022. They are now calling that the Mid-Month Outlook.
 |
 |
There are no (large) reversals in the new forecast for May relative to the three-month forecast. Most of the changes are from above normal to equal chances (EC) or the reverse or from below normal to EC or the reverse.
Has There Been a Change in the ENSO Outlook?
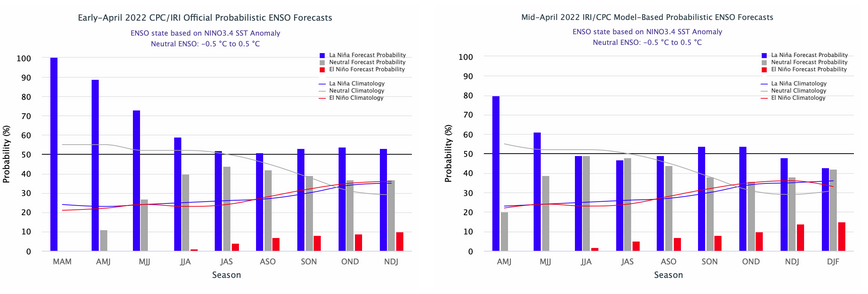
You can see a change. It probably did not impact the May Outlook but may have impacted the three-month Outlook. It is a little difficult to interpret the two graphs above because the methodology is a bit different. The graph on the left was used in developing the Seasonal Outlook Issued on April 21, 2022. But the graph on the right was issued on April 19 so it was available to NOAA. IRI and NOAA do their best to keep everyone confused and they excel at it. The graph on the left is based on a survey of meteorologists and the one on the right is based on computer models. It is less suggestive of a La Nina Three-peat.
And another tool that is used is called a plume of various model forecasts for ENSO
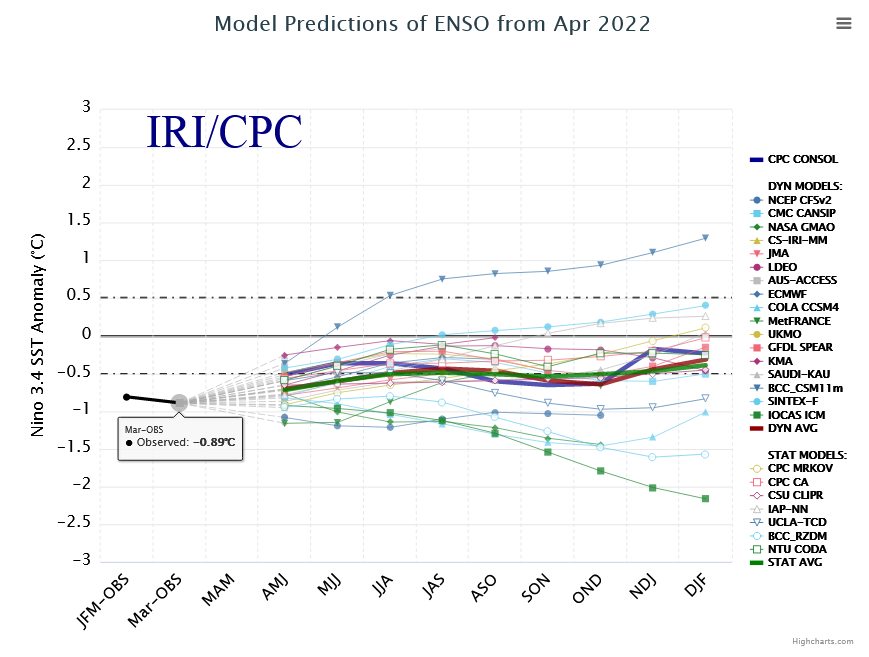
The legend identifies the models used and shows the coding of the averages etc.
There are a lot of models and I also looked at what the Australian Bureau of Meteorology (BOM) is thinking plus other models they pay attention to.
So basically NOAA is the only one thinking there will be a Three-peat and they may be about to change their mind. We will see. NOAA will issue an update on that on May 12, 2022.
Updated Drought Outlook for May
Here is the newly issued Drought Outlook for May 2022
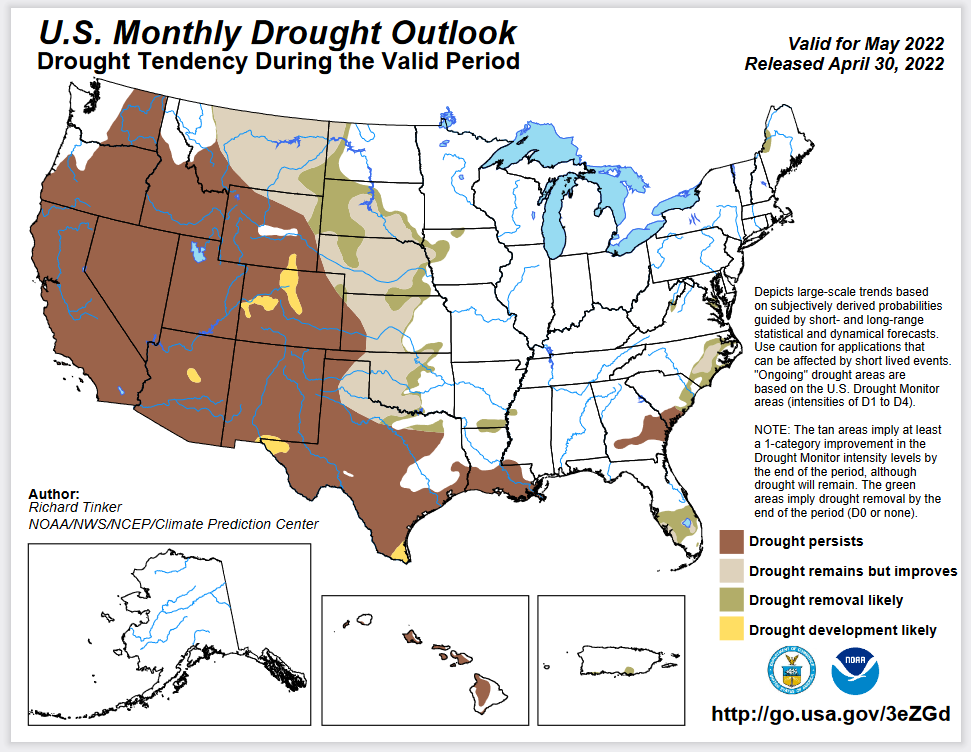
it looks like a big reduction in the area in drought. The summary and detailed discussions that accompany this graphic can be accessed here https://www.cpc.ncep.noaa.gov/products/expert_assessment/mdo_summary.php
This is something new. They now provide an updated Seasonal Outlook
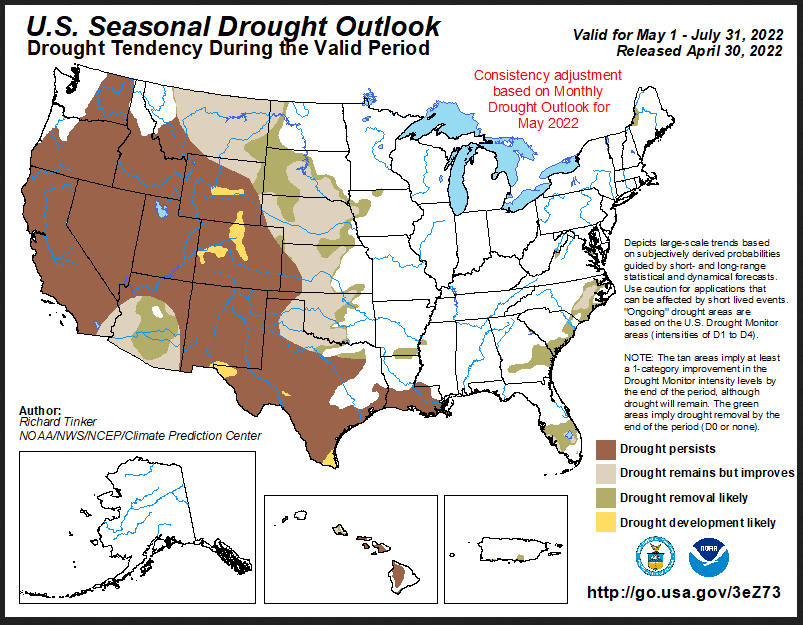
It looks even better. And here is the link https://www.cpc.ncep.noaa.gov/products/expert_assessment/sdohomeweb.png
Visual Consistency Testing.
What I am going to try to do is show the 5-day Outlook, 6 – 10 day Outlook, 8 – 14 day Outlook, and Week 3-4 Outlook. Since this is a Saturday, this will give us 27 days of Outlooks out of 31 days in May. So it should be pretty good.
I am going to have small images that I think you will be able to click on them to make them larger. I also think that they will auto-update. Thus you have a weather forecasting system here.
Let’s see what we get
First Temperature
| Maximum Temperature Day 3 | Days 6 – 10 | Days 8 – 14 | Weeks 3-4 |
 |
 |
 |
 |
At this point in time, we have 27 days of short-term precipitation Outlooks for May which has 31 days. The full month Outlook seems to be consistent with the short-term Outlooks. I believe the short-term Outlooks will update in the article but I am not sure of that. If it does, you actually have an article that is sort of an outlook forecast that continually updates.
There is a lot of variation throughout the month.
And then Precipitation
| Cumulative Days 1 – 5 | Days 6 – 10 | Days 8 – 14 | Weeks 3-4 |
 |
 |
 |
 |
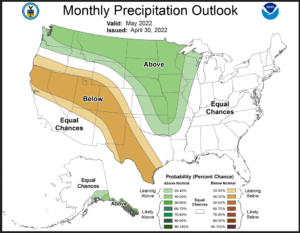
At this point in time, we have 27 days of short-term forecasts for May which has 31 days. It seems to be consistent with the short-term forecasts. I believe the short-term forecasts will update in the article but I am not sure of that or exactly when they will.
Sometimes it is useful to take a look at Persistence. Is the April Outlook similar to the March reported weather?
Looking back on March 2022 to relate the forecast for April to the actual for March.
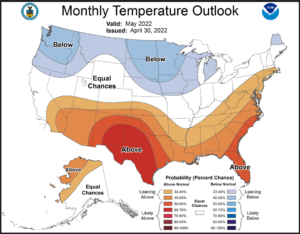
Here is the actual for March minus one day on the left and the updated Outlook for April on the right. One row is for temperature and the bottom row is for precipitation.
| April Actual (29 0f 30 Days) | May Updated Outlook | |
| Temperature | 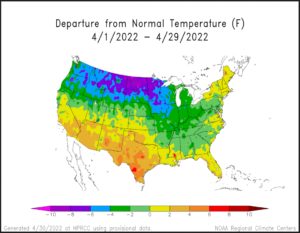 |
 |
| Precipitation | 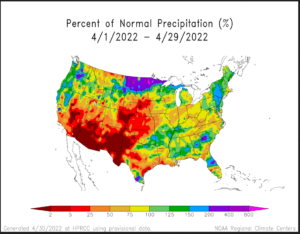 |
 |
There seems to be substantial persistence meaning that May is expected to be somewhat similar to April in terms of variation from Normal. Of course, Normal for May is different than Normal for April
The images above are frozen. But if you want to find month-to-date temperature or precipitation there are the links.
Month to date Temperature can be found at https://hprcc.unl.edu/products/maps/acis/MonthTDeptUS.png
Month to date Precipitation can be found at https://hprcc.unl.edu/products/maps/acis/MonthPNormUS.png

Thanks, Mr. Silber for doing these weather reports and maps. Very interesting even to a lay person who just likes to think about and look at the weather!
Sigmund:
I know I speak for many in thanking you for this regular information on potential wrathet patterns. It is all quite useful for many.