 Introduction

Combination Early Outlook for May and the Three-Month Outlook
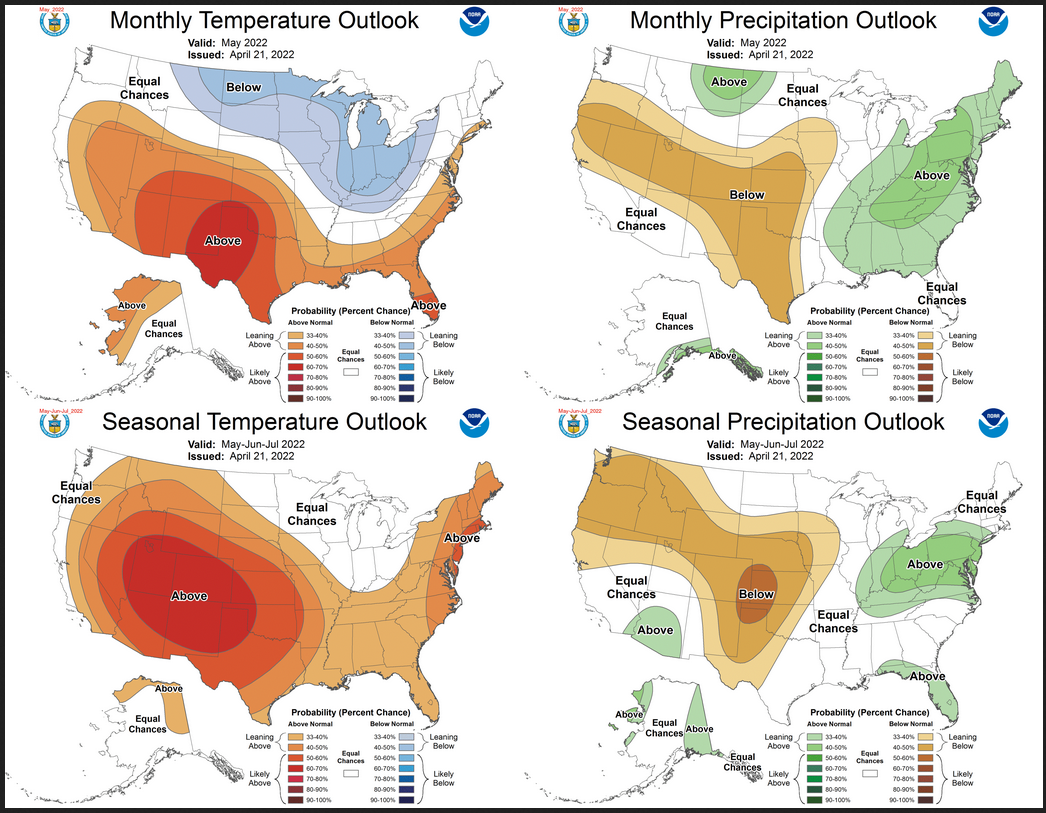
Notice that for temperature, the May and three-month outlook are similar but not as much as recently. This suggests that the June/July outlook is also similar. But for precipitation, there is a bit more difference between the three-month and single month of May Outlook. This means that June/July will need to be a bit different than the May Outlook for the three months to average out to the three-month outlook.
| For both temperature and precipitation, if you assume the colors in the maps are assigned correctly, it is a simple algebra equation to solve the month two/three anomaly probability for a given location = (3XThree-Month Probability – Month One Probability)/2*. So you can derive the month two/three outlook this way. You can do that calculation easily for where you live or for the entire map. |
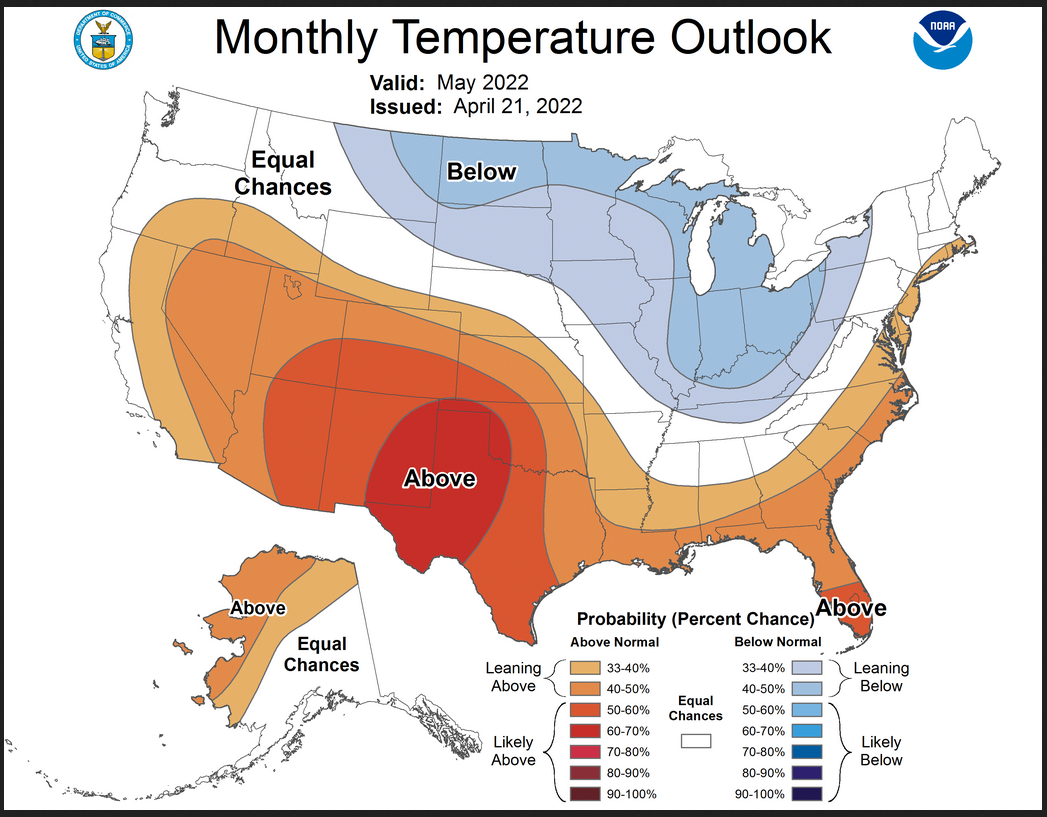
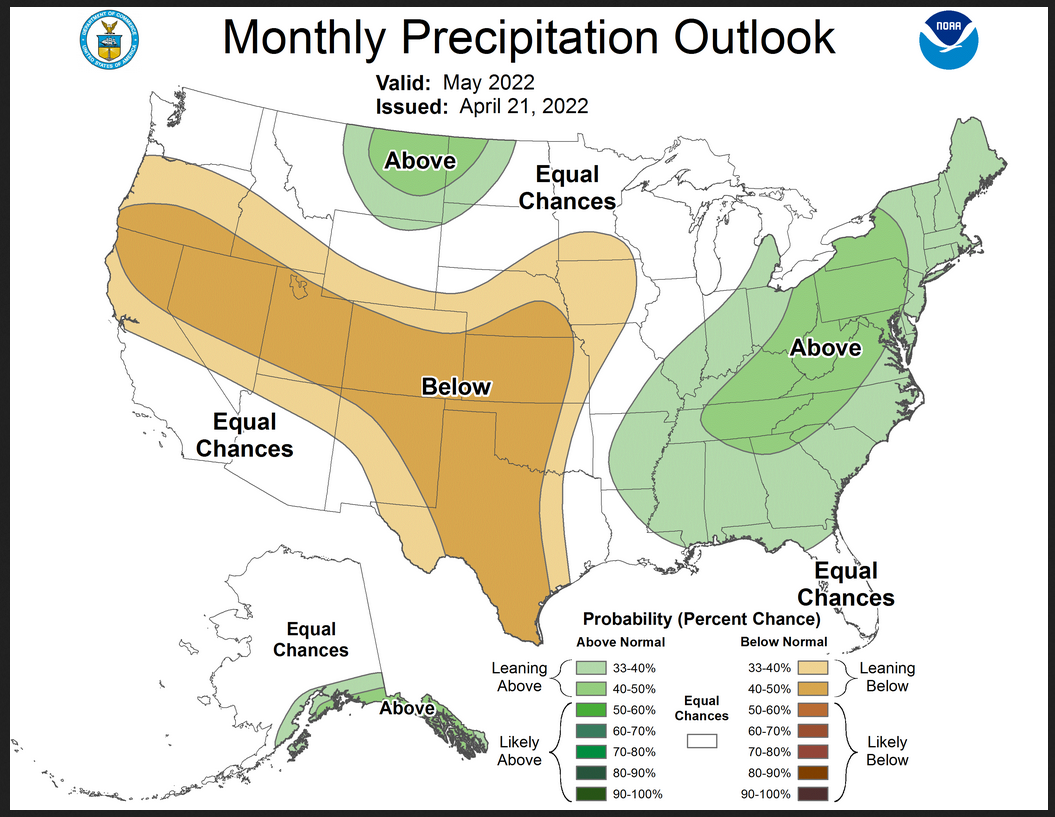
Here are larger versions of the Temperature and Precipitation outlook maps for the single month of May.
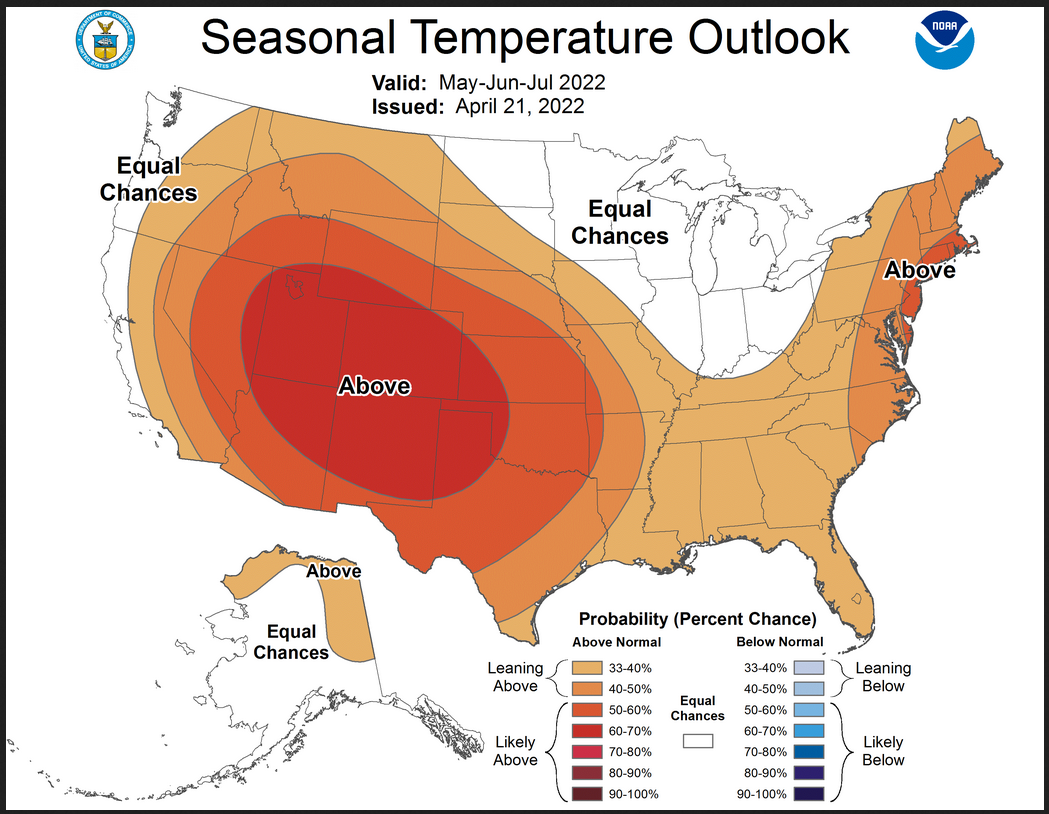
And here are large versions of the three-month MJJ Outlook maps starting with temperature followed by precipitation.

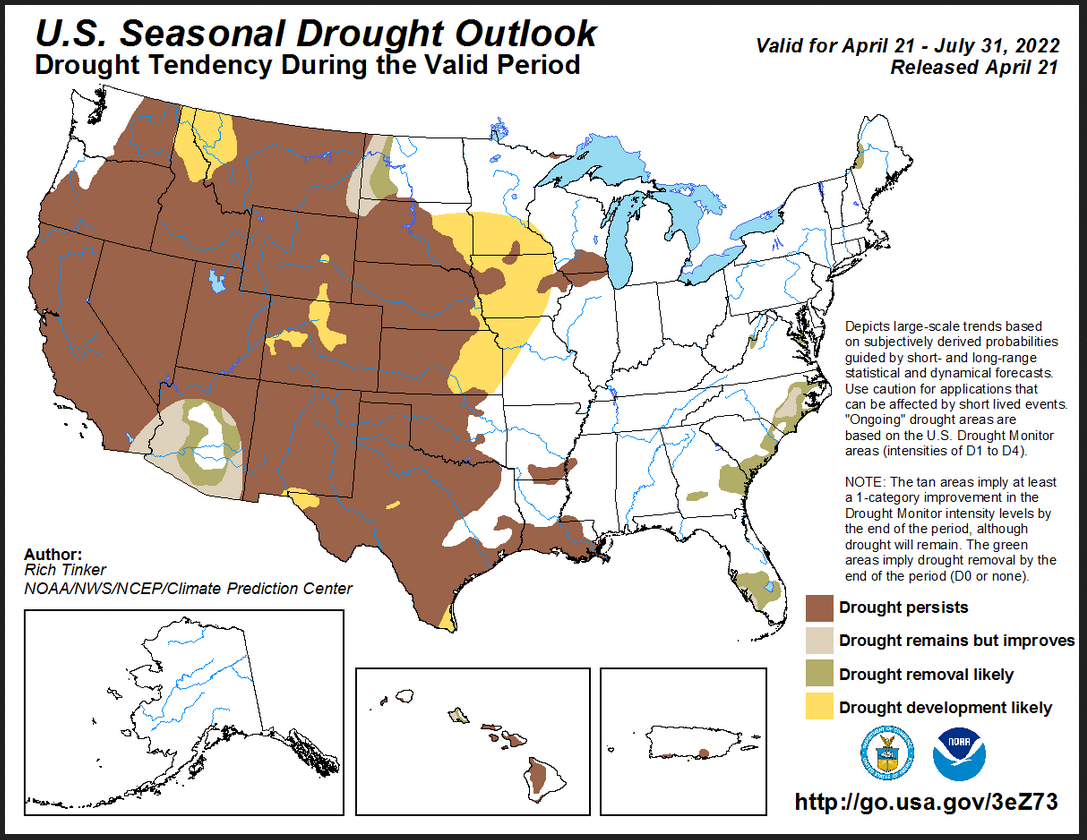
Drought Outlook
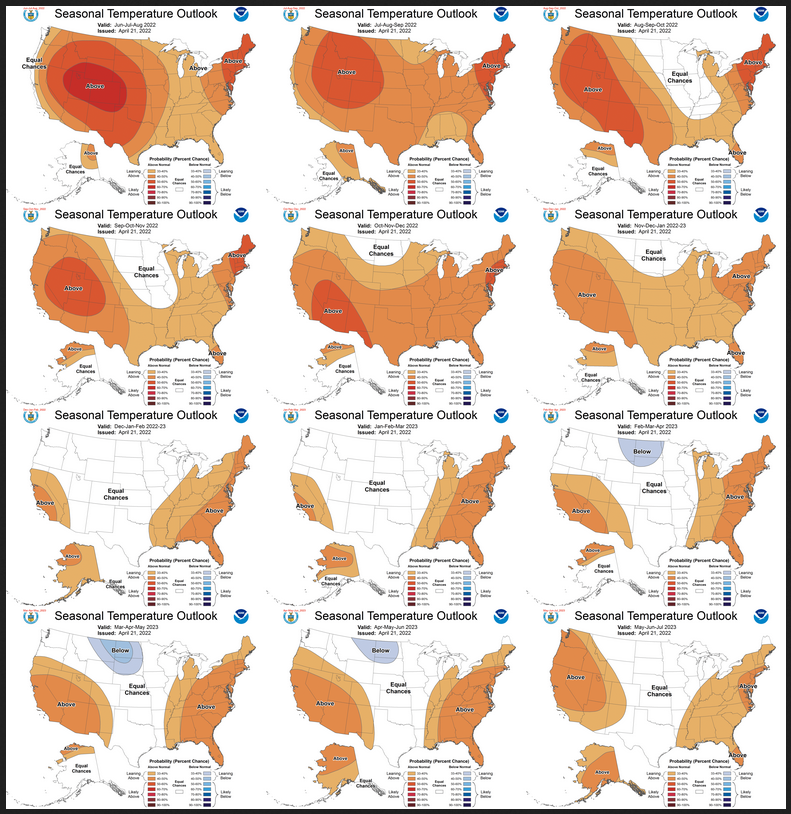
Looking out Four-Seasons.
I am going to include the twelve Temperature maps now.
I am going to include the twelve Precipitation maps now.
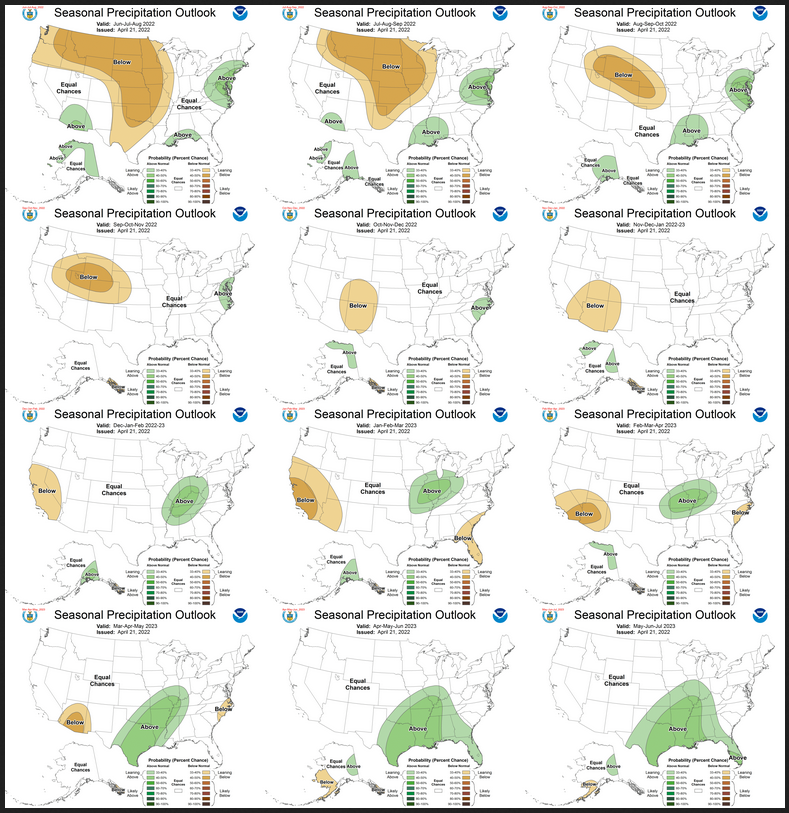
Similar to Temperature in terms of the organization of the twelve overlapping three-month outlooks.
North American Monsoon (NAM)
The MJJ Outlook is shown earlier. But that does not extend through the Monsoon. So I am showing two additional Outlook Maps that extend farther in time.
But first I will repeat the Outlook for the next three months.
Then the following overlapping three-month periods
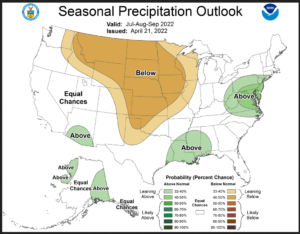
I added a third map for August through October.
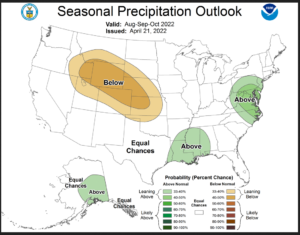
NOAA does not provide single month Outlooks beyond the subsequent month so it is a little hard to interpret a three-month outlook. But if you spend some time looking at these maps you get an idea of what NOAA thinks will happen. That blocking dry area north of Arizona and New Mexico which is probably a high-pressure area limits the impact of the Monsoon on other states.
NOAA Discussion
Maps tell a story but to really understand what is going you need to read the discussion. I combine the 30-day discussion with the long-term discussion and rearrange it a bit and add a few additional titles (where they are not all caps the titles are my additions). Readers may also wish to take a look at the article we published last week on the NOAA ENSO forecast. That can be accessed here. https://econcurrents.com/2022/04/15/noaa-updates-their-enso-forecast-la-nina-looks-to-continue/
I will use bold type to highlight some things that are especially important. My comments, if any, are enclosed in brackets [ ].
CURRENT ATMOSPHERIC AND OCEANIC CONDITIONS The coupled oceanic and atmospheric observations reflect La Niña conditions. During March 2022, La Niña continued with below-average sea surface temperatures (SSTs) across the central and eastern equatorial Pacific Ocean. In the last week, all of the Niño index values ranged from -0.7°C to -1.7°C. Subsurface temperature anomalies (averaged between 180°-100°W and 0-300m depth) decreased and were negative due to the expansion of below-average temperatures from the surface to 200 meters depth in the east-central equatorial Pacific Ocean. Low-level easterly wind anomalies prevailed across the western and central Pacific, and upper-level westerly wind anomalies remained over the east-central Pacific. Suppressed convection remained significant around the Date Line and was enhanced over the Philippines and Southeast Asia. Overall, the coupled ocean-atmosphere system reflected the continuation of La Niña.
The Real-time Multivariate Madden Julian Oscillation (RMM) signal was weak in early April but has emerged and propagated eastward across the Western Hemisphere during the past several days. There is some uncertainty regarding the Madden Julian Oscillation (MJO) evolution during the next 2 weeks with the Global Ensemble Forecast System (GEFS) and the European Centre for Medium-Range Weather Forecasts (ECMWF) disagreeing on the strength of the MJO over the next week, but both models depict a much weaker MJO signal by week 2. Thus, uncertainty is relatively high on the future evolution of the MJO at this time.
PROGNOSTIC DISCUSSION OF SST FORECASTS
The International Research Institute for Climate and Society (IRI) / Climate Prediction Center (CPC) plume average of forecasts for the Niño-3.4 SST region from the last month favored a transition to ENSO-neutral during the Northern Hemisphere summer. This month, the forecaster consensus predicts Niño-3.4 index values to weaken into the summer but remain below the threshold of La Niña (Niño-3.4 values equal to or less than -0.5°C). The change in the consensus forecast to slightly favoring the continuation of La Niña is primarily based on recent model runs from the North American Multi-Model Ensemble (NMME) and the persistence of atmosphere-ocean coupling, which remains fairly strong for this time of year. While La Niña is slightly favored through the fall, there is still a considerable amount of uncertainty, as the chance for ENSO-neutral conditions exceed 37% from June-August onward. In summary, La Niña is favored to continue through the Northern Hemisphere summer (59% chance during June-August 2022), with a 50-55% chance through the fall.
PROGNOSTIC TOOLS USED FOR U.S. TEMPERATURE AND PRECIPITATION OUTLOOKS
Dynamical model forecasts from the NMME and Copernicus (C3S) multi-model ensemble systems are used extensively for the first six leads when they are available, as was the objective, historical skill weighted consolidation, that combines both dynamical and statistical forecast tools. Current soil moisture content is abnormally dry for much of the Central and Southern Plains and the western CONUS. Additionally, the official El Niño Southern Oscillation (ENSO) forecast depicts probabilities of La Niña that are significantly higher than climatological probabilities through the upcoming summer and fall. Current soil moisture conditions and the anticipated La Niña signal played a role in the construction of these outlooks. At later leads, decadal trends in temperature and precipitation were increasingly relied upon in creating the seasonal outlooks.
30-DAY OUTLOOK DISCUSSION FOR MAY 2022
The May 2022 temperature and precipitation outlook remains influenced to some degree by continuing La Nina conditions, but is also impacted by favored blocking anticipated to continue into the month of May in the northeast Atlantic to Greenland. Predictions of both the AO and NAO indices start the month strongly negative with reasonable spread for this time of the year. The MJO has not been well behaved, nor coherent or long-lived over the last several weeks and did not play a significant role in the outlook. Other factors included boundary conditions such as extreme drought conditions from the Southwest to the central Rockies to the central and southern Plains. Anomalous snow pack also was considered for the northern High Plains due to recent strong spring snowstorms during mid to late April.
Temperature
Dynamical model guidance from the CFS along with several Week 3-4 ensemble model predictions systems extending through the middle of the month of May favor above-normal temperatures for much of the West especially portions of the Southwest and the central and southern High plains where extremely below-normal soil moisture further supports a warm signature for much of May. As noted earlier, the start of May is favored to be influenced by a negative AO and NAO pattern consistent with forecast blocking at high latitudes in the northeast Atlantic. Troughing upstream of the blocking region favors below-normal temperatures from the northern Plains to the Great Lakes southward to the Tennessee Valley. Monthly mean below-normal temperatures are favored to remain even though there is uncertainty of the eventual forecast circulation the last 2 weeks in May.
Precipitation
The May 2022 precipitation outlook favors below-normal monthly total precipitation amounts from the central West coast across the central and southern Great Basin, central and southern Rockies eastward to include most of the central and southern Plains. Although there is considerable uncertainty in the precipitation outlook, the anticipated ridge-trough pattern forecast for much of the first half of the May supports ridging and drier than normal conditions in this area. Drought conditions also in a minor way would tend to favor less re-cycling of local moisture for needed precipitation processes in some areas.
In vicinity and slightly downstream of favored troughing (forced by north Atlantic blocking) makes above-normal precipitation most likely for many areas in the eastern CONUS. Model guidance also favors above-normal precipitation for southern Alaska and portions of the northern High Plains.
SUMMARY OF THE OUTLOOK FOR NON-TECHNICAL USERS (Focus on May, June and July)
La Niña conditions are present, as represented in current oceanic and atmospheric observations and a La Niña Advisory remains in effect. La Niña is favored to continue through the Northern Hemisphere summer (59% chance during June-August 2022), with a 50-55% chance through the fall. Conversely, the chances of El Niño are exceedingly small, with probabilities less than 10 percent through the upcoming summer and autumn.
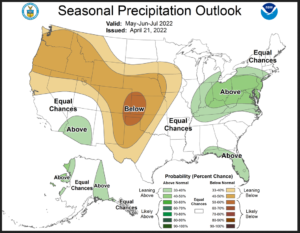
The May-June-July (MJJ) 2022 temperature outlook favors above normal temperatures for the Interior West of the Contiguous United States (CONUS), the Central and Southern Plains, the East and Gulf Coasts, and parts of eastern and northern Mainland Alaska. The largest probabilities of above normal temperatures (greater than 60 percent) are forecast across the Central and Southern Rockies, the eastern Great Basin, and the Central and Southern High Plains. The MJJ 2022 precipitation outlook depicts enhanced probabilities of below normal precipitation amounts across the Central Plains, the Southern High Plains, and the northwestern CONUS. Probabilities of below normal precipitation exceeds 50 percent for parts of the Central and Southern High Plains. Above normal precipitation is more likely from the Ohio Valley to the Mid-Atlantic Coast, the Florida Peninsula and the Eastern Gulf of Mexico Coast region, the Southwest, the western coast of the Alaska Mainland, and eastern Mainland Alaska. Equal chances (EC) are forecast for areas where probabilities for each category of seasonal mean temperatures and seasonal accumulated precipitation amounts are expected to be similar to climatological probabilities.
BASIS AND SUMMARY OF THE CURRENT LONG-LEAD OUTLOOKS
PROGNOSTIC DISCUSSION OF OUTLOOKS – MJJ 2022 TO MJJ 2023
TEMPERATURE
Above normal temperatures are favored throughout the Interior West, the Eastern Seaboard, the Gulf Coast, and parts of northern and eastern Mainland Alaska during MJJ 2022. The greatest confidence of above normal temperatures (exceeding 60 percent) exists for the Central and Southern Rockies, the eastern Great Basin, and the Central and Southern High Plains where low soil moisture content and dynamical model output from the NMME and C3S strongly support increased heat. Dynamical model guidance, ENSO composites, and decadal trends all support warmth for parts of the Northeast and Mid-Atlantic coastal regions, leading to probabilities of above normal temperatures exceeding 50 percent. The slight tilt toward above normal temperatures for the Gulf Coast Region is based primarily on dynamical model guidance. The slightly enhanced probabilities of above normal temperatures for parts of eastern and northern Alaska are based on CPC statistical guidance, which includes decadal trend and constructed analogs . EC of below, near, or above normal temperatures are forecast for the Great Lakes, Upper Mississippi Valley, and parts of the Northern Plains as an anticipated cool May is offset by a favored transition to a warmer pattern as the season progresses. EC is also indicated for most of Alaska and along the immediate West Coast of the CONUS, due to weak or conflicting signals among temperature tools.
For the summer seasons (JJA through JAS), the combined signals from dynamical model guidance, soil moisture, ENSO composites, and trend favor above normal temperatures for almost the entire CONUS as well as much of northern and eastern Mainland Alaska. The strongest warm signals remain over much of the Interior West and the Northeast, where dynamical models , trend, and ENSO composites are all in good agreement. Confidence is reduced over the east-central CONUS as a cool soil moisture signal dampens the tilt toward above normal temperatures depicted by dynamical model guidance. A slight tilt towd warmth is indicated for northern and eastern Alaska due primarily to trend and ENSO composites. As we progress toward the late summer/early fall through next spring (ASO 2022 – MJJ 2023), confidence in above normal temperatures across the central CONUS decreases significantly as soil moisture becomes less of a factor and ENSO and trend warm signals generally weaken. By the late winter through next spring (FMA – AMJ 2023), cold ENSO and trend signals lead to a tilt towards below normal temperatures across parts of the Northern Plains. Elsewhere, dynamical models favor warmth for much of the West and Eastern Seaboard into the early fall (SON 2022). ENSO and trend tools continue to support above normal temperatures for the Southwest and Eastern Seaboard through the remainder of the forecast leads (OND 2022 – MJJ 2023). Additionally, ENSO, trend, and constructed analog based tools generally favor above normal temperatures for northern Alaska through next Spring.
PRECIPITATION
Low soil moisture combined with strong dry signals from dynamical model guidance and ENSO composites leads to increased chances of below normal precipitation across the Central Plains, Southern High Plains, and the northwestern CONUS during MJJ 2022. The greatest probabilities of below normal precipitation (exceeding 50 percent) is indicated for the Central and Southern High Plains, where soil moisture deficits are especially large. Conversely, due to the potential for enhanced antecedent heat across the West and the potential dry pattern across the Plains (which is anticorrelated with the precipitation pattern across parts of the Southwest), an enhanced early Monsoon is slightly favored across parts of the Southwest. Increased wetness is also favored from the Ohio Valley to the mid-Atlantic, due primarily to recent trends . Trends as well as natural analogs from the current MJO state favor wet for Florida and the eastern Gulf Coast, leading to a slight tilt toward above normal precipitation for these regions. These same tools also favor wetness for the western Gulf Coast region, but conflicted with drier dynamical model guidance, leading to a forecast of EC. A slight tilt toward above normal precipitation is indicated for much of coastal western Mainland Alaska due to support from the NMME and C3S while trends lead to slightly enhanced probabilities of above normal precipitation for parts of eastern Mainland Alaska.
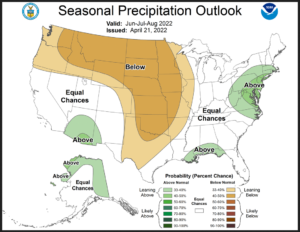
During the summer months (JJA – JAS), below normal precipitation is favored to persist across most of the Plains and the interior northwestern CONUS. An increase in probabilities of below normal precipitation is indicated across the Northern Plains during the summer months due to support from the NMME and C3S as well as ENSO composites. Conversely, the C3S supports a persistence of the wet Southwest Monsoon pattern for JJA with the signal weakening thereafter. [We provided some additional outlook maps to highlight this] Increased probabilities of above normal precipitation are favored to persist for parts of the Mid Atlantic region through the fall (OND) due primarily to ENSO and trend signals as well as support from dynamical model guidance. Natural ENSO analogs also support increased rainfall for much of the Gulf Coast region through ASO, where a slight tilt toward above normal precipitation is indicated. Above normal precipitation is also favored for northwestern coastal Mainland Alaska (through JAS) due to dynamical model guidance, and for much of eastern Mainland Alaska (through ASO) due to decadal trends . Uncertainty increases significantly across most of the country for the late fall and early winter (OND – NDJ) with large areas of EC indicated. Slight tilts toward dry are indicated for the Southwest and the Alaska Panhandle due to statistical guidance while decadal trends support weakly enhanced above normal precipitation probabilities for parts of eastern and northern Mainland Alaska.
The remainder of the outlook period (DJF – MJJ 2023) features enhanced probabilities of below normal precipitation for parts of the southwestern CONUS through early Spring 2023 due to decadal trends . ENSO composites and trend favor above normal precipitation for parts of the east-central CONUS in DJF expanding to the Gulf Coast Region by next Spring. Conversely, dry ENSO signals support elevated probabilities of below normal precipitation for parts of the coastal Southeast from JFM through MAM. Trends support a slight tilt toward above normal precipitation for parts of eastern Mainland Alaska through FMA 2023 and for below normal precipitation for parts of the Panhandle through AMJ 2023.
Thanks again for all of the useful information. Most of which I understood … Just barely. I did get a lot on the dumbed down portion asC that is where my brain resides.
I look forward to or next face to face!
Best regards to you and Julia,
Chuck Ring
I am glad I was finally able to send you my article by email. I hope the fire risk in your area is not too great since May and June look to be dry.
I miss your jokes. You are the best. It is easy enough for me to send out my articles. All I need is email addresses to which I would send an email to confirm that they would like to receive this kind of information. Not everyone wants this level of detail.