Updated at 6 pm EST on April 1, 2022 to reflect the issuance of the Week 3 – 4 Outlook that I think suggests that the Northern Tier of CONUS will be wetter than shown in the Outlook for April Issued yesterday.
At the end of every month, NOAA updates their Early Outlook for the following month which in this case is April. They also issue a drought outlook for the following month. We are reporting on that tonight. The updated Outlook is somewhat different from the Early Outlook which NOAA now calls the Mid-Month Outlook. It is overall less warm and less dry than the Mid-Month Outlook. We provide partial-month outlooks for the first 22 days of April which will be 28 days when the Week 3 – 4 Update is issued on Friday. We also provide enough information for readers to understand any changes from the Mid-Month Outlook and we try to figure out why these changes were made. Most of the changes are explained in the NOAA discussion which is included in the article. When the Week 3 – 4 Outlook is released, we will provide an update to this article if it is needed.
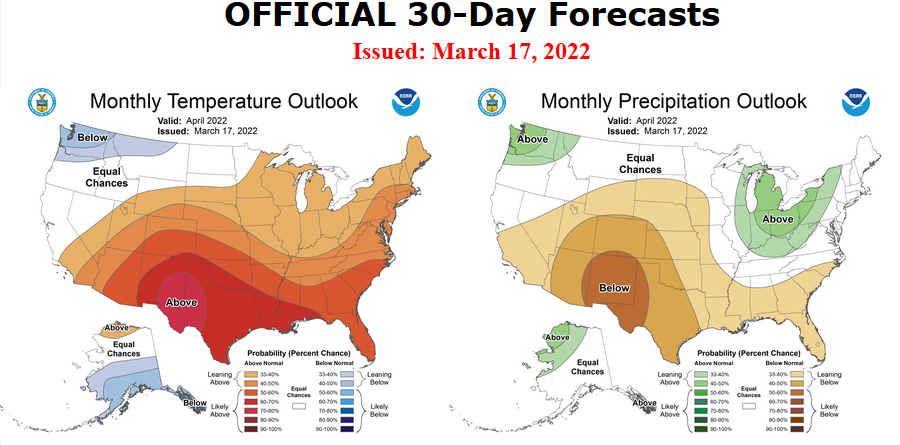
Here is the updated forecasted Outlooks. [Even NOAA gets confused by their terminology]
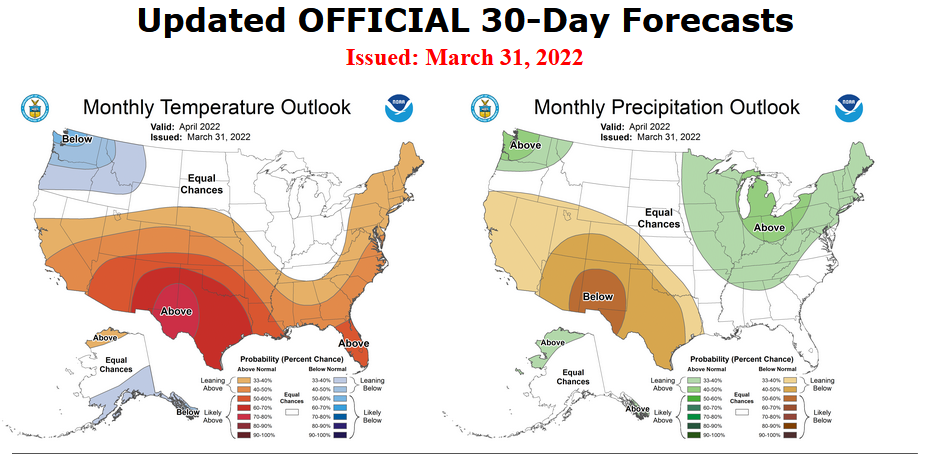
Combination of the Updated Outlook for April and Three-Month Outlook
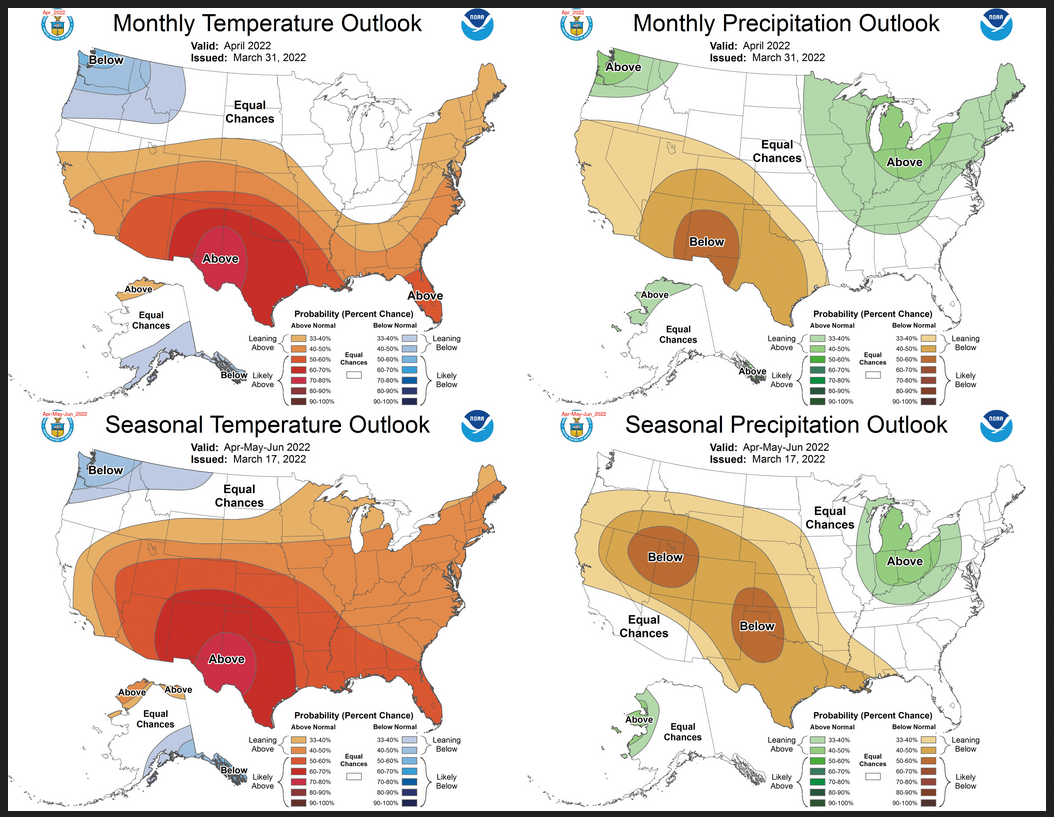
Notice that for both temperature and precipitation, the April Outlook and three-month Outlook are quite similar. This suggests that the May/June Outlook are also similar. But there are differences. For temperature, the three-month Outlook shows a larger area of above-normal temperatures. For precipitation, the single month Outlook shows a wet area in the Northwest that is not in the three-month Outlook
| For both temperature and precipitation, if you assume the colors in the maps are assigned correctly, it is a simple algebra equation to solve the month two/three anomaly probability for a given location = (3XThree-Month Probability – Month One Probability)/2*. So you can derive the month two/three outlook this way. You can do that calculation easily for where you live or for the entire map. |
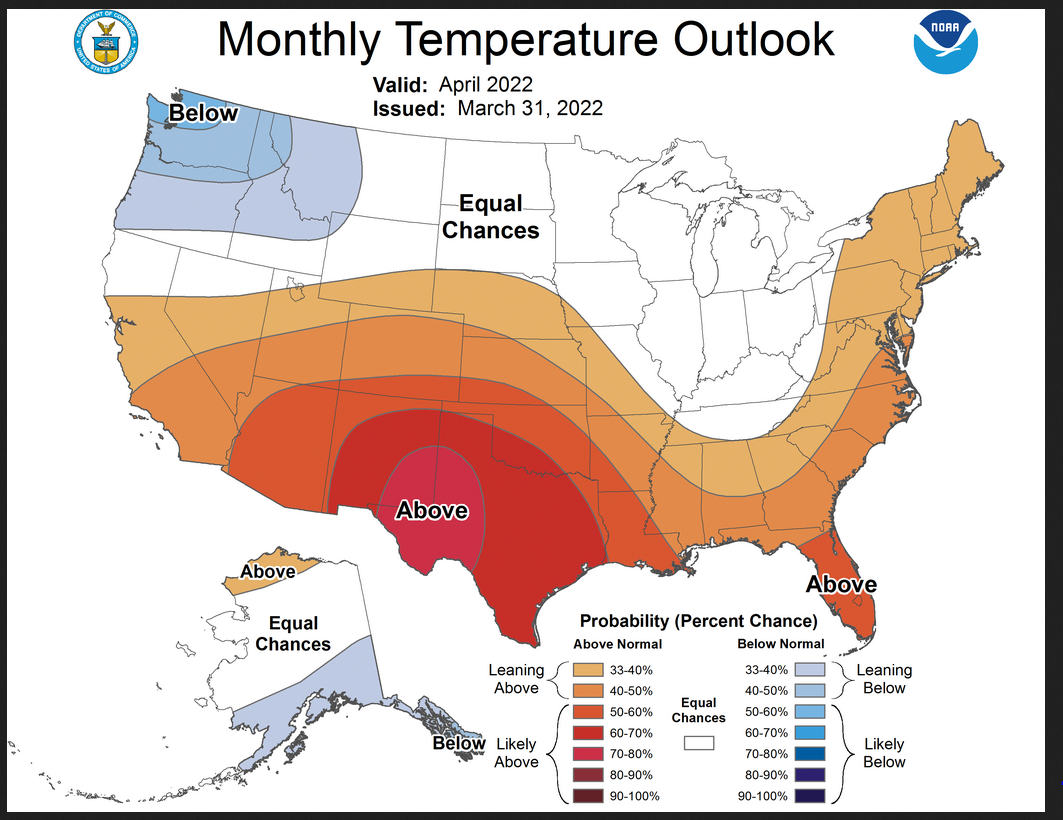
Here are larger versions of the Temperature and Precipitation Outlook maps

NOAA Discussion
30-DAY OUTLOOK DISCUSSION FOR APRIL 2022 (I have shown important statements in bold type)
The April 2022 Temperature and Precipitation Outlooks are updated considering current Weather Prediction Center (WPC) Outlooks for week 1, Climate Prediction Center (CPC) Extended Range and Subseasonal Outlooks, dynamical model guidance for week 2 and weeks 3-4, current soil moisture conditions, and background climate states. La Niña conditions persist in the tropical Pacific, with the latest weekly NINO3.4 sea surface temperature departures reaching -0.9 degrees Celsius. The atmospheric teleconnection pattern remains consistent with that expected during April La Niña events. Though a Madden Julian Oscillation (MJO) event propagated eastward during mid- to late- March, the MJO has decreased in amplitude this week with recent Real-time Multivariate MJO (RMM) Index values residing within the unit circle. RMM forecasts are weak and uncertain into early April, thus, the MJO did not play a large role in the updated monthly Outlook. The Arctic Oscillation (AO) index is currently negative which is expected to bring cooler temperatures to the Eastern US early in the month, but the AO is forecast to rapidly shift to neutral in the beginning of April.
The previous mid-month April 2022 Outlook favored enhanced probabilities of above normal temperatures over the Eastern US, including the Great Lakes, Mississippi, Ohio, and Tennessee Valley Regions. Strong troughing forecast for early April over these regions, related to the negative AO, is expected to bring cooler temperatures. However, the troughing is expected to subside quickly given the rapid shift of the AO index toward neutral as indicated by dynamical model forecasts. Slightly elevated probabilities of above normal temperatures are favored in the latter half of April in subseasonal dynamical model forecasts from the ECMWF, CFSv2, JMA, ECCC, and GEFSv12 models. Enhanced probabilities of above normal temperatures are weakened to Equal-Chances (EC) of above, near, and below normal temperatures in the updated Outlook given the expected cooler early April temperatures and mid- to late- April warmer temperatures. Recent model guidance from the CFSv2 as well as a strong ridge over the western US prompted increased probabilities of above normal temperatures over California. Persistent La Niña conditions as well as CFSv2 forecasts support strengthening of below normal temperature probabilities over the Pacific Northwest. The updated temperature Outlook for Alaska remains consistent with the mid-month Outlook, but weak circulation forecasts along with mixed extended range and subseasonal model guidance over Alaska led to dampening of the probabilities.
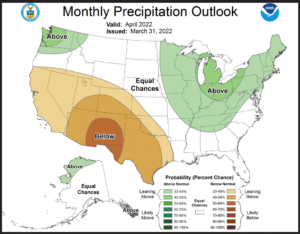
WPC Quantitative Precipitation Forecasts (QPF) favor elevated precipitation amounts in the first week of April stretching from the Gulf States to the Great Lakes and Northeast. 6-10 day extended range dynamical model forecasts favor enhanced probabilities of above normal precipitation over the Eastern US related to the forecasted troughing over the region. This expected early April rainfall prompted expansion of the area of enhanced above normal precipitation probabilities over the Great Lakes relative to the previous mid-month Outlook to include the northernmost parts of the Gulf States and Northeast in the updated Outlook. Wet soil moisture anomalies over parts of the Great Lakes and Ohio valley further support enlargement of the area of above normal precipitation. In contrast, subseasonal dynamical model forecasts for the end of April are mixed or forecast weak below normal precipitation probabilities over the Southeast, while previous monthly dynamical model forecasts from the North American Multi-Model Ensemble (NMME) and Copernicus Climate Change Service (C3S) favored below normal precipitation. Due to these weak or mixed signals among the most recent precipitation tools, EC is forecast for the updated Outlook over the southern parts of the Gulf States and Florida. Recent dynamical model forecasts depict amplified troughing developing over the northern US in week 2, which could bring storminess to the central US in mid- to late- April. Thus, the area of enhanced above normal precipitation probabilities are also expanded to include parts of the Mississippi Valley, while the region of favored below normal precipitation amounts is diminished over Nebraska and Kansas, compared to the previous mid-month Outlook. The updated precipitation Outlook for Alaska remains consistent with the mid-month Outlook, but uncertainty and weak circulation patterns over Alaska led to dampening of the probabilities.
One way to get a handle on what has changed is to compare the updated April Outlook with the Early/Mid-Month Outlook for April issued on March 17. They are now calling that the Mid-Month Outlook.
 |
|
There are no reversals in the new forecast for April relative to the three-month forecast. All the changes are from above normal to equal chances (EC) or the reverse or from below normal to EC or the reverse. There are no changes from above normal to below normal or the reverse. So the changes are easily seen but not extremely significant except for the eastern half of CONUS and a part of the West Coast.
Updated Drought Outlook for April
Here is the newly issued Drought Outlook for April 2022
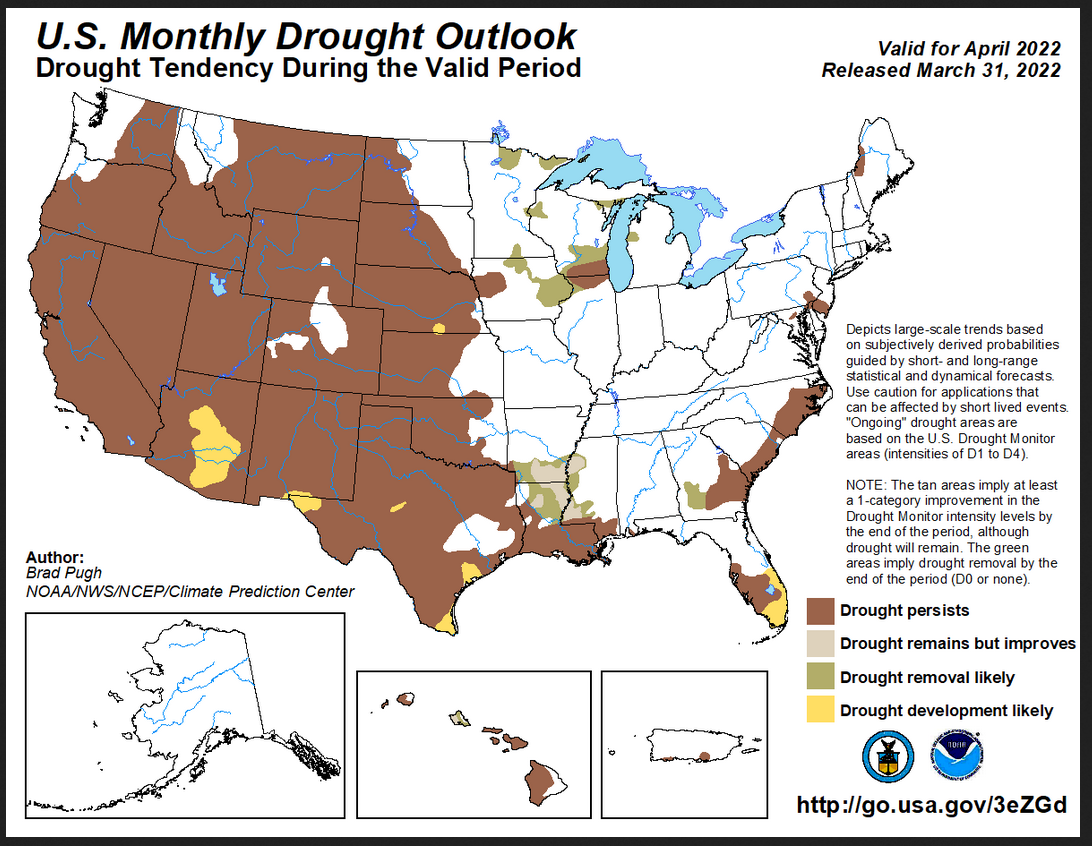
On balance, some areas improve, some get worse. The summary and detailed discussions that accompany this graphic can be accessed here https://www.cpc.ncep.noaa.gov/products/expert_assessment/mdo_summary.php
Visual Consistency Testing.
What I am going to try to do is show the 5-day Outlook, 6 – 10 day Outlook, 8 – 14 day Outlook, and Week 3-4 Outlook. Since this is a Thursday, this will give us 22 days of Outlooks out of 30 days in April. So it should be pretty good but by no means perfect. At some point on Friday, we will have 28 days of short-term Outlooks. It is a detail but the first graphic being very near-term is in forecast rather than outlook format.
I am going to have small images that I think you will be able to click on them to make them larger. I also think that they will auto-update. Thus you have a weather forecasting system here.
Let’s see what we get
First Temperature
| Maximum Temperature Day 3 | Days 6 – 10 | Days 8 – 14 | Weeks 3-4 |
 |
 |
 |
 |
At this point in time, we have 22 days of short-term precipitation Outlooks for April which has 30 days. So we are missing about a week. By the time most read this article, we will have 28 days of short-term forecasts. The full month Outlook seems to be consistent with the short-term Outlooks. I believe the short-term Outlooks will update in the article but I am not sure of that.
There is a lot of variation throughout the month.
And then Precipitation
| Cumulative Days 1 – 5 | Days 6 – 10 | Days 8 – 14 | Weeks 3-4 |
 |
 |
 |
 |
At this point in time, we have 25 days of short-term forecasts for March which has 31 days. So we are missing about a week. It seems to be consistent with the short-term forecasts. I believe the short-term forecasts will update in the article but I am not sure of that or exactly when they will.
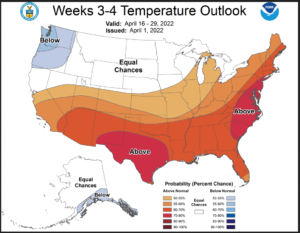
Just in case, here are the updated week 3 – 4 Outlook Maps
 |
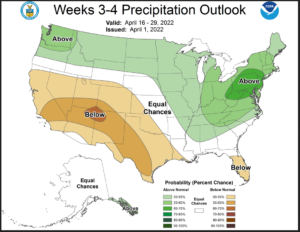 |
And here is the discussion that was issued with it. It is difficult to know how to interpret this information because we only see the Week 3 – 4 forecasts when it is issued on Fridays but I assume that the NOAA CPE has access to updates daily. So it is hard to say if this is information that was not considered in doing the April Update but it does look to me like the Northern Tier of CONUS is expected to be wetter than is shown in the updated Monthly Outlook.
Week 3-4 Forecast Discussion Valid Sat Apr 16 2022-Fri Apr 29 2022
La Niña conditions are currently present across the tropical Pacific Ocean with below average sea surface temperatures (SSTs) across the eastern and east-central Pacific Ocean. Low-level easterly wind anomalies were observed over the western to east-central equatorial Pacific Ocean, while upper-level westerly wind anomalies were evident over the east-central tropical Pacific Ocean. The Real-time Multivariate Madden Julian Oscillation (RMM)index fell within the unit circle, indicating a decaying intraseasonal signal, during the last week. This is likely due to destructive interference with La Nina.Dynamical models generally show a weak intraseasonal signal during the next two weeks. The Week 3-4 temperature and precipitation outlooks are based primarily on dynamical guidance including the GEFS, CFSv2, Canadian, ECMWF, JMA, the Subseasonal Experiment (SubX) multi-model ensemble (MME) of experimental and operational ensemble prediction systems, with additional considerations for Madden Julian Oscillation (MJO), El Nino Southern Oscillation (ENSO), decadal climate trends, and the predicted evolution of the pattern from the Week-2 forecast.
Dynamical model 500-hPa height anomaly forecasts during Week 3-4 show a fairly consistent evolution from Week-2 forecasts. A blend of the CFSv2, ECMWF, GEFS, and JMA 500-hPa height pattern forecasts plus a small contribution from the Multivariate Linear Regression (MLR) height forecast based on the RMM index, La Niña, and decadal trends, predicts anomalous troughing and negative 500-hPa height anomalies over parts of the northwestern CONUS. Ridging and positive 500-hPa height anomalies are forecast over much of the southern tier of the CONUS. Negative 500-hPa height anomalies are forecast over Mainland Alaska and the Alaska Panhandle, while above normal heights are predicted across the western Aleutians. Most dynamical models feature above normal 500-hPa heights over Hawaii.
Predicted troughing over the northwestern CONUS favors elevated probabilities for below normal temperatures across the Pacific Northwest. Above normal temperatures are favored over most of the southern and eastern CONUS due to predicted 500-hPa ridging and/or long-term trends, supported by most of the dynamical forecast tools. Below normal temperatures are likely over southern Mainland Alaska and the Alaska Panhandle, underneath forecasted below normal 500-hPa heights.
The Week 3-4 precipitation outlook favors above normal precipitation across most of the northwestern and north-central CONUS due to the predicted below normal 500-hPa heights. Above normal precipitation probabilities are also elevated over most of the eastern CONUS, except for parts of the Florida Peninsula, where below normal precipitation is favored, consistent with most of the dynamical and statistical guidance. Enhanced chances for below normal precipitation extend across the southwestern CONUS and the Southern Plains associated with above normal 500-hPa heights. Predicted troughing over Mainland Alaska favors elevated probabilities for above normal precipitation over the Alaska Panhandle.
The outlook favors above normal temperatures for the Hawaiian Islands due to positive SST anomalies and above normal 500-hPa heights in the vicinity. Dynamical model guidance from the SubX MME shows increased probabilities for below median precipitation over Hawaii islands.
Sometimes it is useful to take a look at Persistence. Is the April Outlook similar to the March reported weather?
Looking back on March 2022 to relate the forecast for April to the actual for March.
Here is the actual for March minus one day on the left and the updated Outlook for April on the right. One row is for temperature and the bottom row is for precipitation.
| March Actual (30 0f 31 Days | April Outlook | |
| Temperature | 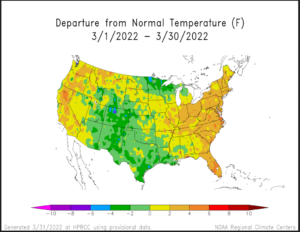 |
 |
| Precipitation | 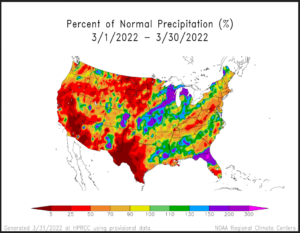 |
|
There seems to be some persistence meaning that April is expected to be somewhat similar to March in terms of variation from Normal. Of course, Normal for April is different than Normal for March.
The images above are frozen. But if you want to find month-to-date temperature or precipitation there are the links.
Month to date Temperature can be found at https://hprcc.unl.edu/products/maps/acis/MonthTDeptUS.png
Month to date Precipitation can be found at https://hprcc.unl.edu/products/maps/acis/MonthPNormUS.png