 Introduction

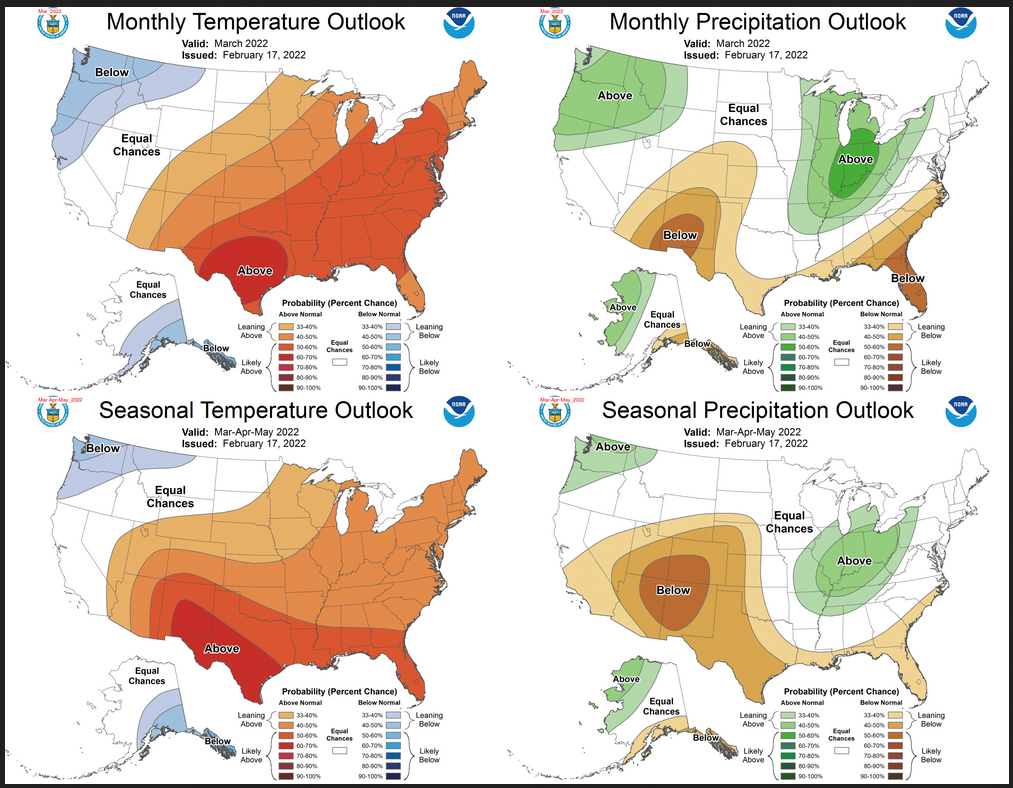
Combination Early Outlook for March and the Three-Month Outlook.
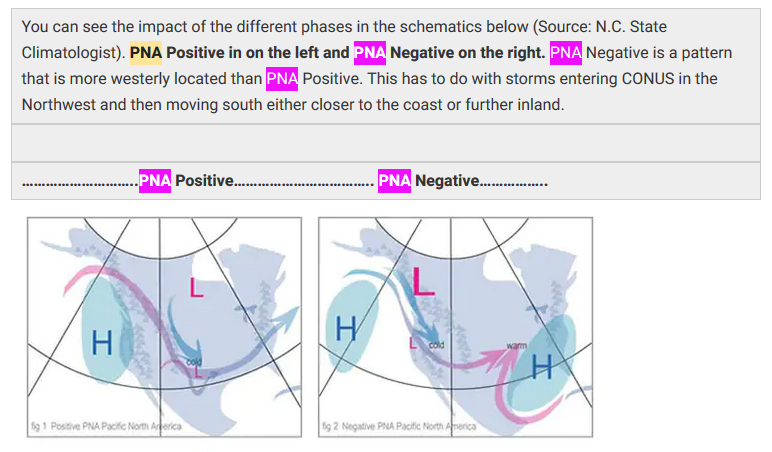
Notice that with a negative PNA (PNA-) storms that approach the U.S. from the Pacific Ocean are likely to dip to the south along the West Coast or the Great Basin rather than farther to the east. I am curious as to why the Southwest would be dry with a negative PNA but notice the subtle difference between the March Outlook and the Outlook for the three-month period. The Southwest dry anomaly does not extend as far to the west in March.
The Madden Julian Oscillation (MJO) is also thought to be a factor in March. If you want to dig deeper into that, here are two links that would be useful: https://www.cpc.ncep.noaa.gov/products/precip/CWlink/MJO/Composites/Temperature/ and https://www.cpc.ncep.noaa.gov/products/precip/CWlink/MJO/Composites/Precipitation/ but it is probably better to start here. https://www.cpc.ncep.noaa.gov/products/precip/CWlink/MJO/mjo.shtml The MJO is not easy to deal with.
A positive phase of the North Atlantic Oscillation (NAO) is also expected. This simply means that the air pressure differential in the North Atlantic prevents cold air from moving south. It is more complicated than that especially for Europe. But the impacts for the US Northeast are pretty straightforward.
Taken together, NOAA had a lot of familiar patterns to work with in terms of March and the first three-month period. Thus they have a fairly high level of confidence in that part of the Seasonal Outlook.
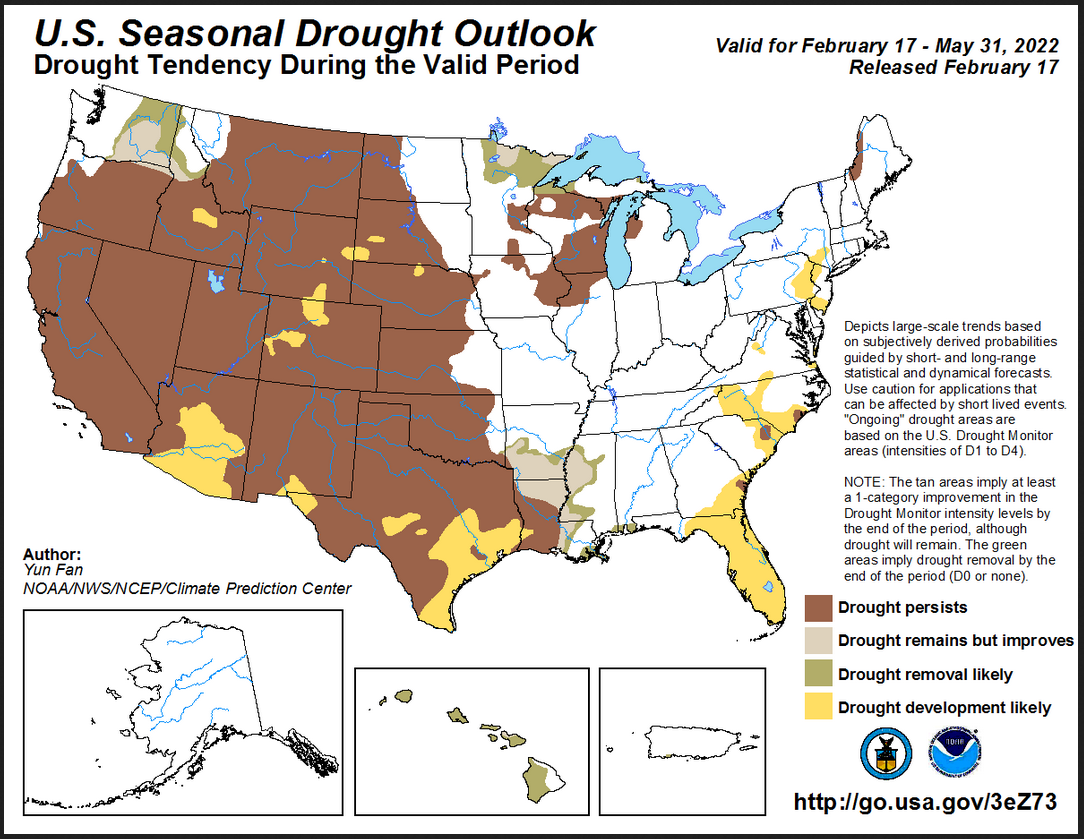
Drought Outlook
Looking out Four-Seasons.
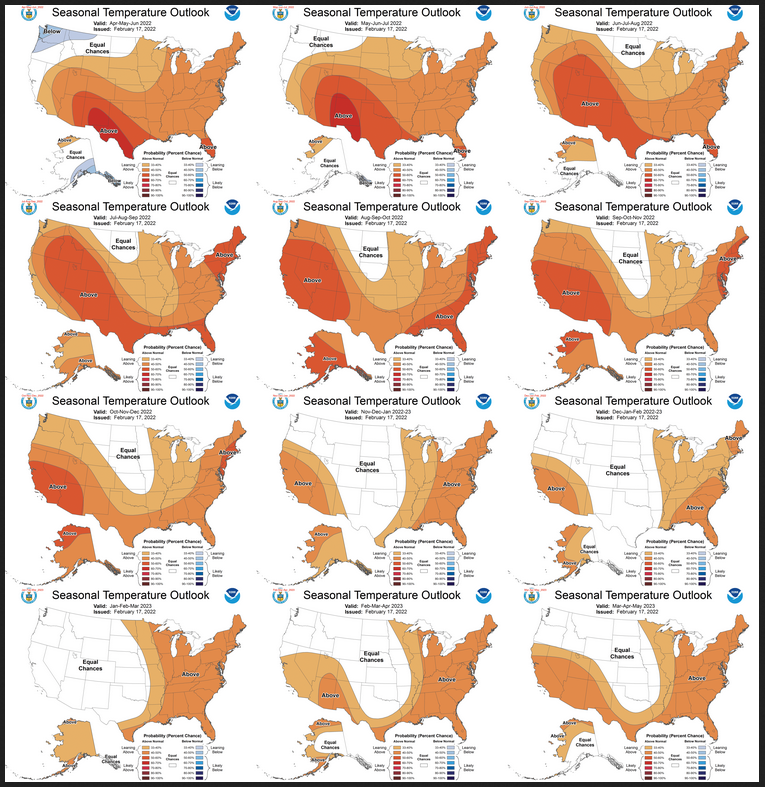
Here are the twelve three-month Temperature maps beyond the first three-month period which is shown earlier in this report.
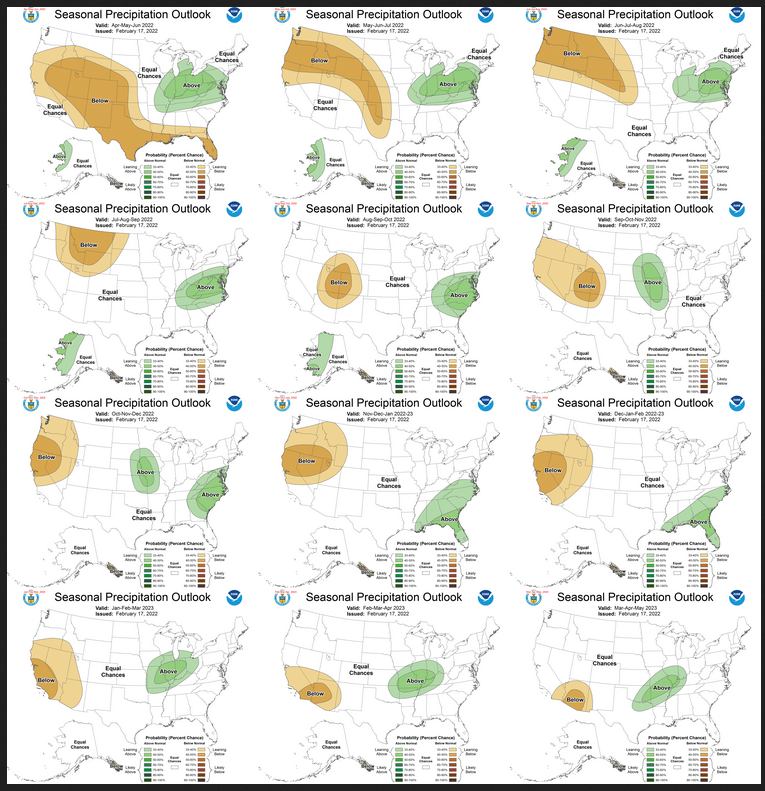
Here are the twelve three-month Precipitation maps beyond the first three-month period which is shown earlier in this report.
North American Monsoon (NAM)
NOAA Discussion
Maps tell a story but to really understand what is going you need to read the discussion. I combine the 30-day discussion with the long-term discussion and rearrange it a bit and add a few additional titles (where they are not all caps the titles are my additions). I will use bold type to highlight certain things that I feel are important. My comments if any are enclosed in brackets [ ].
CURRENT ATMOSPHERIC AND OCEANIC CONDITIONS
La Niña conditions persist across the equatorial Pacific Ocean, as indicated by current oceanic and atmospheric observations. In January 2022, below-average sea surface temperatures (SSTs) persisted across the central and eastern equatorial Pacific Ocean, with the latest Niño 3.4 SST temperature anomaly around -0.7 degrees C. Suppressed convection was evident in positive outgoing longwave radiation anomalies near the Date Line. Positive subsurface temperature anomalies have shifted eastward to around 110 degrees W longitude but remain at depth, while negative anomalies have contracted to the eastern Pacific. Low-level easterlies are mostly near average strength, while easterly wind anomalies were observed over parts of the western and eastern equatorial Pacific Ocean. Upper-level westerly wind anomalies were observed over the east-central equatorial Pacific Ocean. The tropical Pacific atmosphere is consistent with La Niña conditions. The North Atlantic Oscillation (NAO) is positive and forecast to remain positive into the beginning of March, increasing the chances of above normal temperatures over the eastern CONUS early in the season.
PROGNOSTIC DISCUSSION OF SST FORECASTS
The CPC SST consolidation for the Niño 3.4 region indicates that negative SST anomalies are likely to remain below -0.5 degrees C through MAM and then near-average from the late spring through the summer and autumn of 2022. The North American Multi Model Ensemble (NMME) mean forecast for the Niño-3.4 SST anomaly indicates a slightly slower weakening of negative SST anomalies to near -0.5 degrees C during the next six months. The official CPC/IRI ENSO outlook is for La Niña to continue into the Northern Hemisphere spring (77% chance during MAM 2022) and then transition to ENSO-neutral (56% chance during MJJ 2022).
30-DAY OUTLOOK DISCUSSION FOR MARCH 2022
The March 2022 outlooks are issued against the backdrop of an ongoing double-dip La Niña and an emerging Madden Julian Oscillation (MJO) event. The Niño 3.4 index for the period November-December-January 2021-22 stood at -1.0 degrees Celsius, which is similar in magnitude to that observed during the 2020-21 winter season. Meanwhile, the magnitude of the Real-time Multivariate (RMM) based MJO index has increased during early February, with an enhancement of the intraseasonal signal noted across the Indian Ocean. Natural analog composites derived from the current El Niño Southern Oscillation (ENSO) and MJO states depict a 500-hPa flow pattern for the month of March consistent with the negative phase of the Pacific / North American (PNA) teleconnection pattern. These composites indicate anomalous ridging over the Aleutians and adjacent areas of the North Pacific, troughing across the northwestern CONUS, and expansive ridging across most of the eastern and south-central CONUS. Dynamical guidance from the Copernicus Climate Change Service (C3S) and North America Multi-Model Ensemble (NMME) show very good agreement with the natural ENSO/MJO analogs in forecasting a negative PNA-like pattern for the month of March. This excellent consistency between dynamical and statistical guidance leads to higher than normal confidence in the March 2022 outlooks.
Statistical and dynamical guidance are in good agreement in favoring above normal temperatures across most of the eastern and central CONUS. Probabilities of above normal temperatures exceed 60 percent for parts of the Southern Plains, where warm signals from dynamical model guidance are the strongest. High probabilities of above normal temperatures (greater than 50 percent) extend eastward to most of the Eastern Seaboard and northward to the eastern Great Lakes region, where MJO composites depict a strong warm signal. Conversely, below normal temperatures are favored for the northwestern CONUS and southeastern Alaska, consistent with the negative phase of the PNA. Below normal Sea Surface Temperatures (SSTs) also played a role in tilting the odds toward below normal temperatures across much of the south coast of Alaska.`[We are probably in PDO- conditions which have prevailed for some time].
ENSO natural analogs and dynamical model guidance are in good agreement in depicting a wet signal for much of the east-central CONUS stretching from the Great Lakes region southward across the Ohio and Middle Mississippi valleys. MJO composites as well as multi-model guidance from the C3S also support a westward expansion of the wet signal, to include much of the Upper Mississippi Valley. Probabilities of above normal precipitation are greater than 50 percent from southern Michigan to western areas of the Ohio Valley, where ENSO composites and C3S guidance depict the strongest wet signals . Conversely, below normal precipitation is favored from the Southwest to the Central Plains as well as for much of the Southeast, typical of La Niña conditions. ENSO composites and dynamical model guidance generally support above normal precipitation for the northwestern CONUS. However, uncertainty is high across the West Coast, as MJO Composites favor a wetter solution farther to the south across southern California and a drier solution for the Pacific Northwest, in opposition to dynamical model guidance. The official March outlook depicts slightly elevated odds of above normal precipitation for the northwestern CONUS, consistent with the majority of dynamical model solutions. Equal chances of above, near, and below normal precipitation are indicated farther to the south across Southern California, where dynamical and statistical guidance conflict. ENSO/MJO composites depict enhanced westerly or southwesterly flow across western Mainland Alaska, suggestive of an active pattern. Therefore, above normal precipitation is favored for much of western Alaska, with support from C3S guidance. Statistical and dynamical model guidance are in good agreement in depicting a dry solution downstream across southeastern Alaska, where below normal precipitation is favored.
SUMMARY OF THE OUTLOOK FOR NON-TECHNICAL USERS (Focus on MAM 2022)
Temperature
The March-April-May (MAM) 2022 temperature outlook favors above normal seasonal mean temperatures from the Southwest, across the Central and Southern Plains, to most of the eastern half of the contiguous U.S. The largest probabilities, exceeding 60 percent, for above normal temperatures are forecast across the Rio Grande Valley. Probabilities of below normal temperatures are elevated for parts of the Pacific Northwest, northern Rockies, and southeastern Alaska.
Precipitation
The MAM 2022 precipitation outlook favors below normal seasonal precipitation amounts from southern California and the Southwest to western areas of the central and southern Great Plains, and along the Gulf Coast into the Atlantic Coast of the Southeast. Below normal precipitation is favored for coastal southern Mainland Alaska and the Alaska Panhandle. Above normal seasonal precipitation amounts are likely for parts of the Midwest, the northern Rockies, the Pacific Northwest, and much of northern and western Mainland Alaska. Equal chances (EC) are forecast for areas where seasonal mean temperatures and seasonal accumulated precipitation amounts are expected to be similar to climatological probabilities.
BASIS AND SUMMARY OF THE CURRENT LONG-LEAD OUTLOOKS
PROGNOSTIC TOOLS USED FOR U.S. TEMPERATURE AND PRECIPITATION OUTLOOKS
Dynamical model guidance such as the North American Multi-Model Ensemble (NMME) and the Calibration, Bridging, and Merging (CBaM) version of the NMME were used through lead 5. La Niña temperature and precipitation composites and regressions based on Niño 3.4 SST anomalies were primarily relied upon for MAM and AMJ 2022. The consolidation tool, which includes both the NMME and various statistical tools as inputs, was also used, especially after the predicted transition to ENSO-neutral conditions by early summer. At longer leads, from 6 to 13 months (ASO 2022 to MAM 2023), decadal trends represented by the optimum climate normals (OCN) were a significant driver of the climate outlooks. [This shows the phasing in of different tools as the forecast progressed from the transition from La Nina to ENSO Neutral and beyond to where the ENSO state is difficult to predict at this point in time.]
PROGNOSTIC DISCUSSION OF OUTLOOKS – MAM 2022 TO MAM 2023
TEMPERATURE
Only minor adjustments were made to the previous temperature outlooks, released in January 2021, {I disagree] as La Niña continues to be the major driver of the predicted climate during MAM 2022, and a transition to ENSO-neutral conditions is expected thereafter. Below normal temperatures are favored for the Pacific Northwest across parts of the Northern Rockies, consistent with current dynamical model guidance and La Niña conditions. Probabilities of above normal temperatures were increased across the Rio Grande Valley, with increased confidence of a continuing La Niña into MAM and AMJ 2022. The probabilities for above normal temperatures were increased for parts of the Northern Plains from MAM 2022 through the first several leads into autumn, supported by the NMME dynamical model forecasts, and with snow cover and soil moisture deficits over some areas impacting the MAM 2022 outlook. While the NMME dynamical model guidance favors more extensive below normal temperatures across much of Mainland Alaska, statistical tools and the CBaM tool favors more extensive above normal temperatures over central and northern Alaska. The area of enhanced probabilities of below normal temperatures is confined to southeastern Mainland Alaska and the Alaska Panhandle in the outlooks for MAM and AMJ 2022. As the leads progress through spring into summer and longer leads, above normal temperatures are favored over a greater area of Mainland Alaska related to decadal trends , as well as across much of the CONUS, especially during the summer seasons.
PRECIPITATION
The precipitation outlook for MAM 2022 is consistent with canonical La Niña impacts and recent model guidance. The probabilities for below normal precipitation were increased across much of the West from AMJ through JAS 2022, consistent with NMME forecasts and the consolidation tool. Areas of enhanced probabilities of above normal precipitation over parts of the Midwest and the Mid-Atlantic regions and for western Mainland Alaska from AMJ 2022 through ASO 2022 are consistent with current model guidance from the NMME and with the consolidation tool. At longer leads, the precipitation outlooks generally rely on the decadal trends and guidance from the consolidation of statistical tools. Below normal precipitation is favored over substantial areas of the western CONUS from autumn through next winter, while above normal precipitation is favored for some regions of the central and eastern CONUS at longer leads, related to decadal timescale trends . Decadal timescale trends favor below normal precipitation for the southern Alaska Panhandle through all leads.
Resources
Review of January Climate
Let’s get started. Here is how John Bateman starts his email.
Then he presents this graphic:
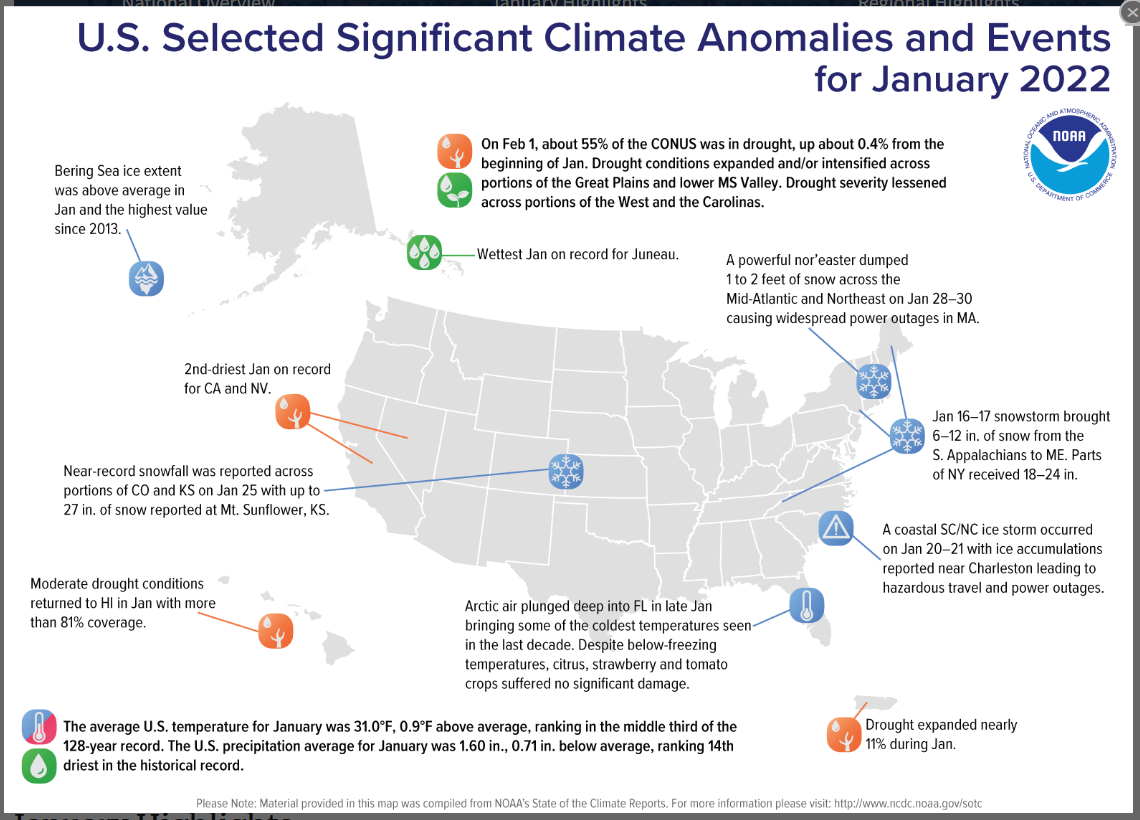
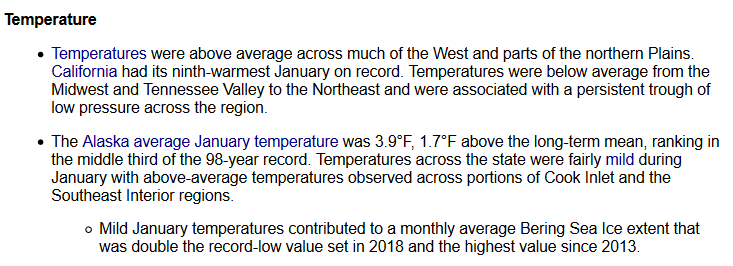
These are the events in January that NOAA thought were especially noteworthy. I am not going to comment on them because John Bateman does that below, at least for some of them.
Details regarding weather anomalies
So let us see what he has to say. In two places where he typed the date, there is a blank space but that is not missing data just a blank space that got introduced somehow.
The Bering Sea Ice information is interesting. What made the Bering Sea Ice expand?
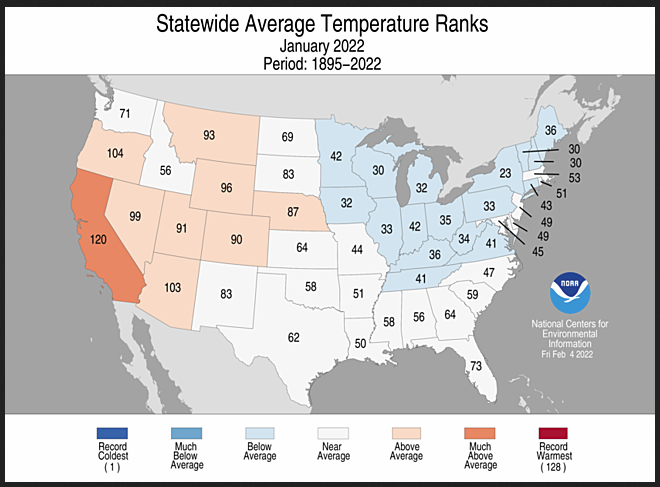
Temperature rankings by state
The above shows the ranking of each state in the 128-year history which is considered to be the most reliable part of our data. No state had record temperatures. One state was much above average and there were eight states above average. I hope I have this right that seventeen states were below average. So how does that result in a slightly above average temperature for January? Notice that the warm states are larger than the cool states. That is one of the reasons I used this map.
Precipitation rankings by state
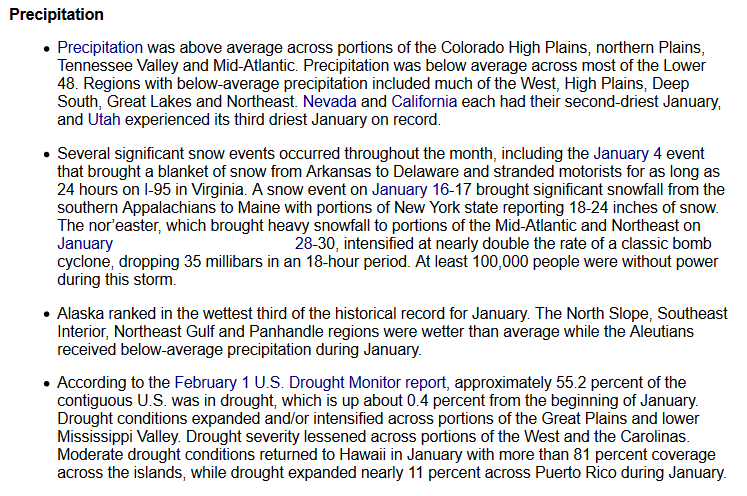
So how do the above bullet points translate into a dry year? Let’s take a look.
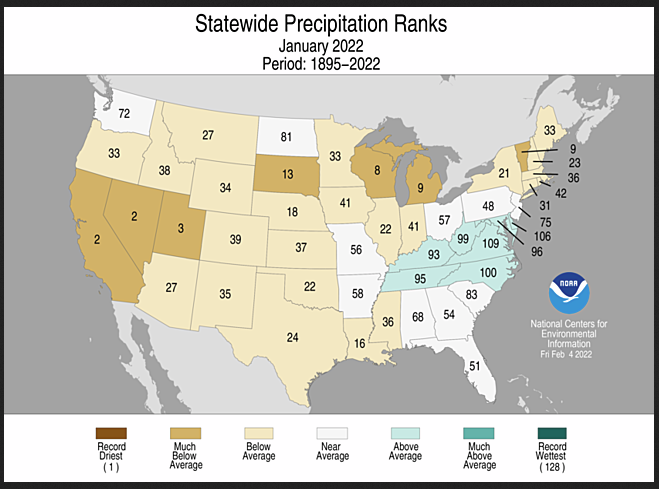
The above shows the ranking of each state in the 128-year history which is considered to be the most reliable part of our data. No state had record dryness but two states had the second driest year in their history and one had the third driest year. There are seven states with above-average wetness. White is near average and yellow, tan, and dark brown are below, much below, or record dry. So there are far more states in those categories than blue, green, and black. I have not counted all the states that were below average but there are only seven states above average or wetter. Actually, there are no states much above average or record wetness.
This simply supports the bullet points above the graphic that this was a very dry January.
