 Introduction

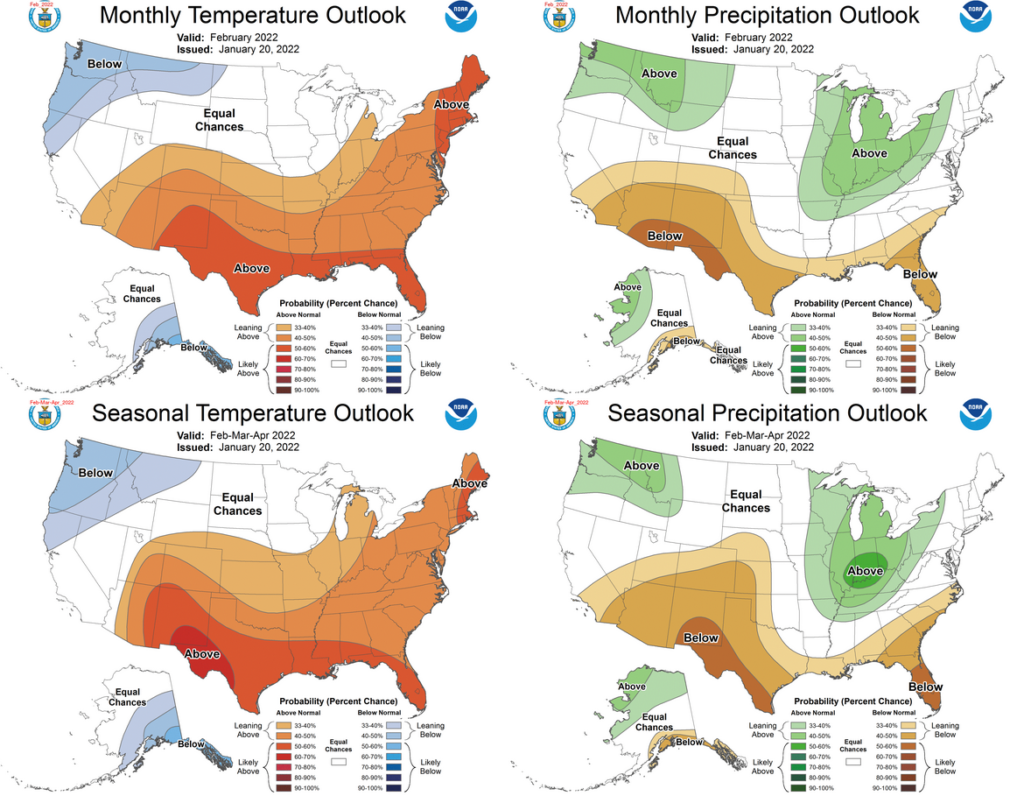
Combination Early Outlook for February and Three-Month Forecast.
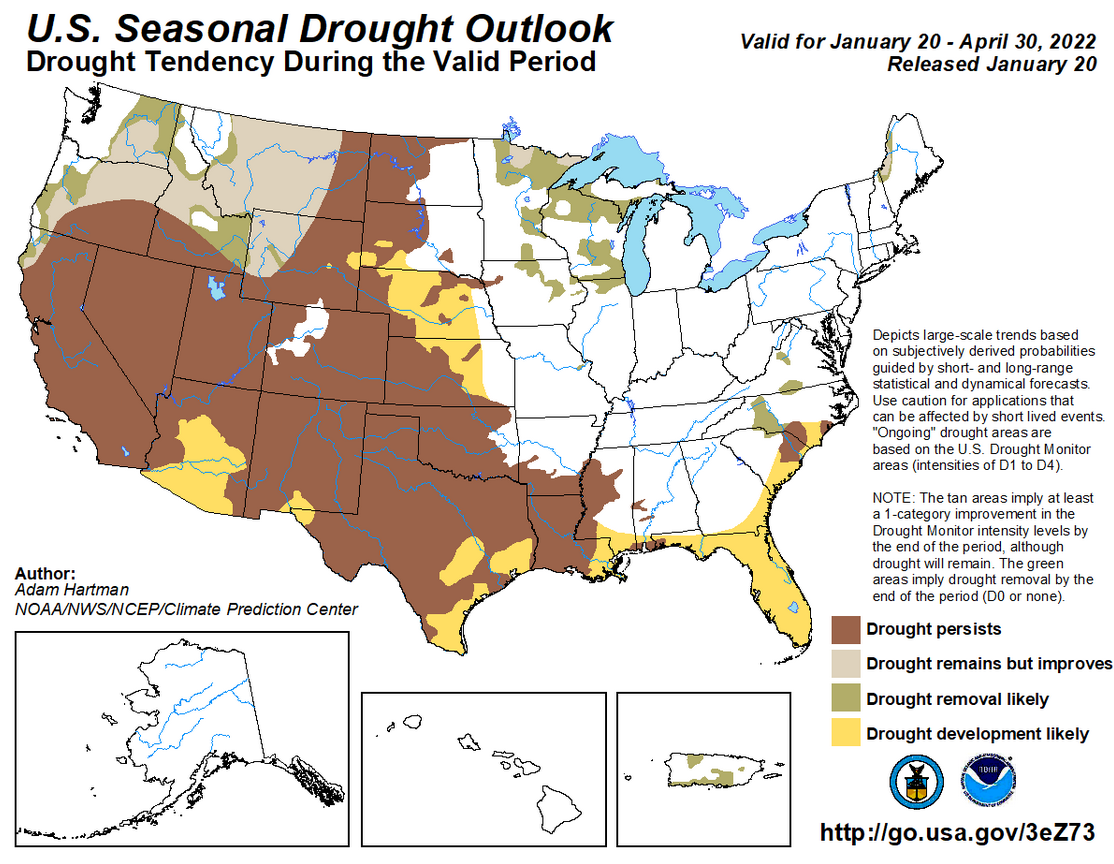
Drought Forecast
Looking out Four-Seasons.
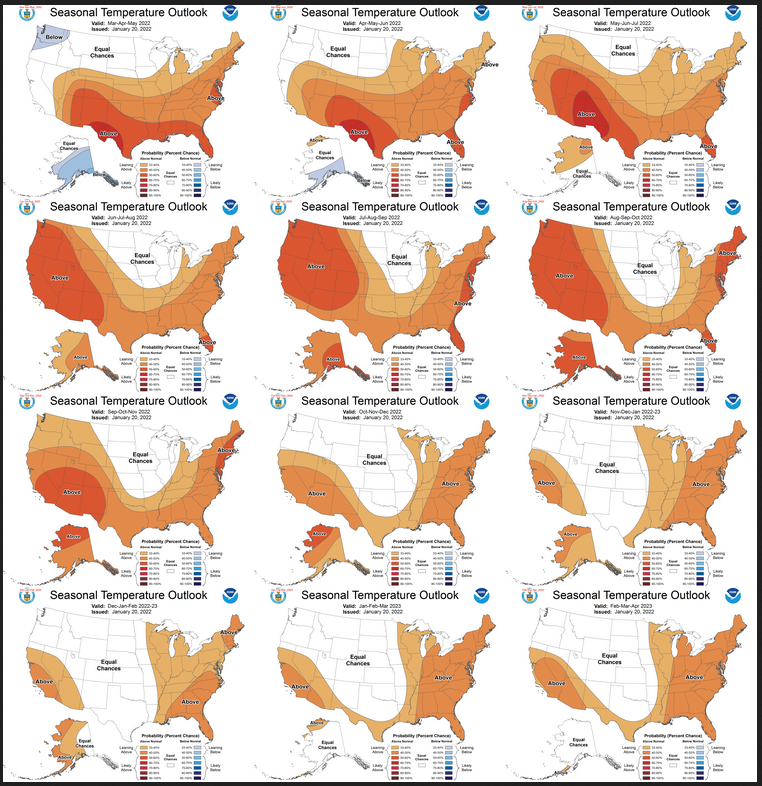
I am going to include the twelve Temperature maps now.
I am going to include the twelve Precipitation maps now.
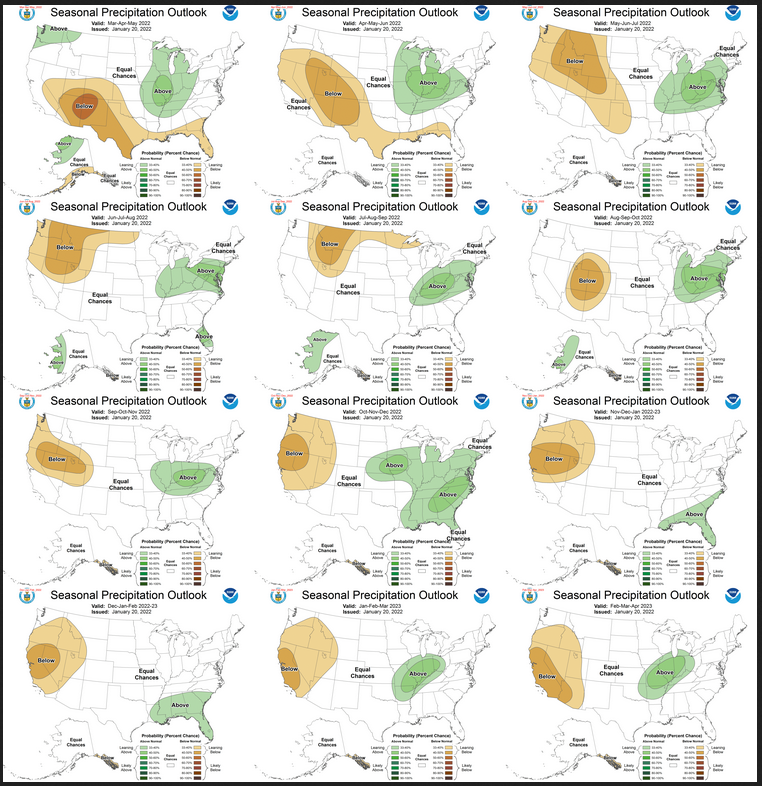
Similar to Temperature what we see here is on the first row March/April/May (MAM) since FMA is considered the near-term. So on the first row you have MAM followed by AMJ followed by MJJ. Then when you drop down to the second row you have from left to right JJA, JAS, ASO and on the next row, SON, OND, NDJ as you move into 2023. And then on the bottom row you have DJF, JFM and FMA 2023.
NOAA Discussion
Maps tell a story but to really understand what is going you need to read the discussion. I combine the 30-day discussion with the long-term discussion and rearrange it a bit and add a few additional titles (where they are not all caps the titles are my additions).
Let’s see if I have any comments to make. I think mostly I will use bold type to highlight some things that are important. My comments if any are enclosed in brackets [ ].
CURRENT ATMOSPHERIC AND OCEANIC CONDITIONS
Oceanic and atmospheric observations reflect La Niña conditions. In December 2021, below-average sea surface temperatures (SSTs) across the central and eastern equatorial Pacific Ocean were consistent with a mature La Niña. With the exception of the westernmost Niño-4 region, which warmed to -0.2°C at the end of the December, the other Niño indices were between -0.4°C and -1.1°C during the first week of Jan 2022. Below-average subsurface temperatures weakened east of the Date Line, reflecting the slow eastward movement of positive temperature anomalies, at depth, from the western into the central Pacific Ocean. However, below-average subsurface temperatures still dominated the eastern Tropical Pacific from ~200m to the surface. Low-level easterly wind anomalies and upper-level westerly wind anomalies prevailed over the east-central and eastern Pacific Ocean. Enhanced convection persisted near Indonesia and the western Pacific, while suppressed convection remained over the Date Line.
The Madden-Julian Oscillation (MJO) weakened during early Jan after slow propagating across the Western Pacific during December. Destructive interference with the ongoing La Niña has likely resulted in the weakening, though the Niño4 SST index was also likely slightly warmer due to this interaction. The MJO is not likely to play a large role in the observed seasonal patterns of temperature and precipitation.
PROGNOSTIC DISCUSSION OF SST FORECASTS
The CPC SST consolidation for the Niño-3.4 region depicts negative SST anomalies remaining at or below -0.5 degrees C through FMA and then near average from the late spring through the summer and autumn of 2022. The North American Multi Model Ensemble (NMME) ensemble mean forecast for the Niño-3.4 SST anomaly depicts a slightly slower transition to near average during the next six months. The official CPC/IRI ENSO outlook is for La Niña to continue into the Northern Hemisphere spring (67% chance during MAM 2022) and then transition to ENSO-neutral (51% chance during AMJ 2022).[We discussed this in an article last week https://econcurrents.com/2022/01/14/noaa-extends-la-nina-forecast/ ]
30-DAY OUTLOOK DISCUSSION FOR FEBRUARY 2022
La Niña conditions persist across the equatorial Pacific, with persistent negative SST anomalies in recent weeks over much of the east-central Pacific Ocean. Convection continues to be suppressed near the Date Line. Low-level easterly winds are enhanced over parts of the east-central and eastern equatorial Pacific Ocean, while upper-level westerly winds are enhanced across most of the central and eastern equatorial Pacific Ocean. The RMM-based Madden Julian Oscillation (MJO) index indicates MJO conditions have weakened, and there is no clear MJO signal in most dynamical model forecasts. The ECMWF and CFSv2 however forecast a potential reemergence of the active phase of the MJO in the western Pacific in the next couple weeks. Though La Niña is forecasted to persist into boreal spring, dynamical model forecasts for the next several weeks into the beginning of February are inconsistent with a canonical La Niña pattern. However, given uncertainty in subseasonal variability later in February, the La Niña base state and typical impacts of La Niña are reflected in the dynamical model temperature and precipitation forecasts for February and play a significant role in the February temperature and precipitation outlooks. The February 2022 monthly temperature and precipitation outlooks are based primarily on dynamical model forecast guidance from the North America Multi-Model Ensemble (NMME) and statistical forecast guidance, including the constructed analog, canonical correlation analysis, and ENSO-OCN tools. Both dynamical and statistical models are largely forced by persistent La Niña conditions. Although La Niña conditions are expected to transition to ENSO neutral conditions in the late spring, February climate conditions are expected to be impacted by La Niña. In addition, the outlooks for some areas of the forecast domain consider current land surface soil moisture and snow cover and nearby ocean surface temperatures.
Temperature
The February 2022 temperature outlook favors below-normal temperatures for the south coast of Alaska east of the Alaska Peninsula, southeastern Mainland Alaska, and the Alaska Panhandle, supported by dynamical model guidance from the NMME, as well as the consolidation of statistical and dynamical temperature tools. Below-normal temperatures are also favored for parts of Northern California, the Pacific Northwest, the Northern Rockies, and the northern High Plains, consistent with canonical La Niña impacts. Statistical guidance and the latest CFSv2 dynamical model forecasts suggest the potential for more extensive below-normal temperatures into the Northern Plains and Midwest region, reflecting potential impacts of La Niña. The potential for larger scale below-normal temperatures into the Midwest is also associated with the possible reemergence of Western Pacific MJO activity. This pattern of large-scale below-normal temperatures is inconsistent with the consolidated NMME forecast, as well as the consolidation of both statistical and dynamical model guidance, which favor above-normal temperatures for much of the central and eastern CONUS. The February outlook favors above-normal temperatures across much of the southwestern CONUS from Southern California across the Southern and Central Rockies into the Southern and Central Plains, supported by both NMME dynamical model forecasts and the consolidation. Above-normal temperatures are favored for parts of the Lower and Central Mississippi Valley, eastern areas of the Midwest, and the Eastern Seaboard, primarily supported by dynamical model forecasts from the NMME. Probabilities of above-normal temperatures are greatest, exceeding 50 percent, from parts of the Southwest along the Rio Grande Valley and Gulf Coast to the Florida Peninsula, as well as for much of the Northeast, where dynamical model forecasts are consistent. A large area of equal chances of below-, near-, and above-normal temperatures is predicted for much of the Northern Plains and western Great Lakes region, where there is inconsistency among temperature tools.
Precipitation
The February outlook favors above-normal precipitation for northwestern Mainland Alaska and below-normal precipitation for the south coast of Mainland Alaska and parts of the northern Alaska Panhandle, supported by dynamical model forecasts and consistent with La Niña impacts. Dynamical models predict above-normal precipitation for parts of the Alaska Panhandle early in the month, resulting in a forecast of equal chances in the February outlook. Above-normal precipitation is favored for much of the Pacific Northwest eastward across the Northern Rockies into the northern High Plains, consistent with most dynamical and statistical model forecasts and canonical La Niña impacts. Above-normal precipitation is also likely from the Central Mississippi and Ohio Valleys northward across most of the Great Lakes region, following canonical La Niña patterns and the consolidation of precipitation forecast tools. Below-normal precipitation is likely across the southern tier of the CONUS, including most of the Southwest, parts of the Southern Plains, the Gulf Coast, the southern Atlantic coast, and the Florida Peninsula. The February precipitation outlook generally reflects canonical precipitation patterns due to La Niña. Equal chances of below-, near-, and above-normal precipitation is predicted where there is greater uncertainty among precipitation tools.
SUMMARY OF THE OUTLOOK FOR NON-TECHNICAL USERS (Focus on February-March-April 2022)
Temperature
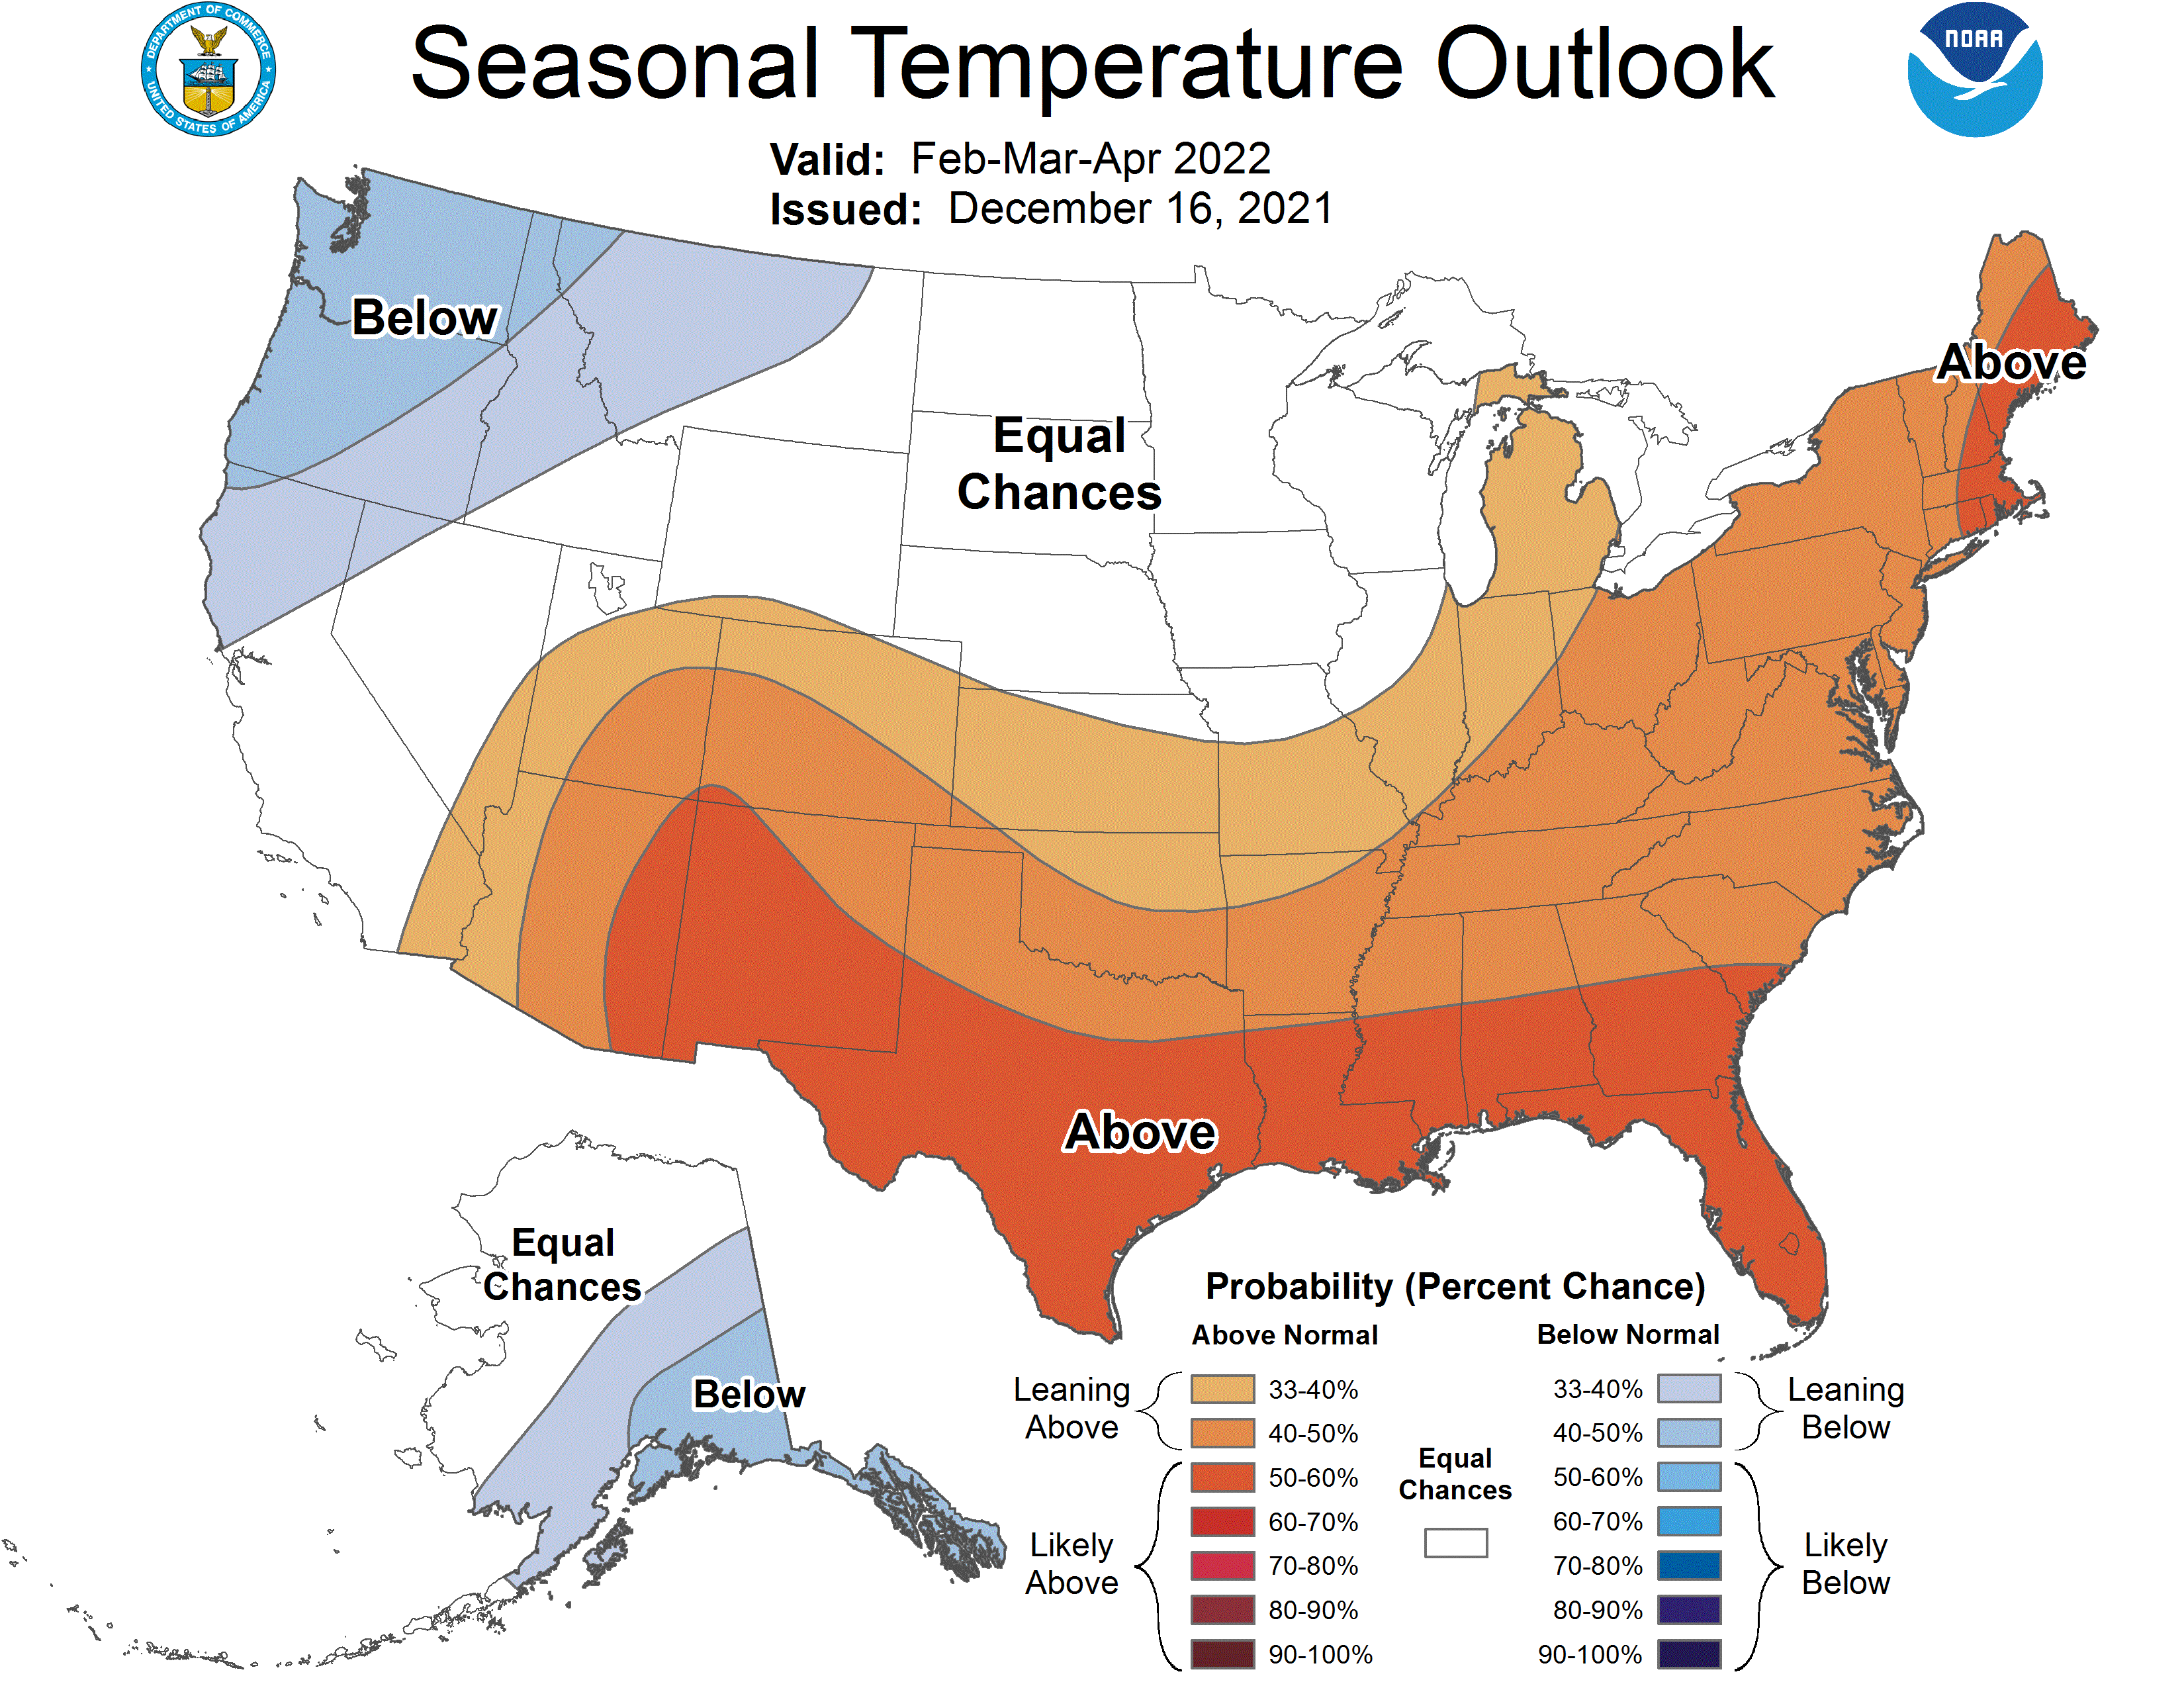
The February-March-April (FMA) 2022 temperature outlook favors above-normal seasonal mean temperatures from the Southwest, across the Central and Southern Plains, to the entire eastern third of the contiguous U.S. The largest probabilities (above 60 percent) for above-normal temperatures are forecast across the Rio Grande Valley. Probabilities of below-normal temperatures are elevated for parts of the northern Rockies, Pacific Northwest, northern California, and much of Alaska.
Precipitation
The FMA 2022 precipitation outlook favors below-normal seasonal precipitation amounts from southern California and the Southwest to the central and southern Great Plains, then east to parts of the Southeast. Below-normal precipitation is slightly favored for most of coastal southern Mainland Alaska and the Alaska Panhandle. Above-normal seasonal precipitation amounts are most likely across the Great Lakes, Ohio and Tennessee Valleys, northern Rockies, Pacific Northwest, and much of northern and western Mainland Alaska. Equal chances (EC) are forecast among areas where seasonal mean temperatures and seasonal accumulated precipitation amounts are expected to be similar to climatological probabilities.
BASIS AND SUMMARY OF THE CURRENT LONG-LEAD OUTLOOKS
PROGNOSTIC TOOLS USED FOR U.S. TEMPERATURE AND PRECIPITATION OUTLOOKS
Dynamical model guidance such as the North American Multi-Model Ensemble (NMME) and the Calibration, Bridging, and Merging (CBaM) version of the NMME were used through lead 5. La Niña temperature and precipitation composites were a major tool relied upon through MAM 2022. The consolidation tool, which includes NMME input and various statistical tools, was also used especially after the predicted transition to ENSO-neutral conditions by late spring. At longer leads, such as 7-13 (ASO 2022 – FMA 2023), trends (as represented by OCN) played a larger role.
PROGNOSTIC DISCUSSION OF OUTLOOKS – FMA 2022 TO FMA 2023
TEMPERATURE
Only minor adjustments were made to the previous temperature outlooks, released in Dec 2021, as La Niña continues to be the major contributor to the predicted climate state during FMA and MAM 2022. Odds for above normal temperatures were decreased across Southern CA and Arizona, reflecting the latest model guidance and consolidations. Odds for above normal temperatures were increased in the Rio Grande, as the confidence around La Niña and the corresponding impacts are just slightly higher as the lead time to FMA is now shorter. Correspondingly, odds for below normal temperatures were increased for parts of southeastern Mainland Alaska and the Alaska Panhandle. Through the spring of 2022, odds for above normal temperatures were increased across much of the Upper Mississippi Valley in response to the latest model guidance and a current lack of snowpack, which is not likely to recover dramatically. This outlook is contrary to the signal from trends in that region, so odds are modest. The summer (JJA) 2022 temperature outlook generally favors above normal temperatures, with only a small reduction in the odds made over the Northern Rockies as compared to last months’ outlooks, as new model guidance for that period indicates a cooler signal. The outlooks for JAS 2022 through JFM remain largely unchanged, reflecting OCN based information.
PRECIPITATION
The precipitation outlooks for FMA and MAM 2022 are consistent with La Niña composites and recent model guidance. Increased odds for above normal precipitation in the Ohio Valley and in the Northern Rockies reflect a bit more amplified pattern and reduced uncertainty relative to last month’s outlooks due to shorter lead time. That increased certainty is also translated to the MAM 2022 outlook, where odds of below normal precipitation were increased in the Four Corners region, and a slight tilt toward above normal precipitation was added to the northwestern CONUS, reflecting the latest model guidance. Outlooks for AMJ through JJA were modestly adjusted to reflect the latest model guidance and ensure continuity in the outlooks. Further out in the outlook package, JJA through SON, trends and a consolidation of statistical tools were the main inputs for the outlooks from JAS 2022 through FMA 2023. The outlooks for JAS through OND generally favor below normal precipitation across an area from the Central Rockies to the Pacific Northwest and above normal precipitation in the Ohio Valley. For next winter, the outlooks reflect the longer-term trends.