Updated on January 14, 2022 by adding a graphic. On the second Thursday of every month, NOAA issues its analysis of the status of ENSO. This includes determining the Alert System Status. Although the current status remains the same as La Nina Advisory, the forecast has been adjusted somewhat from last month. The earlier forecast was that we would transition to ENSO Neutral Status very soon. Now it looks like the La Nina will extend into Spring. The impact of that will show up next Thursday when NOAA issues their Seasonal Outlook. The NOAA ENSO Status Update provides an advance indication of how the forecast might change.

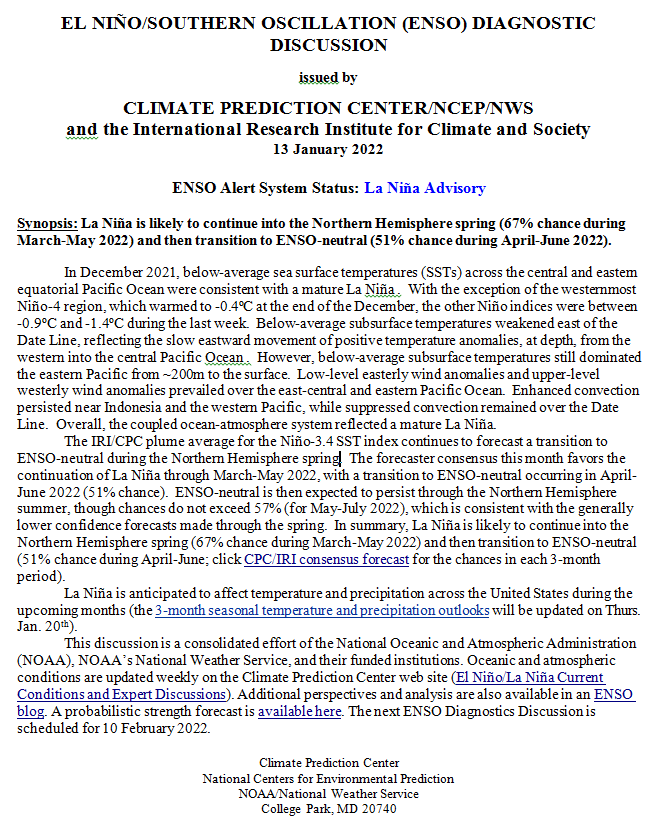
CLIMATE PREDICTION CENTER ENSO DISCUSSION
IRI CPC ENSO STATE Probability Distribution
Here are the new forecast probabilities. This information is released twice a month and the first release is based on a survey of Meteorologists. The probabilities are for three-month periods e.g. DJF stands for December/January/February.
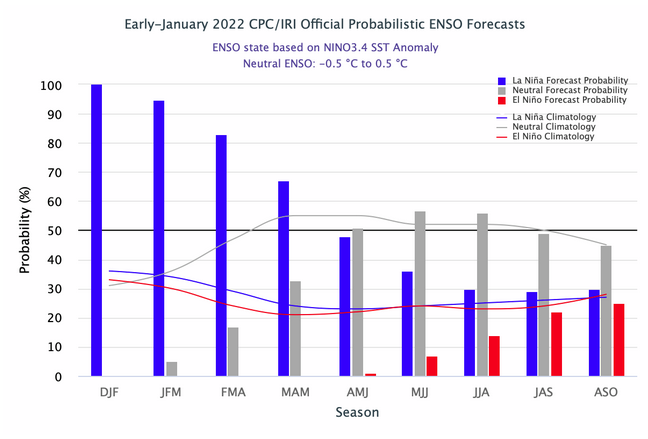
Sometimes it is useful to compare this to the forecast from the prior month. I do not have that handy but I do have the forecast from the second half of December (December 20, 2021). That forecast is based on the computer model results from around the world so there is a certain amount of comparing apples to oranges but I think it is still very useful to compare the two forecasts.

What you can see is that the new model shows La Nina lasting longer than the prior forecast. The new forecast indicates equal probabilities of La Nina or ENSO Neutral by AMJ 2022 while the old model showed that ENSO Neutral became more likely by MAM. The new model shows that ENSO Neutral will be more likely by MJJ. So this is really an extension of La Nina by about two months. That is a big change.
What Does the NOAA Proprietary ENSO Model Forecast?
I originally had the below side by side but to do that I had to have them be half the size and they there were difficult to read so I changed them into full size so they are now one below the other with the older results first and the newer results follow:
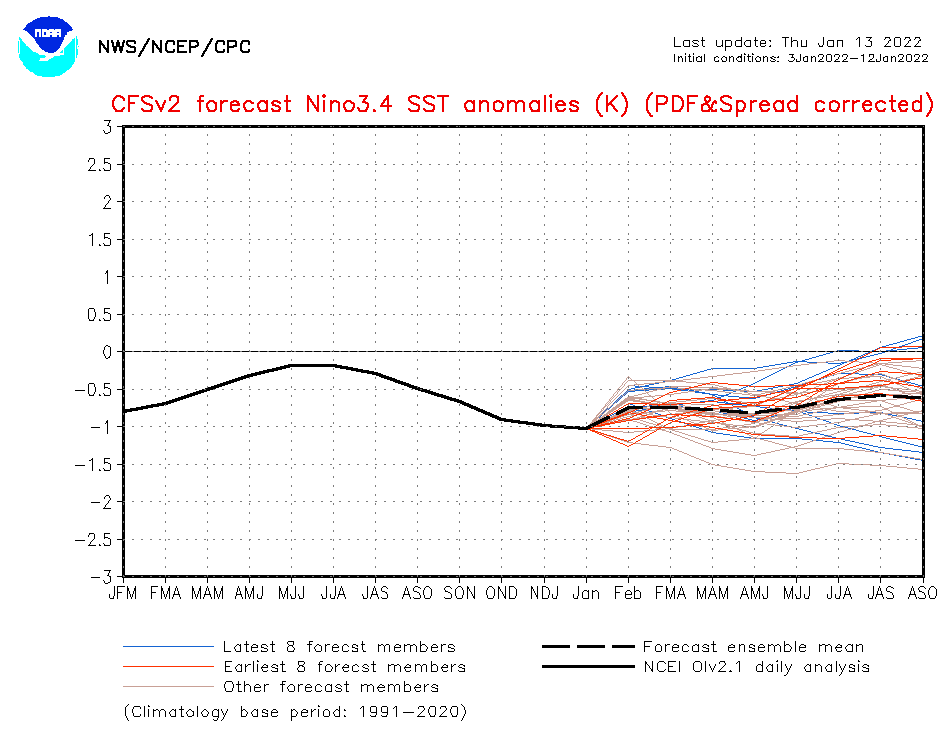
It is harder to compare them this way but the newer bottom graphic is different than the forecast on January 5, 2022.
This model suggests that we are still in La Nina conditions. One part of the definition of La Nina is the temperature anomaly of the Nino 3.4 area of the Eastern Pacific Ocean. An anomaly colder than 0.5 C is associated with La Nina conditions. But some believe that the direction of the trend is important not just the absolute value of the anomaly.
The Subtle Change
I have shown the results of the model on June 5 and June 12, 2022, and you can see the slight change. The new forecast from this model is flatter. That may or may not be important but it is a surprise to me. According to this newer version of the model, La Nina may be more persistent than it appeared a week ago. It is not a huge change since a week ago. But I pay attention to small changes as they may signal that more changes will be coming. The dashed line is the mean of the earlier forecasts and the latest forecasts. So if the new model runs are changing, the dashed line may not fully reflect the more recent model runs. I will repeat this exercise in my article next Thursday to see if this change is continuing.
You can find updates to the NOAA Proprietary ENSO Forecasting Model at https://www.cpc.ncep.noaa.gov/products/people/wwang/cfsv2fcst/images3/nino34SeaadjPDFSPRDC.gif
Sea Surface Temperature Anomalies
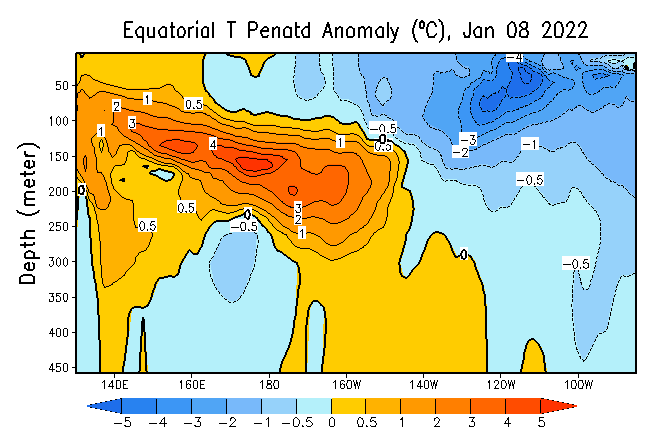
I did not have enough time yesterday to find this graphic. It is a cross-section of sea surface temperature anomalies (five-day average centered on the date shown) at various depths along the Equator in the Pacific Ocean. ENSO is usually measured between 170W and 120W but also five degrees north and south of the Equator which is not shown here. What counts is the temperature anomaly at the surface as that is what interacts with the atmosphere. The subsurface may tell us how the surface might change in the future. I did not have this to look at yesterday but looking at it now it is shocking. The warm water from the IndoPacific Warm Pool is not even close to undermining the cool anomaly and replacing it. Remember this is showing anomalies so a warm anomaly does not necessarily rise. It may be warmer than usual but still colder than the water above since oceans tend to be colder in deeper water. So looking at this graphic I can see why NOAA has extended the time when this La Nina will switch to ENSO Neutral. It is beyond the scope of this article for me to explain the complicated dynamics of what causes the transition to take place.
An updated version of this graphic can be found at https://www.cpc.ncep.noaa.gov/products/analysis_monitoring/ocean/weeklyenso_clim_81-10/wkteq_xz.gif It comes with an upper graphic like what is shown above which is the temperature anomalies and a lower graphic which is the actual water temperatures. Both are useful.
What are the Typical Impacts of La Nina
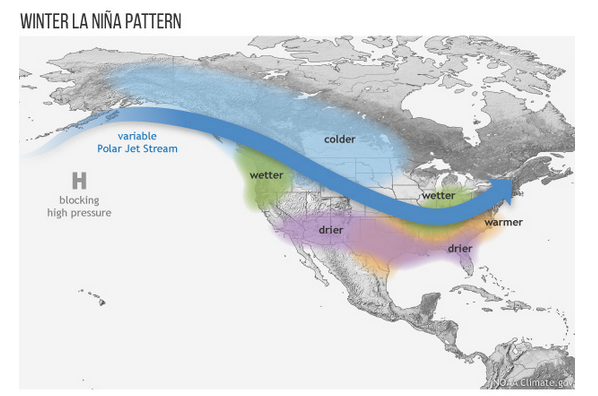
Above is what we have now or at least it is typically what we would get with a La Nina. That does not mean that winter weather follows this pattern every single day. It just means that this is the typical pattern with a typical La Nina.
This compares to the below image.
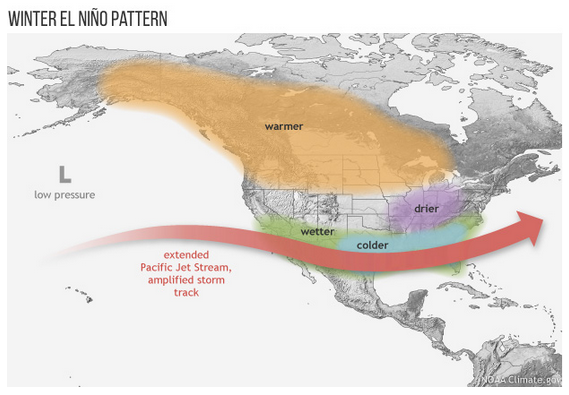
The pattern is very different. One major difference is the location of the Jet Stream. For El Nino it is much farther south. This generally means that more of CONUS is cooler and storms from the Pacific tend to enter CONUS from the west but farther south. With La Nina which is our current pattern, the Jet Stream is farther north but it has more of a wavy pattern. Thus tracking the low-pressure systems as they cross CONUS may be more challenging and there can be more cold air intrusions perhaps.
ENSO is not the only factor that impacts our weather and no two El Ninos or La Ninas are identical. But it is a major factor so we pay a lot of attention to it.
Has recent weather been consistent with the La Nina pattern?
I think the answer is yes. Some of this is discussed in the article I published a couple of days ago which can be accessed at https://econcurrents.com/2022/01/12/assessing-the-u-s-climate-in-2021/
I think this graph provides some insight into the problem that weather forecasters have.
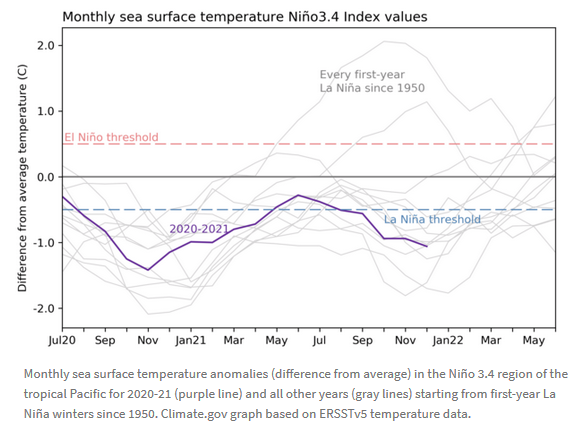
ENSO is not strictly Trinary with three uniform states La Nina, Neutral, and El Nino. We have had what is called a double-dip La Nino with a short break of ENSO Neutral. So the intensity of the La Nina has been increasing but is now expected to decrease. And it is important to recognize that ENSO occurs along the Equator in the Eastern Pacific so it takes a while for it to impact the mid-latitudes where CONUS is located.
It is a little hard to see on this chart but the gray lines show how prior La Ninas evolved both in the year that they occurred and the subsequent year. So double-dip La Ninas are fairly common but some La Ninas are followed immediately by an El Nino. It is unlikely that we will have a triple-dip La Nina
Does JAMSTEC have anything to add?
Below is the recently released JAMSTEC forecast:
ENSO forecast:
A canonical-type La Niña is now observed. The SINTEX-F predicts that the La Niña state will be closer to a La Niña Modoki-like state later, then decay in boreal late spring.
The SINTEX-F also predicts that a weak California Niño will occur in boreal late winter.
Indian Ocean forecast:
As predicted earlier, the negative Indian Ocean Dipole and the positive Subtropical Indian Ocean Dipole decayed in December.
The SINTEX-F predicts that a weak Ningaloo Niño will occur in austral late summer.
Regional forecast:
On a seasonal scale, the SINTEX-F predicts that most parts of the globe will experience a warmer-than-normal condition in February–April average, except for Alaska, western Canada, northwestern U.S.A., some parts of Greenland and Brazil.
As regards to the seasonally averaged rainfall in February–April average, a drier-than-normal condition is predicted for southern coastal regions of Alaska, most part of U.S.A., Mexico, La Plata Basin, Madagascar, Mozambique, Zimbabwe, northern Mediterranean, some parts of the Middle East, Pakistan, Nepal, northern India, some parts of Indonesia, and southeastern parts of China. In contrast, most part of Canada, Brazil, northern/western Australia, South Africa, central Africa, Scandinavia, some parts of Indochina, Philippines, some parts of China and Eurasia will experience a wetter-than-normal condition.
The model predicts most part of Japan will experience a warmer and drier-than-normal condition in February–April average.
The model also predicts persistence of a similar condition over most part of the world in March–May average.
What is a California Nino?
Here is the press release that was issued by JAMSTEC when they discovered it. https://www.offshore-energy.biz/jamstec-scientists-study-california-ninonina-anomaly/
And here is the full explanation. https://www.nature.com/articles/srep04801
I have the JAMSTEC forecast maps but I have not had a chance to study them. I think they are predicting unusual warming off the coast of Baja California. 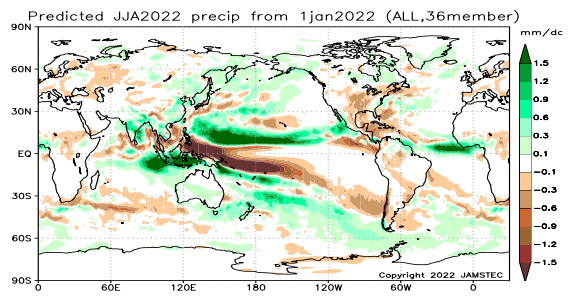 OK, I could not resist and I am showing the JAMSTEC World Precipitation Forecast for JJA (summer). The temperature forecast shows the same thing. So it looks to me like a typical pattern of La Nina withdrawal.
There is a lot of discussion of the connection if any between this phenomenon and the normal ENSO Cycle. JAMSTEC says they are not related but this looks like a case where it is related. If JAMSTEC is correct (and that is a big if), it is suggesting a poor Monsoon to the east and a normal Monsoon to the west with the potential for surges into Arizona and Southern California. It is too early to have a lot of confidence in this forecast but it is interesting to think about.
This is the author Sig Silber. When I wrote this article on Thursday January 13, I was surprised that the forecast for the end of this La Nina had been moved out by about two months. I was too tired to research it to better understand it but decided to do so this evening and it was clear why and I added an additional graphic to try to explain it. So if you have already read the article, you might want to read it again an look for the graphic about the ocean temperature anomalies.
I submitted the following comment in response to a comment by William Mee but I thought he was referring to this article. So my reply to his comment applies more here than there so I am repeating it here.
Most likely bad news for New Mexico and a number of other states but I thought I would let CPC (part of NOAA) address that in their Seasonal Outlook which will be issued this Thursday. When I look at the subsurface analysis I wonder when this La Nina will be over. I also have thoughts about whether or not our current approach to assessing ENSO is impacted by Warming. I will be writing more on this. ENSO impacts the weather around the World. Plus it impacts marine life.